Benzinga - by The Arora Report, Benzinga Contributor.
To gain an edge, this is what you need to know today.
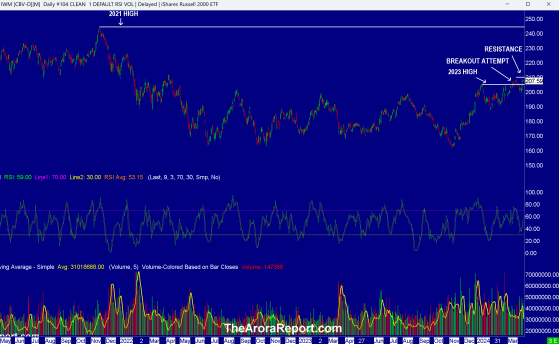
Opportunities In Small And Micro Caps Please click here for an enlarged version of the chart of iShares Russell 2000 ETF (ARCA: IWM) which represents small cap equities.
Note the following:
- The chart shows small caps are still well below the high from 2021. This is occurring at a time when S&P 500 is well above its 2021 high. Nasdaq is even higher.
- The chart shows a breakout attempt earlier this year that failed.
- The chart shows small caps are at a resistance level.
- If small caps can breakout from here, potentially, there is a significant opportunity. The disparity between S&P 500 and small caps will ultimately be resolved by either small caps moving much higher or S&P 500 moving lower.
- A part of the problem with IWM is that it contains a large number of small banks that have exposure to commercial real estate. On the other hand, the momo crowd’s AI darling Super Micro Computer Inc (NASDAQ: SMCI) has become a major force behind day-to-day moves in IWM.
- The Fed’s decision to shrug off inflation is positive for small caps and micro caps.
- As a full disclosure, both small caps and micro caps are in the ZYX Allocation Model Portfolios by The Arora Report. This is where you will find the buy zones.
- Prudent investors need to be aware of the conventional wisdom and the consensus. However, prudent investors should be equally aware that the conventional wisdom and consensus are often wrong. When investors incorporate this simple observation, it dramatically improves the results they can achieve. There is a perfect learning moment at hand. The conventional wisdom as well as the consensus was that Apple Inc (NASDAQ: AAPL) is so beloved that investors would simply shrug off the antitrust lawsuit against Apple. That conventional wisdom and consensus has proven wrong. Yesterday, Apple lost over $110B in market value due to the lawsuit.
- As a full disclosure, AAPL stock is long from $4.68 in the ZYX Buy Model Portfolio by The Arora Report. The Arora Report's call in January was to partially hedge the position. The Arora Report's call yesterday was to hedge more.
- In another sign of consumers slowing down their spending binge, especially at the low end, spending is slowing on athletic wear and shoes. After earnings, Nike Inc (NYSE: NKE) stock has fallen about 7% as of this writing. After earnings, the stock of Lululemon Athletica Inc (NASDAQ: LULU) has fallen about 12% as of this writing.
Magnificent Seven Money Flows In the early trade, money flows are positive in Alphabet Inc Class C (NASDAQ: GOOG).
In the early trade, money flows are neutral in AAPL, Meta Platforms Inc (NASDAQ: META), Microsoft Corp (NASDAQ: MSFT), and Amazon.com, Inc. (NASDAQ: AMZN).
In the early trade, money flows are negative in NVIDIA Corp (NASDAQ: NVDA) and Tesla Inc (NASDAQ: TSLA).
In the early trade, money flows are mixed in SPDR S&P 500 ETF Trust (ARCA:SPY) and Invesco QQQ Trust Series 1 (NASDAQ: QQQ).
Momo Crowd And Smart Money In Stocks The momo crowd is buying stocks in the early trade. Smart money is inactive in the early trade.
Gold The momo crowd is buying gold in the early trade. Smart money is buying gold in the early trade.
For longer-term, please see gold and silver ratings.
The most popular ETF for gold is SPDR Gold Trust (ARCA:GLD). The most popular ETF for silver is iShares Silver Trust (ARCA:SLV).
Oil The momo crowd is buying oil in the early trade. Smart money is inactive in the early trade.
For longer-term, please see oil ratings.
The most popular ETF for oil is United States Oil ETF (ARCA:USO).
BitcoinBitcoin (CRYPTO: BTC) is range bound.
Protection Band And What To Do Now It is important for investors to look ahead and not in the rearview mirror.
Consider continuing to hold good, very long term, existing positions. Based on individual risk preference, consider a protection band consisting of cash or Treasury bills or short-term tactical trades as well as short to medium term hedges and short term hedges. This is a good way to protect yourself and participate in the upside at the same time.
You can determine your protection bands by adding cash to hedges. The high band of the protection is appropriate for those who are older or conservative. The low band of the protection is appropriate for those who are younger or aggressive. If you do not hedge, the total cash level should be more than stated above but significantly less than cash plus hedges.
It is worth reminding that you cannot take advantage of new upcoming opportunities if you are not holding enough cash. When adjusting hedge levels, consider adjusting partial stop quantities for stock positions (non ETF); consider using wider stops on remaining quantities and also allowing more room for high beta stocks. High beta stocks are the ones that move more than the market.
Traditional 60/40 Portfolio Probability based risk reward adjusted for inflation does not favor long duration strategic bond allocation at this time.
Those who want to stick to traditional 60% allocation to stocks and 40% to bonds may consider focusing on only high quality bonds and bonds of seven year duration or less. Those willing to bring sophistication to their investing may consider using bond ETFs as tactical positions and not strategic positions at this time.
The Arora Report is known for its accurate calls. The Arora Report correctly called the big artificial intelligence rally before anyone else, the new bull market of 2023, the bear market of 2022, new stock market highs right after the virus low in 2020, the virus drop in 2020, the DJIA rally to 30,000 when it was trading at 16,000, the start of a mega bull market in 2009, and the financial crash of 2008. Please click here to sign up for a free forever Generate Wealth Newsletter.
This article is from an unpaid external contributor. It does not represent Benzinga's reporting and has not been edited for content or accuracy.
© 2024 Benzinga.com. Benzinga does not provide investment advice. All rights reserved.