Benzinga - by The Arora Report, Benzinga Contributor.
To gain an edge, this is what you need to know today.
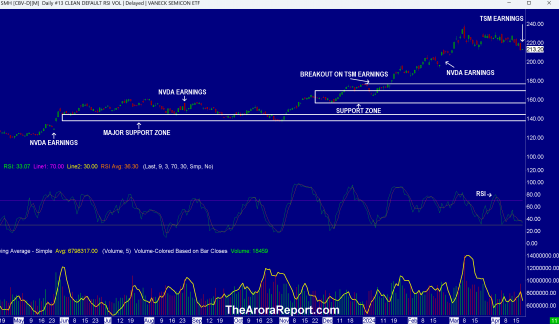
Insatiable Demand For AI Chips Please click here for an enlarged chart of VanEck Semiconductor ETF (NASDAQ: SMH).
Note the following:
- This is an important chart for three reasons.
- Semiconductors are the epicenter of the AI revolution.
- Semiconductors are the leading sector in the stock market.
- Semiconductors often provide an early indication of upcoming stock market moves.
- The chart shows a broadening top formation. This is a negative.
- The chart shows a big drop in semiconductors yesterday after ASML Holding NV (NASDAQ: ASML) earnings. Please see yesterday’s article for details.
- Taiwan Semiconductor Mfg. Co. Ltd. (NYSE: TSM) reported earnings better than consensus and whisper numbers. Earnings from TSM are important because TSM is the biggest independent semiconductor foundry and manufactures chips for NVIDIA Corp (NASDAQ: NVDA), Advanced Micro Devices, Inc. (NASDAQ: AMD), and Apple Inc (NASDAQ: AAPL). As full disclosure, AAPL and NVDA are in The Arora Report's ZYX Buy Model Portfolio.
- The chart shows that last time when TSM reported earnings, semiconductors broke out.
- This time, immediately upon the release of TSM earnings, there was a buying spike, but the buying faded, and the reaction is now muted, as shown on the chart.
- TSM expects about 20% of its revenue from AI chips by 2028 and about 10% of its revenue this year to be from AI.
- Of importance is that TSM says that it plans to maintain its capital expenditure of $28B - $32B this year.
- This is an important data point because after ASML earnings yesterday, many analysts were projecting a drop in capital expenditure on semiconductor manufacturing equipment.
- The new data point is that TSM CEO C.C. Wei said that there is an insatiable AI related demand for energy efficient computing power. To some investors, the data from ASML earnings and TSM earnings is contradictory. Prudent investors know that the stock market always has crosscurrents with contradictory data points. Prudent investors pay attention to the data points that support their position and even more attention to the data points that go against their position. In contrast, the momo crowd exaggerates data points that support their position and ignores the data points that go against their position.
- The broadening top pattern runs counter to insatiable demand. This again shows crosscurrents. The protection band takes into account hundreds of crosscurrents.
- Loretta Mester, Cleveland Fed President, is saying that the Fed should not be in a hurry to cut rates.
- There is significant Fed speak ahead. The Fed’s John Williams, Michelle Bowman, Susan Collins, and Raphael Bostic are speaking.
- Initial jobless claims came at 212K vs. 215K consensus. This indicates that the employment picture is strong. Initial jobless claims is a leading indicator and carries heavy weight in The Arora Report adaptive ZYX Asset Allocation Model with inputs in ten categories. In plain English, adaptiveness means that the model changes itself with market conditions. Please click here to see how this is achieved. One of the reasons behind The Arora Report’s unrivaled performance in both bull and bear markets is the adaptiveness of the model. Most models on Wall Street are static. They work for a while and then stop working when market conditions change.
- Yesterday, smart money sold into the strength generated by momo crowd buying. This morning, the momo crowd is aggressively buying the dip. It is yet to be seen how smart money reacts.
- Of important note is that money continues to flow out of AAPL.
In the early trade, money flows are neutral in Alphabet Inc Class C (NASDAQ: GOOG) and Microsoft Corp (NASDAQ: MSFT).
In the early trade, money flows are negative in Apple (AAPL) and Tesla Inc (NASDAQ: TSLA).
In the early trade, money flows are mixed in SPDR S&P 500 ETF Trust (ARCA:SPY) and Invesco QQQ Trust Series 1 (NASDAQ: QQQ).
Momo Crowd And Smart Money In Stocks The momo crowd is aggressively buying stocks in the early trade. Smart money is inactive in the early trade.
Gold The momo crowd is buying gold in the early trade. Smart money is inactive in the early trade.
For longer-term, please see gold and silver ratings.
Oil Oil was hit hard yesterday after EIA data showed that inventories were building.
The momo crowd is like a yoyo in oil in the early trade. Smart money is inactive in the early trade.
For longer-term, please see oil ratings.
BitcoinBitcoin (CRYPTO: BTC) is trading around $62,000 as of this writing. Many recent retail investors, who were lulled into buying above $70,000 on pitches about bitcoin halving from bitcoin whales’ propaganda machine, seem disappointed.
Protection Band And What To Do Now It is important for investors to look ahead and not in the rearview mirror.
Based on individual risk preference, consider a protection band consisting of cash or Treasury bills or short-term tactical trades as well as short to medium term hedges and short term hedges. This is a good way to protect yourself and participate in the upside at the same time.
You can determine your protection bands by adding cash to hedges. The high band of the protection is appropriate for those who are older or conservative. The low band of the protection is appropriate for those who are younger or aggressive. If you do not hedge, the total cash level should be more than stated above but significantly less than cash plus hedges.
It is worth reminding that you cannot take advantage of new upcoming opportunities if you are not holding enough cash. When adjusting hedge levels, consider adjusting partial stop quantities for stock positions (non ETF); consider using wider stops on remaining quantities and also allowing more room for high beta stocks. High beta stocks are the ones that move more than the market.
Traditional 60/40 Portfolio Probability based risk reward adjusted for inflation does not favor long duration strategic bond allocation at this time.
Those who want to stick to traditional 60% allocation to stocks and 40% to bonds may consider focusing on only high quality bonds and bonds of seven year duration or less. Those willing to bring sophistication to their investing may consider using bond ETFs as tactical positions and not strategic positions at this time.
The Arora Report is known for its accurate calls. The Arora Report correctly called the big artificial intelligence rally before anyone else, the new bull market of 2023, the bear market of 2022, new stock market highs right after the virus low in 2020, the virus drop in 2020, the DJIA rally to 30,000 when it was trading at 16,000, the start of a mega bull market in 2009, and the financial crash of 2008. Please click here to sign up for a free forever Generate Wealth Newsletter.
This article is from an unpaid external contributor. It does not represent Benzinga's reporting and has not been edited for content or accuracy.
© 2024 Benzinga.com. Benzinga does not provide investment advice. All rights reserved.