Benzinga - by Zacks, Benzinga Contributor.
Exxon Mobil Corporation (NYSE: XOM) reported first-quarter 2024 earnings per share of $2.06 (excluding identified items), which missed the Zacks Consensus Estimate of $2.19. The bottom line also declined from the year-ago level of $2.83.
Total quarterly revenues of $83,083 million missed the Zacks Consensus Estimate of $86,599 million. The top line also deteriorated from the year-ago quarter's figure of $86,564 million.
Weak quarterly results primarily resulted from lower realizations of natural gas prices and decreased total production.
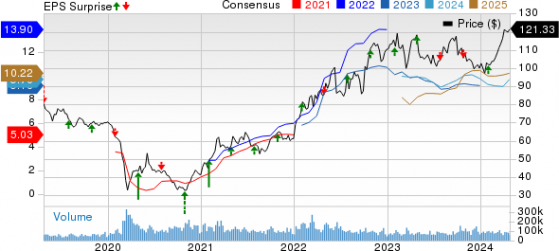
Exxon Mobil Corporation Price, Consensus and EPS Surprise
Exxon Mobil Corporation price-consensus-eps-surprise-chart | Exxon Mobil Corporation Quote
Operational Performance Upstream The segment reported quarterly earnings (excluding identified items) of $5,660 million, down from $6,615 million reported in the year-ago quarter. This was mainly due to a 32% decrease in natural gas prices and other non-cash impacts from tax and inventory adjustments, as well as divestments.
Operations in the United States recorded a profit of $1,054 million, down from $1,632 million registered in the March-end quarter of 2023. The company reported a profit of $4,606 million from non-U.S. operations, down from $4,983 million reported in the year-ago quarter.
Production: ExxonMobil's production averaged 3,784 thousand barrels of oil equivalent per day (MBoe/d), lower than 3,831 MBoe/d reported a year ago. The figure also missed our estimate of 3,807.6 MBoe/d.
However, Liquids production increased to 2,557 thousand barrels per day (MBbls/d) from 2,495 MBbls/d in the prior-year quarter. The outperformance resulted from higher production, primarily in Canada and Africa. Yet, natural gas production totaled 7,362 million cubic feet per day (Mmcf/d), down from 8,016 Mmcf/d reported a year ago. This was primarily due to lower output from the United States, Europe, Asia and Australia.
Price Realization: In the United States, ExxonMobil recorded crude price realization of $74.96 per barrel, higher than the year-ago quarter's figure of $73.95. The figure, however, missed our estimate of $75.27. Crude price realization for non-U.S. operations increased to $72.00 per barrel from $67.93 in the year-ago quarter. Our estimate for the same was pinned at $72.08 per barrel.
Natural gas price in the United States was $2.22 per thousand cubic feet (Mcf), lower than the year-ago quarter's level of $3.20. Our estimate for the same was pegged at $2.06 per Mcf. Also, in the non-U.S. section, the metric declined to $11.37 per Mcf from $17.39. The figure also missed our estimate of $13.44 per Mcf.
Energy Products The segment recorded a profit (excluding identified items) of $1,376 million, down from $4,213 million recorded a year ago. The reported figure also lagged our estimate of $2,931.3 million. This was primarily due to lower industry refining margins and unfavorable timing effects from derivatives mark-to-market impacts.
Chemical Products This unit of ExxonMobil recorded a profit of $785 million (excluding identified items), up from $371 million registered in the year-ago quarter. The reported figure also beat our estimate of $505.2 million. Margins improved as a result of reduced U.S. feed costs and strong performance product sales, aiding the business unit.
Specialty Products This ExxonMobil unit recorded a profit of $761 million (excluding identified items), down from $774 million in the year-ago quarter. Our projection for the same was pegged at $714 million. Higher margins from improved finished lubes and structural cost savings aided the business unit, partially offset by weaker base stock margins and higher base expenses.
Financials In the quarter under review, ExxonMobil generated a cash flow of $15,367 million from operations and asset divestments. The company's capital and exploration spending amounted to $5,839 million.
At the end of the first quarter of 2024, ExxonMobil's total cash and cash equivalents were $33,320 million, and long-term debt totaled $32,213 million.
Zacks Rank & Stocks to Consider ExxonMobil currently carries a Zacks Rank #3 (Hold).
Investors interested in the energy sector may look at some better-ranked stocks like SM Energy Company (NYSE: SM), EOG Resources Inc., (NYSE: EOG) and PBF Energy Inc. (NYSE: PBF). While SM Energy sports a Zacks Rank #1 (Strong Buy), EOG Resources and PBF Energy carry a Zacks Rank #2 (Buy) each at present.
SM Energy Company is an independent oil and gas company, engaged in the exploration, exploitation, development, acquisition, and production of oil and gas in North America. SM currently has a Value Score of B.
The Zacks Consensus Estimate for SM's 2024 and 2025 EPS is pegged at $6.33 and $6.96, respectively. The stock has witnessed upward earnings estimate revisions for 2024 and 2025 in the past seven days.
EOG Resources, an oil and gas exploration company, boasts attractive growth prospects, top-tier returns, and a disciplined management team, leveraging highly productive acreages in prime oil shale plays like the Permian and Eagle Ford.
The Zacks Consensus Estimate for EOG's 2024 EPS is pegged at $12.29. The company has a Zacks Style Score of B for Value and A for Momentum. It has witnessed upward earnings estimate revisions for 2024 and 2025 in the past seven days.
PBF Energy operates with a diverse asset base of six refineries, boasting higher daily crude processing capacity and a complex refining system, enabling the production of superior-grade refined products.
The Zacks Consensus Estimate for PBF's 2024 and 2025 EPS is pegged at $7.39 and $5.87, respectively. PBF currently has a Zacks Style Score of A for Value and A for Momentum. Over the past seven days, PBF has witnessed upward earnings estimate revisions for 2024 and 2025.
To read this article on Zacks.com click here.