Benzinga - To gain an edge, this is what you need to know today.
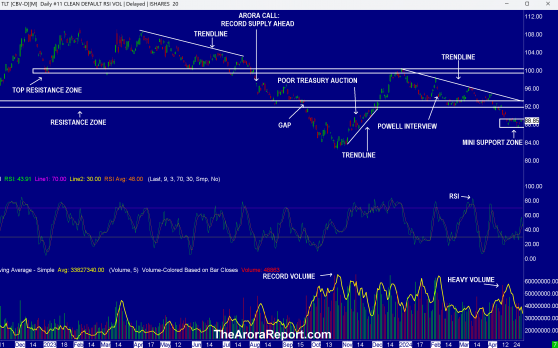
Samsung Overtakes Apple Please click here for an enlarged chart of 20+ year iShares 20+ Year Treasury Bond ETF (NASDAQ: TLT).
Note the following:
- The chart shows that bonds have fallen this year.
- The chart shows that bonds are consolidating in the mini support zone.
- Lower bonds mean higher yields. Higher yields mean lower PE ratios. Lower PE ratios mean lower stock prices, unless earnings rise.
- So far, due to a strong economy because of the Fed’s second blunder and reckless spending by the government, earnings are better than expected. 45% of S&P 500 companies have reported earnings. About 77% are above consensus. This is helping the stock market to levitate. We have previously described the Fed’s second blunder. The Fed’s second blunder has a major impact on your investments.
- Just released data shows more bad news on inflation. Employment Cost Index came at 1.2% vs. 1.0% consensus.
- The FOMC meeting starts today. FOMC will announce its decision at 2pm ET tomorrow followed by Powell’s press conference at 2:30am ET.
- The AI phone from Samsung Electronics Co Ltd (OTC: SSNLF) is proving popular. Apple Inc (NASDAQ: AAPL) has lagged behind in AI. Institutions continue to sell AAPL stock. According to a just released report, Samsung has now taken over Apple as the largest provider of smart phones.
- There are three notable earnings that investors should pay attention to:
- Samsung has quadrupled its net profit due to demand from artificial intelligence. Its high bandwidth memory is flying off the shelves. Revenues for the quarter rose 13%.
- Pharmaceutical giant Eli Lilly And Co (NYSE: LLY) reported earnings better than the consensus and whisper numbers. Lilly is also raising its FY24 EPS projection to $13.50 - $14.00 from $12.20 - $12.70. Lilly’s performance is due to strong sales of weight loss drugs Mounjaro and Zepbound. LLY stock is up about 6% as of this writing in the premarket. As full disclosure, LLY stock is in The Arora Report’s ZYX Buy Model Portfolio. Members of The Arora Report now have a gain of 145% on LLY stock.
- NXP Semiconductors NV (NASDAQ: NXPI), a leader in automotive semiconductors, reported earnings better than the consensus and whisper numbers. As full disclosure, NXPI is in The Arora Report's ZYX Buy Model Portfolio. NXPI is trading up over 4% as of this writing in the premarket.
- There will be another indication of demand for artificial intelligence after the market close when three important companies for AI report earnings – Advanced Micro Devices, Inc. (NASDAQ: AMD), Amazon.com, Inc. (NASDAQ: AMZN), and Super Micro Computer Inc (NASDAQ: SMCI).
Europe The Eurozone economy has avoided a recession and is resilient. Q1 GDP came at 0.3% quarter-over-quarter vs. 0.1% consensus.
There is selling in European stocks because of the strong GDP data weighing on rate cut expectations.
Magnificent Seven Money Flows In the early trade, money flows are positive in AMZN.
In the early trade, money flows are neutral in AAPL and Alphabet Inc Class C (NASDAQ: GOOG).
In the early trade, money flows are negative in Meta Platforms Inc (NASDAQ: META), Microsoft Corp (NASDAQ: MSFT), NVIDIA Corp (NASDAQ: NVDA), and Tesla Inc (NASDAQ: TSLA).
In the early trade, money flows are negative in SPDR S&P 500 ETF Trust (ARCA:SPY) and Invesco QQQ Trust Series 1 (NASDAQ: QQQ).
Momo Crowd And Smart Money In Stocks The momo crowd is buying stocks in the early trade. Smart money is inactive in the early trade.
Gold The momo crowd is selling gold in the early trade. Smart money is inactive in the early trade.
For longer-term, please see gold and silver ratings.
The most popular ETF for gold is SPDR Gold Trust (ARCA:GLD). The most popular ETF for silver is iShares Silver Trust (ARCA:SLV).
Oil The momo crowd is buying oil in the early trade. Smart money is inactive in the early trade.
For longer-term, please see oil ratings.
The most popular ETF for oil is United States Oil ETF (ARCA:USO).
Bitcoin Bitcoin (CRYPTO: BTC) is trading around $61,000. $60,000 is a key psychological support level. Whales will likely try to hold bitcoin above $60,000. However, the momo crowd that bought bitcoin at $70,000 on hopes of bitcoin going to $100,000 after bitcoin halving is likely to panic and sell.
Protection Band And What To Do Now It is important for investors to look ahead and not in the rearview mirror.
Consider continuing to hold good, very long term, existing positions. Based on individual risk preference, consider a protection band consisting of cash or Treasury bills or short-term tactical trades as well as short to medium term hedges and short term hedges. This is a good way to protect yourself and participate in the upside at the same time.
You can determine your protection bands by adding cash to hedges. The high band of the protection is appropriate for those who are older or conservative. The low band of the protection is appropriate for those who are younger or aggressive. If you do not hedge, the total cash level should be more than stated above but significantly less than cash plus hedges.
It is worth reminding that you cannot take advantage of new upcoming opportunities if you are not holding enough cash. When adjusting hedge levels, consider adjusting partial stop quantities for stock positions (non ETF); consider using wider stops on remaining quantities and also allowing more room for high beta stocks. High beta stocks are the ones that move more than the market.
Traditional 60/40 Portfolio Probability based risk reward adjusted for inflation does not favor long duration strategic bond allocation at this time.
Those who want to stick to traditional 60% allocation to stocks and 40% to bonds may consider focusing on only high quality bonds and bonds of seven year duration or less. Those willing to bring sophistication to their investing may consider using bond ETFs as tactical positions and not strategic positions at this time.
The Arora Report is known for its accurate calls. The Arora Report correctly called the big artificial intelligence rally before anyone else, the new bull market of 2023, the bear market of 2022, new stock market highs right after the virus low in 2020, the virus drop in 2020, the DJIA rally to 30,000 when it was trading at 16,000, the start of a mega bull market in 2009, and the financial crash of 2008. Please click here to sign up for a free forever Generate Wealth Newsletter.
This article is from an unpaid external contributor. It does not represent Benzinga's reporting and has not been edited for content or accuracy.
© 2024 Benzinga.com. Benzinga does not provide investment advice. All rights reserved.