Market Overview
News flow on the US/China trade dispute remains key for market sentiment. After weeks of being drip fed positive snippets on the US/China move to signing “Phase One” of an agreement on trade, the caveats are beginning to take hold. Logistically, Chile no longer able to host the APEC summit has not helped. This was supposed to be a common meeting point where an agreement could have been signed in mid-November. However, civil unrest and protests have forced a cancellation of the event. Although President Trump has suggested an alternative will be arranged, it has added to a growing sense of uncertainty. China has also suggested that agreement on a range of issues will be difficult. We have subsequently seen a strong move back into lower risk assets.
Flow back into Treasuries (with yields sharply lower), gold, the yen and Swiss franc have resulted. Equities suffered some profit taking of recent gains too. Reading into the Fed’s intentions on monetary policy have also hit the dollar which is a key underperforming currency.
There has been a slightly more risk positive move today after better than expected PMI data out of China overnight, but payrolls Friday tends to be overtaken by consolidation in front of the data. However, the Non-farm Payrolls headline number may well be taken with a pinch of salt as a strike at General Motors (NYSE:GM) is expected to cut around 50,000 jobs off the number. Focus will as ever be on wage growth, especially after Fed chair Powell talked about the need for a really substantial increase in inflation before rate hikes. Wages moving in the opposite direction would not help the dollar.
Wall Street closed lower yesterday with the S&P 500 -0.3% at 3037, but US futures are ticking back higher this morning by +0.2%. This is helping a more mixed look to Asian markets. The Nikkei was -0.3% but the Shanghai Composite was +0.9% after better than expected Caixin Manufacturing PMI. European markets are following US futures higher today, with FTSE futures +02% and DAX futures +0.3%. In forex, there is a continuation of USD negative theme across major pairs, although the moves are slightly muted ahead of the payrolls report later today. In commodities, there is a slight retracement of yesterday’s sharp gains on gold and silver, whilst oil has found an element of support after four negative sessions.
Payrolls dominate the economic calendar today but being the first trading day of the month it is also a day for manufacturing PMIs. The UK Manufacturing PMI for October is at 09:30 GMT is expected to slip further into contraction at 48.1 (down from 48.3 in September).
The US Employment Situation for October is at 12:30 GMT and headline Non-farm Payrolls are expected to be just 89,000 which would be the lowest since May’s 72,00 (136,000 in September). There will also be considerable focus on Average Hourly Earnings which are expected to grow by +0.3% on the month meaning the year on year improves slightly to +3.0% (after being flat in September which pulled the year on year down to +2.9%). The Unemployment rate remains very low and on a declining path, although is expected to see a tick higher to 3.6% (from 3.5% in September). ISM Manufacturing is the other key data point today at 1400GMT with an expected slight pick up to 48.9 (from 47.8 in September).
After such a significant dollar negative reaction to the FOMC meeting on Wednesday, there will also be focus on the Fed speakers today. All voters on the committee, vice chair Richard Clarida (mild dove) is at 1700GMT, whilst Randall Quarles (centrist) is also at 1700GMT. John Williams (NYSE:WMB) (centrist) is at 1830GMT.
Chart of the Day – USD/CHF
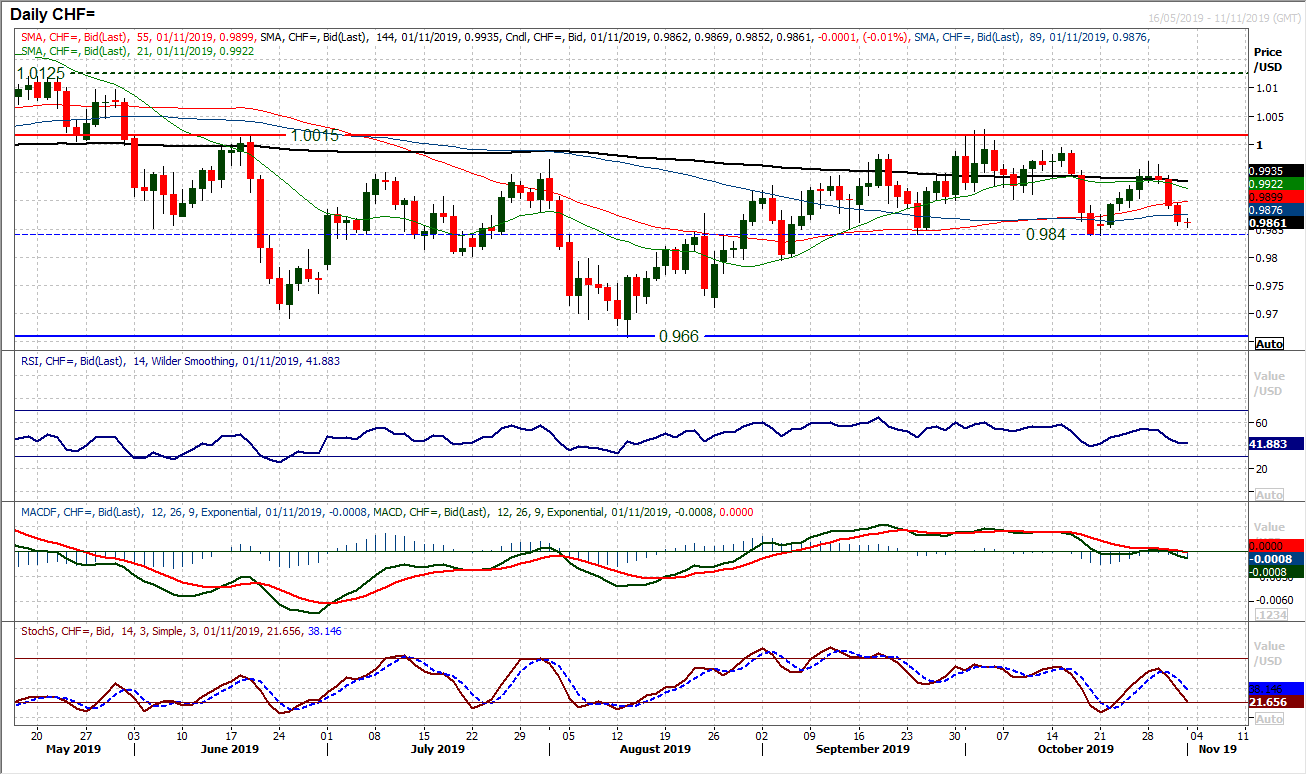
The Swissy bulls have really got the bit between their teeth in the past couple of sessions. This has dragged Dollar/Swiss lower once more within a five month trading range and sees the market ready to test mid-range pivot support at 0.9840. The move is being reflected through a deterioration in momentum indicators which are turning the outlook increasingly corrective now. A “bear kiss” on the MACD lines back under neutral, whilst Stochastics have bear crossed around 60 and are accelerating lower. Watch for the RSI falling below 40 being an indication of a likely downside break below 0.9840. A closing breach of the pivot, confirmed by momentum would be a key break. A two month low would suggest a decisive topping out that would imply a move back towards the 0.9660 lows again in due course. The hourly chart shows corrective momentum configuration and a resistance band initially 0.9890/0.9910. Below 0.9840 initial support is 0.9795.
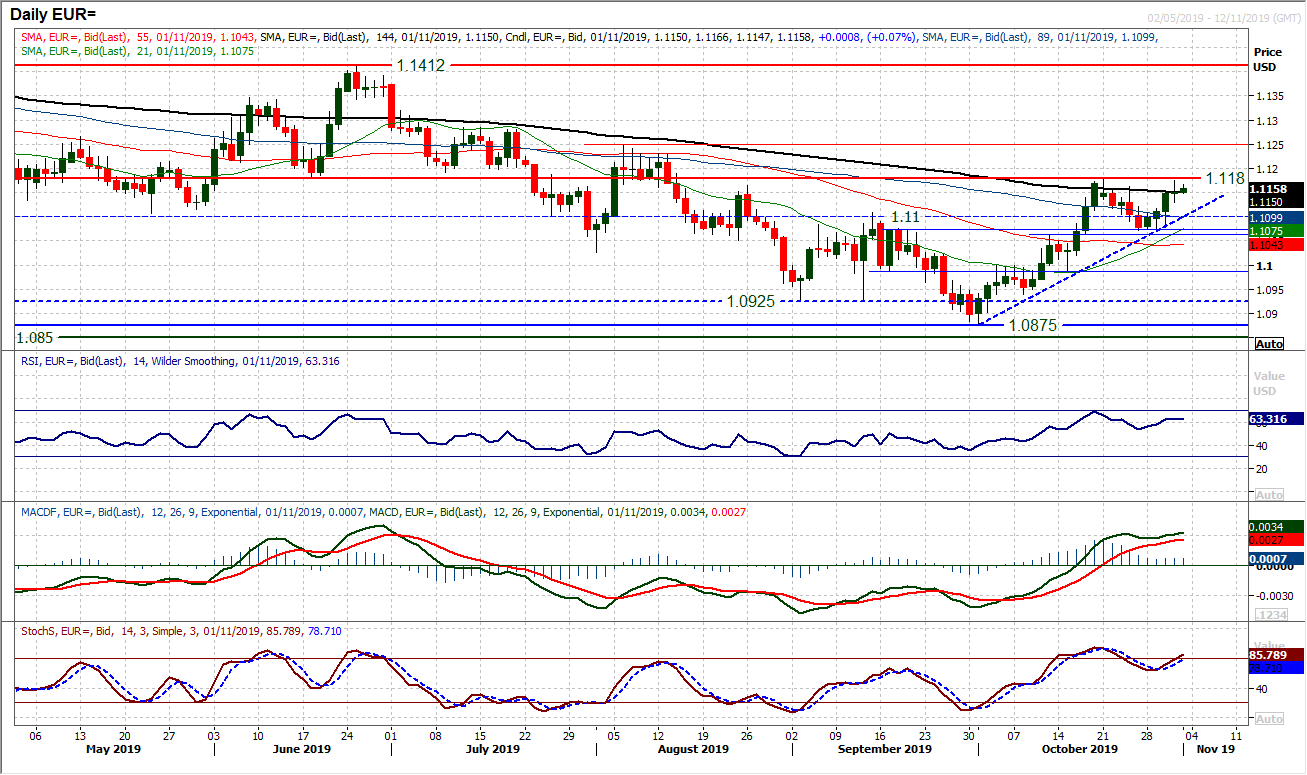
The euro has been steadily building higher throughout this week and the market is now eyeing a test of the key October resistance at $1.1180. There was a little hesitation yesterday as an intraday slip back form the resistance formed an almost doji candlestick (open and close around the same level, denoting uncertainty). However, another drift higher today places the bulls in a good position for payrolls today. Given the only marginal intraday break of the recent four week uptrend, a mild re-alignment leaves the trend sitting at $1.1100 today. This trend is adding weight to the support band $1.1060/$1.1100. With renewed strength on momentum indicators, we see the bulls in control and weakness is a chance to buy. A close above $1.1180 would open the next key reaction high at $1.1250. The hourly chart has positive momentum configuration and initial support $1.1120/$1.1130 today.
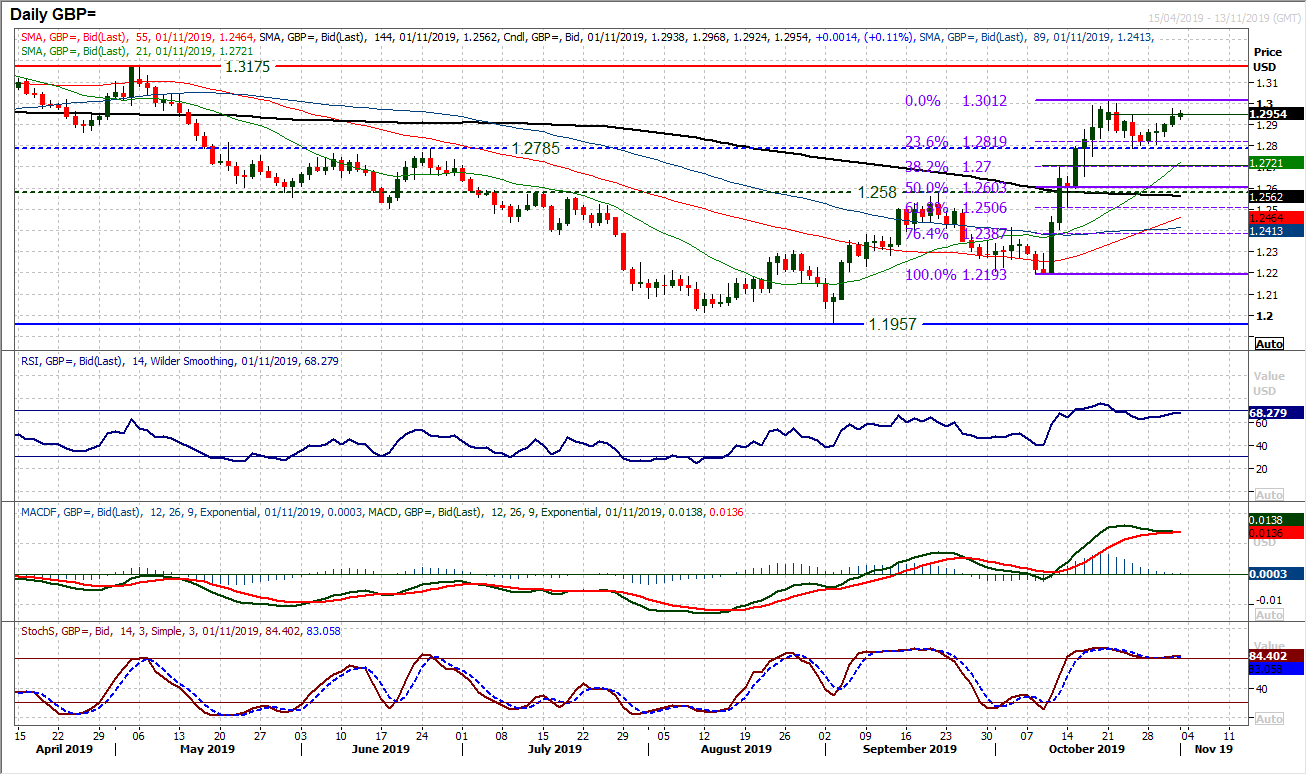
Whilst political uncertainty for sterling over the coming weeks could be something of a drag on Cable, right now, there is a dollar slide and sterling held up by UK political opinion polls pointing to a likely Conservative Government. Cable has edged higher throughout this week. A run of mild positive candles is pulling the market through near term resistance levels and once more within touching distance of the key resistance around $1.3010. It is the volatility reduction of recent days which is notable, as the Average True Range continues to slide (now around 125 pips) as the market looks ever more settled. This is also reflected in momentum indicators which are looking increasingly stable in their positive configurations. It suggests that sterling is unlikely to push sharply higher now and a period of consolidation is more likely. Moving into payrolls today, the dollar remains under pressure and this is ushering Cable higher. Expect some volatility, but we do not expect a trending move to develop.
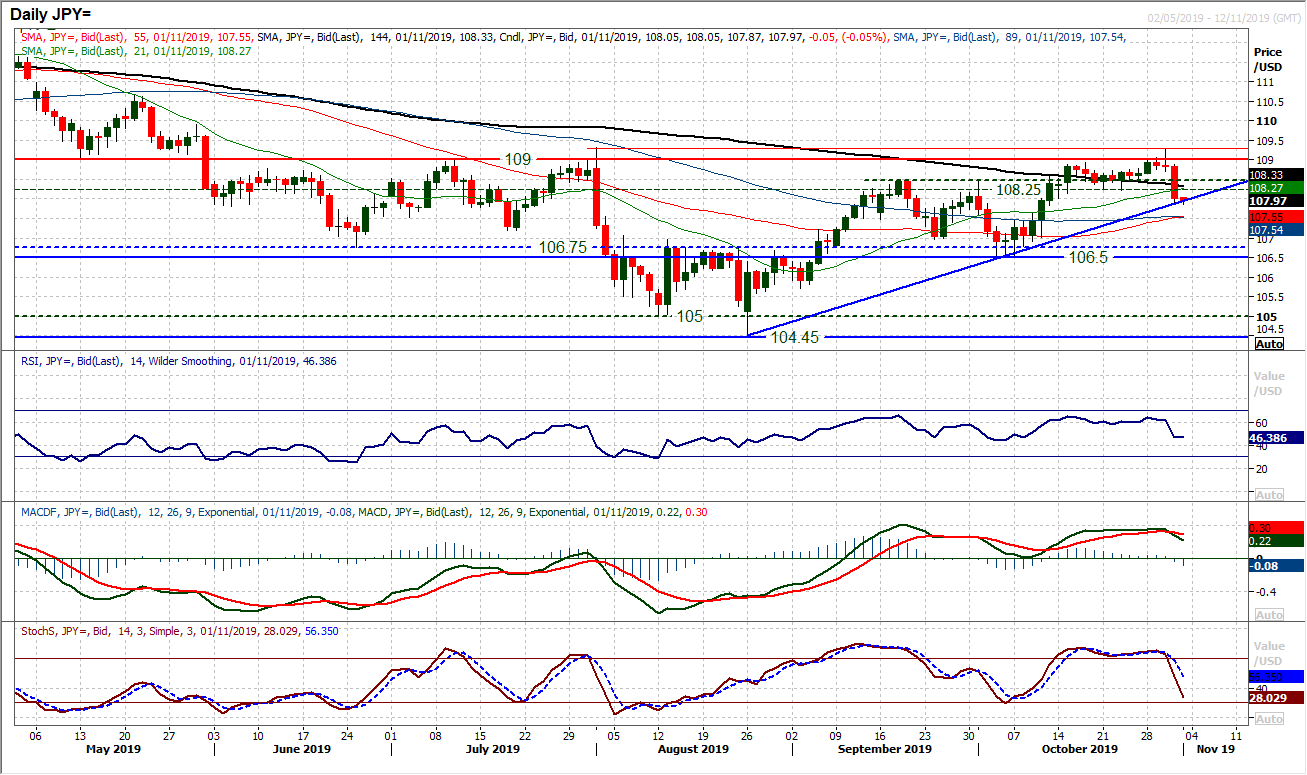
A driving bearish candle has dragged Dollar/Yen back to a three week low on a breach of the 108.25 support. We discussed the potential that the failed breakout above 109.00 could turn into something more bearish in the coming days. There is an old adage in technicals, “there is nothing more bearish than a false upside break”. Being followed by a breakdown of 108.25 implies a further -75 pips towards 107.50. However, given the huge turn lower of early August, the technical implications of a breach of a nine week uptrend (at 107.95) would also be significant and need to be watched. The market is on the brink today as there is little real technical support until 106.50/106.75. Momentum indicators have turned corrective with a bear cross on MACD and Stochastics. If the RSI drops below 40 it would signal a deeper correction in due course too. Resistance is at 108.25/108.50 today but increasingly intraday rallies may struggle now.
Gold
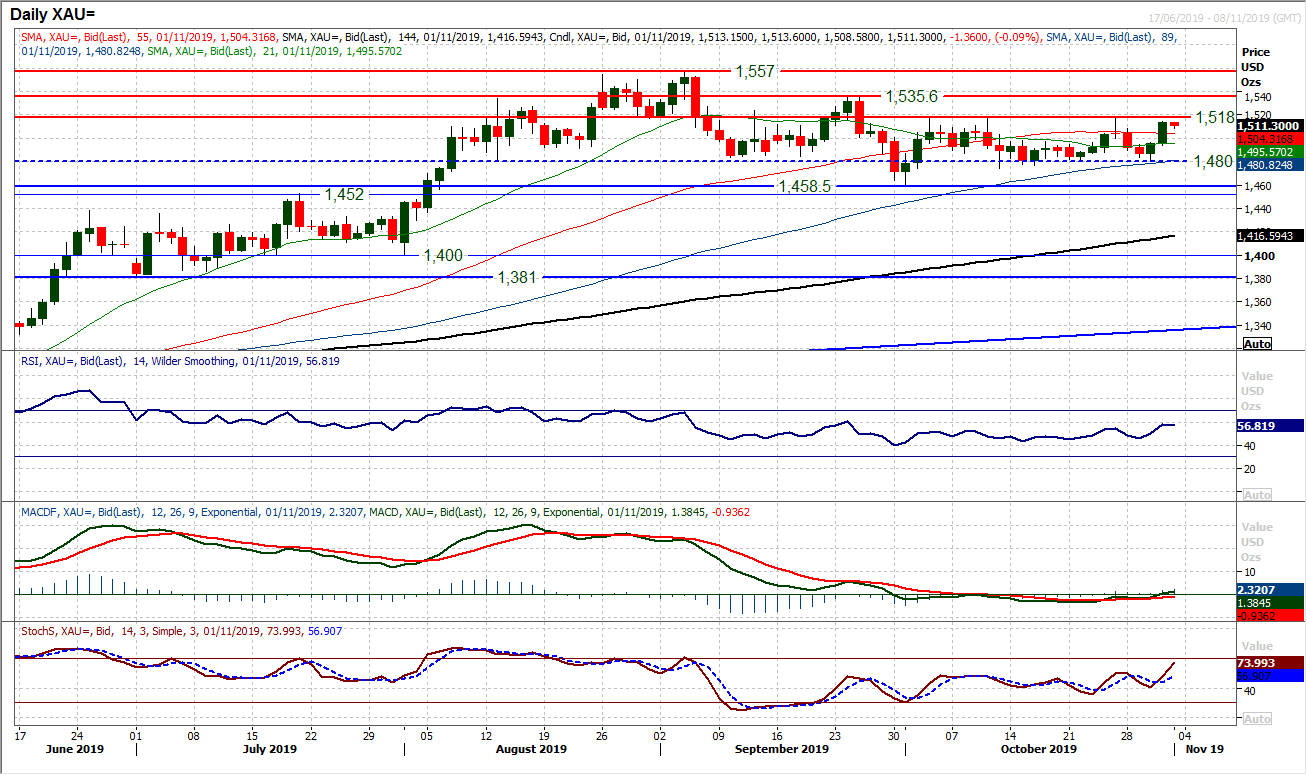
In the past two completed sessions, the gold price has swung from testing the support around $1480 to testing the resistance at $1518. However, the market has fluctuated within this trading band pretty much for the past four weeks, so until there is confirmation, trading ahead of a decisive breakout is likely to prove frustrating. Momentum indicators are ticking higher with the move and admittedly, yesterday’s positive candle was the strongest upside candle of the past four weeks. However, the resistance at $1518 is key and in front of payrolls today, the prospect of a breakout is limited. The hourly chart shows momentum swinging back lower this morning. We continue to take $1500 (a near term pivot and also psychological) as a near term gauge, with a more positive outlook whilst trading above.
WTI Oil
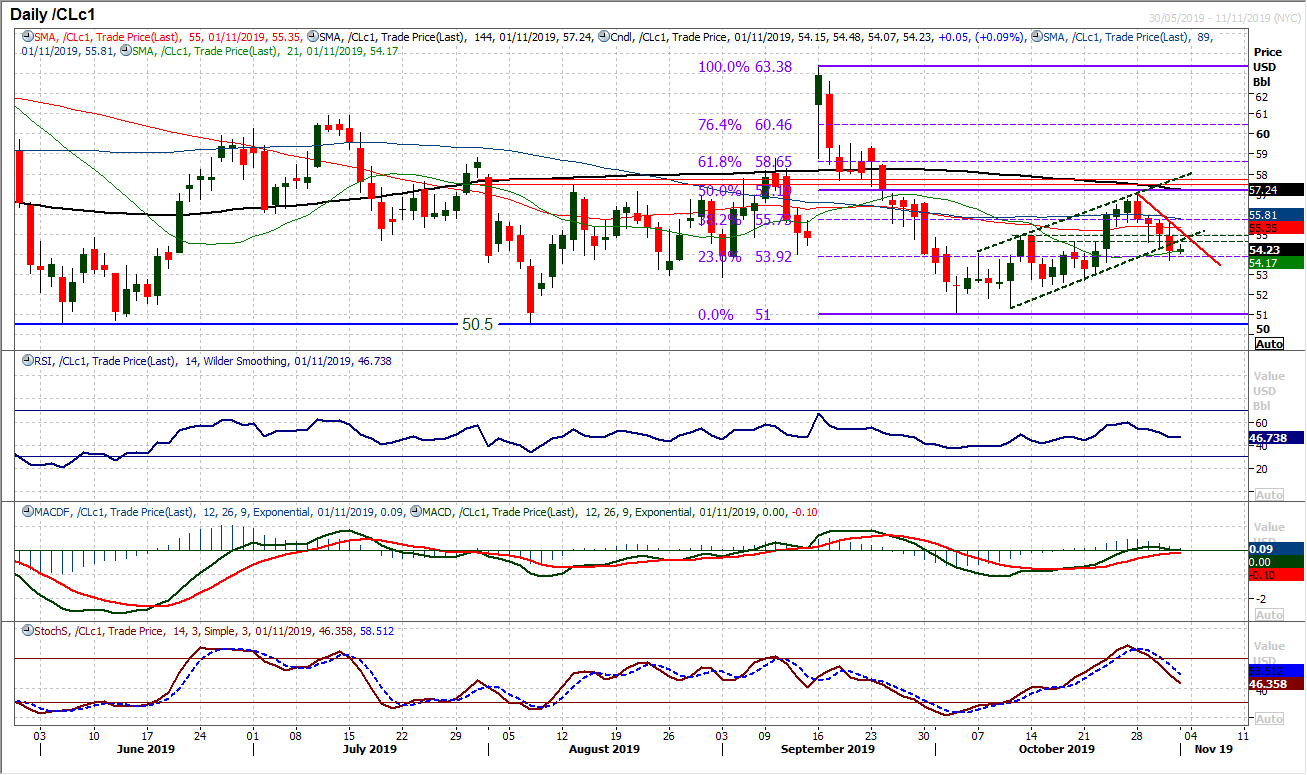
The bulls will be somewhat dismayed by the way they have so meekly handed back control of the market after such an encouraging recovery trend of recent weeks. Yesterday’s bearish candle was the fourth in succession and now confirms that the recovery trend is over. The broken channel uptrend along with sell signals now forming on momentum indicators suggests that the outlook is mixed at best and on the brink of turning negative again. With four sessions where intraday rallies have been sold into, the downside pressure is growing. A move below the 23.6% Fib retracement (of $63.40/$51.00) at $53.90 would complete the deterioration and then would suggest not only pressure on the $52.40/$52.70 support but also the key October low at $51.00. How the bulls respond to what is now resistance between $54.60/$54.90 will be key, whilst yesterday’s lower high at $55.60 needs to be broken to suggest any sort of recovery renewal.
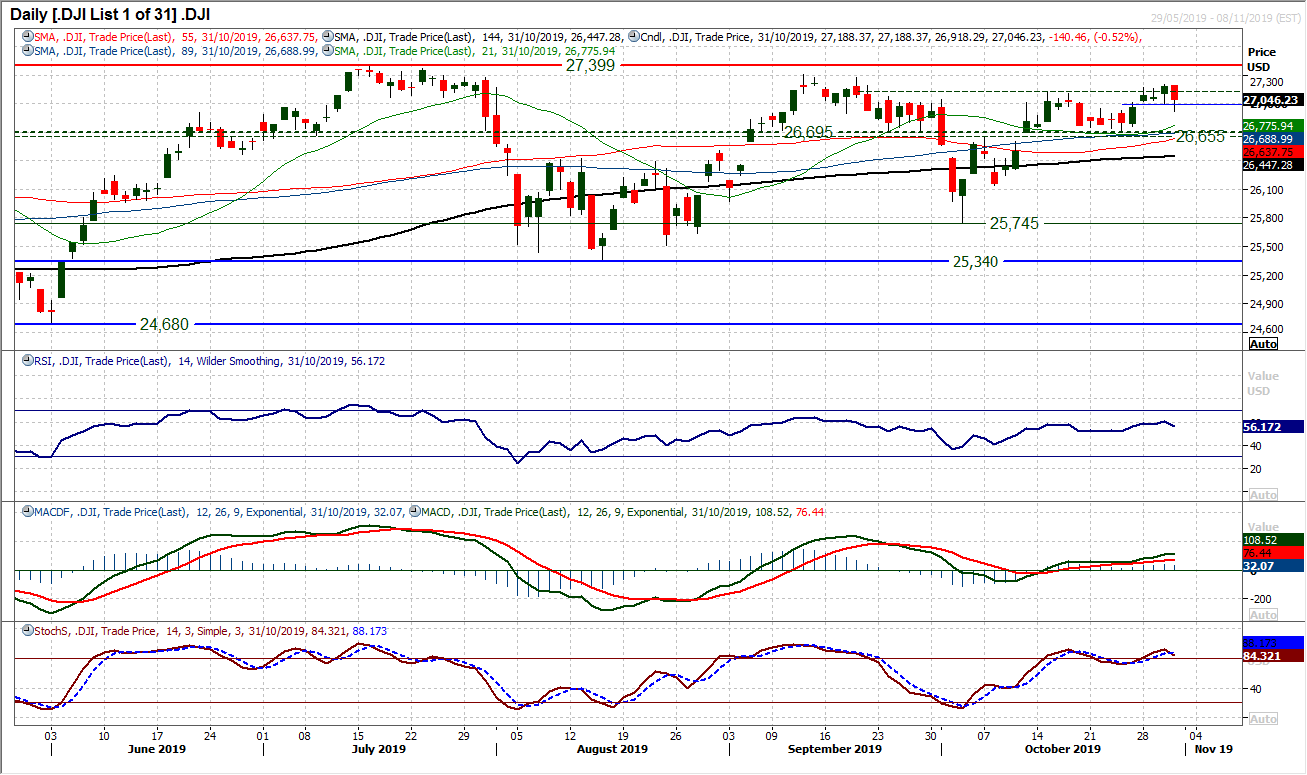
Just when it looked as though the Dow was finding positive traction, a reversal candle has muddied the waters again. Turning back to leave resistance at 27,205, a retreat back into the old area of congestion poses a few questions for the bulls. Taking a step back from some of the noise, the important factor remains the pivot support band 26,655/26,695. This increasingly important near to medium term support needs to hold firm and we believe will do so. There is a positive momentum configuration, whilst moving averages are beginning to turn up. This suggests that weakness is a chance to buy, so yesterday’s corrective slip should be eyed as an opportunity. There is support now 26,920/27,000 which is an immediate support area to work from, but we expect near term downside to continue to be seen as a buying opportunity.
"""DISCLAIMER: This report does not constitute personal investment advice, nor does it take into account the individual financial circumstances or objectives of the clients who receive it. All information and research produced by Hantec Markets is intended to be general in nature; it does not constitute a recommendation or offer for the purchase or sale of any financial instrument, nor should it be construed as such.
All of the views or suggestions within this report are those solely and exclusively of the author, and accurately reflect his personal views about any and all of the subject instruments and are presented to the best of the author’s knowledge. Any person relying on this report to undertake trading does so entirely at his/her own risk and Hantec Markets does not accept any liability. """
