Market Overview
With the US taking a day off yesterday, suddenly the glass has gone from being half full to being half empty this morning. Looking around, the dark clouds have gathered and trading outlook has taken on an increased edge of risk aversion. Ratings agency Moody’s has cut the outlook for Hong Kong, whilst the IMF has cut its forecast for global economic growth which it sees as remaining “sluggish”. Add in the coronavirus that is spreading through China that is being talked of in the same breath as the SARS outbreak of 2002 and we have a risk outlook in retreat this morning.
This is driving bond yields lower (US 10-Year yield off almost -5 basis points from Friday’s close), whilst the starkest move to reflect risk aversion has been a sharp move higher on the Dollar/Yuan rate above 6.9000 again. Add in a stronger yen, a mini breakout on gold and equities dropping back and there is pretty much the full set. Quite how far traders take this is another matter though. Reaction to the Moody’s downgrade and IMF forecast is more likely to be knee jerk and short term. This seems to be a fly in the ointment rather than a broader malaise setting in this morning.
The potential fallout for China of the coronavirus though is as yet unknown. Back in Europe, eyes on the German ZEW this morning for the outlook of the Eurozone’s major economy.
Wall Street was shut for Martin Luther King Day yesterday but futures have resumed around -0.4% lower today. This has dragged Asian markets lower, with Nikkei -0.9% and Shanghai Composite -1.4%. In Europe, the reaction is equally negative, following US futures, with FTSE futures -0.4% and DAX futures -0.6%.
In forex, the main mover is JPY recovering lower ground, with the commodity currencies (AUD, NZD and CAD) underperforming by around -0.2%.
In commodities, gold looked to be breaking higher, but is just paring those earlier gains, whilst oil is approaching -1.0% lower.
There is a European focus to the announcements on the economic calendar today. The UK Unemployment numbers for November are out at 09;30 GMT and are expected to show the headline rate sticking again at 3.8% (3.8% in October). UK Average Weekly Earnings are expected to slip slightly to +3.1% (from +3.2% in October).
The German ZEW Economic Sentiment for January is at 10:00 GMT and is expected to show an improvement to +15.0 (from +10.7 in December), which would be the highest since March 2018. Furthermore, the whilst the German ZEW Current Conditions component is expected to improve to -13.5 (from -19.9 in December) which would be a third consecutive month of improvement and the first time this has happened since the end of 2017.
Chart of the Day – GBP/AUD
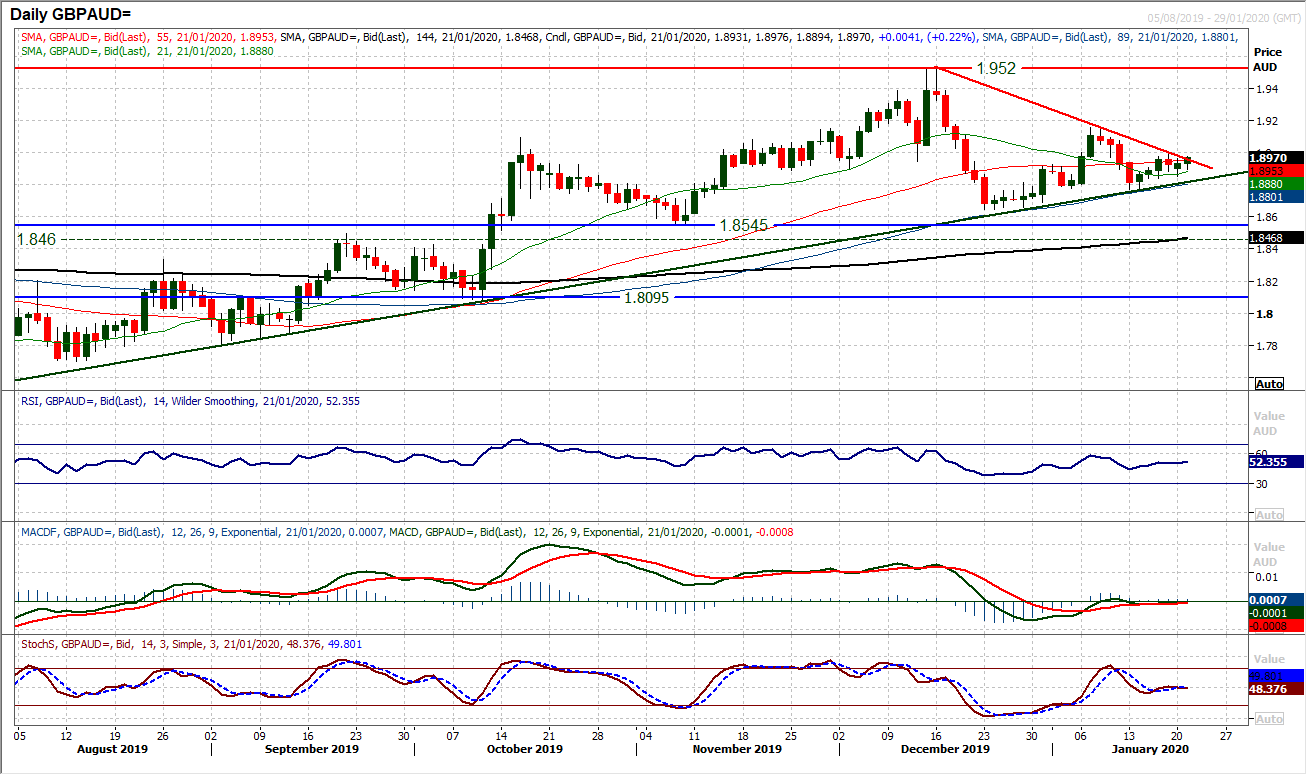
The latest drop back to $1.2900/$1.3000 on Cable has sterling bulls having their control questioned. However, that is not the only sterling cross which is at a key crossroads as Sterling/Aussie has also been at a key level in recent sessions. For the past six months, sterling has been building a very well-defined uptrend, which has been used on several occasions as a basis of support. In recent weeks, this trendline has again come back in as support for sterling weakness. However, now as a five week downtrend converges, this is a key moment. This is a key crossroads for GBP/AUD. Momentum indicators are taking on a more neutral configuration though which reflects the crossroads. The RSI has been around 40/60 over the past few weeks whilst MACD and Stochastics lines have moderated around neutral. The six month uptrend and 89 day moving average both sit around 1.8815 today and are supportive. The candlesticks have been slightly more positive in aggregate in the past week meaning that support at 1.8765 is initially key. A move above 1.9000 (last week’s rebound high) would suggest the bulls winning the battle (especially on a closing basis).
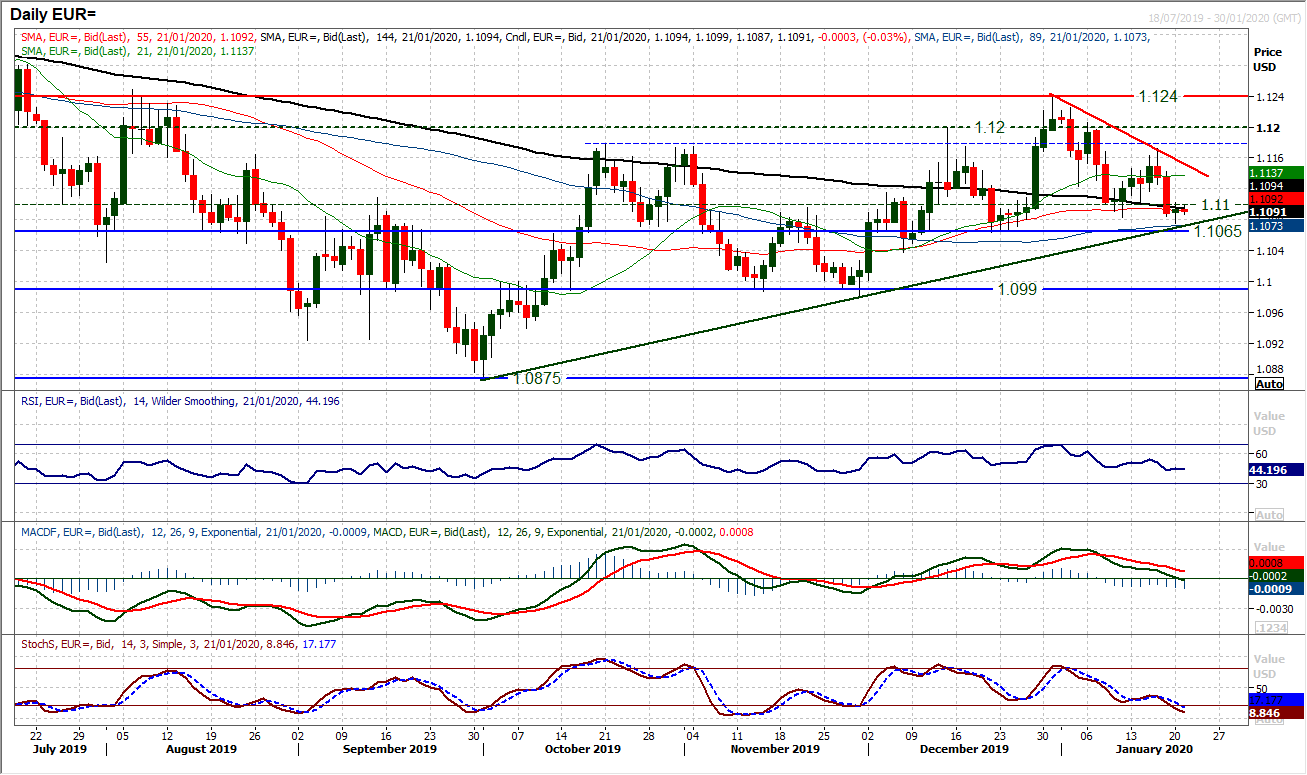
The euro has been pressured in the past couple of sessions. Breaking below $1.1100 and the early January support of $1.1085 is asking serious questions of the medium term bull control. The three and a half month uptrend rises at $1.1075 today and it adds even greater importance to the support of the latest key higher low at $1.1065. A breach of $1.1065 on a closing basis would be a significant breakdown of the positive outlook. The selling pressure in recent weeks has left a series of lower highs and lower lows as a three week downtrend drops back to meet the three and a half month uptrend. The fact that the RSI is hovering around the 40/45 mark, with MACD lines dropping back to neutral, shows that this is a key inflection point. Having steadied the decline yesterday (admittedly on a low volume US public holiday), once more EUR/USD is around $1.1100. However, it is becoming apparent that until the three week downtrend is breached (today around $1.1150) then this negative near term move will dominate. RSI below 40 and MACD lines below neutral would hint at a potential downside break of $1.1065. For now though the medium term uptrend is holding.
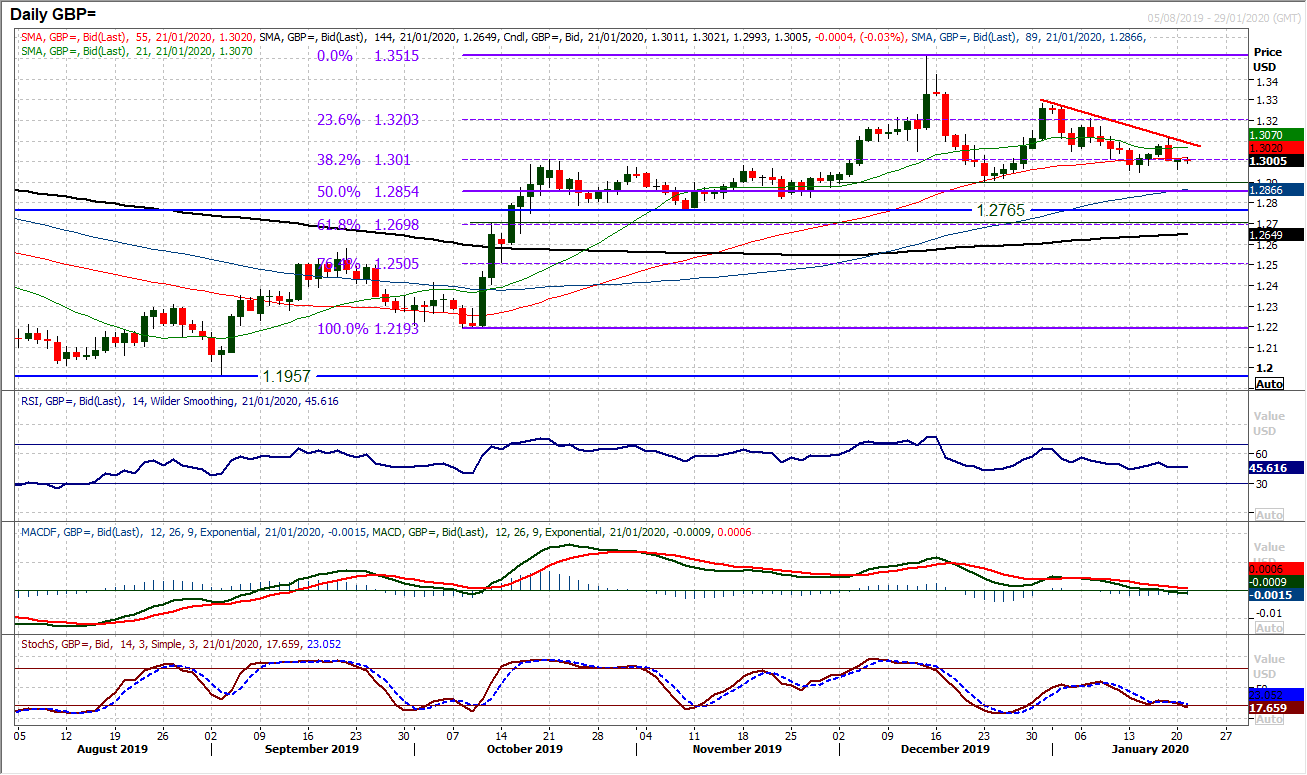
The bulls are being tested once more as Cable has dipped back into the support band $1.2900/$1.3000. So far in 2020, this has been an area where the buyers have tended to resume control and been happy to support. Although it was a US public holiday yesterday, a rebound off $1.2960 yesterday has pulled the market back above $1.3000 again. It is too early to suggest this is another important rebound from support, but there are signs of improvement again. The important move though would be to now break what is a growing near term downtrend of the past three weeks. The trendline comes in at $1.3090, so there is still a way to go in a recovery, but it is interesting that once more, with the RSI holding around 40/45 the market is being supported. However, we also need to keep an eye on MACD and Stochastics lines, which are deteriorating once more. Key support is $1.2900 (the late December low) and $1.2950 (the January low). The hourly chart shows a minor reversal pattern of improvement, but there is resistance $1.3025/$1.3060 that needs to be breached.
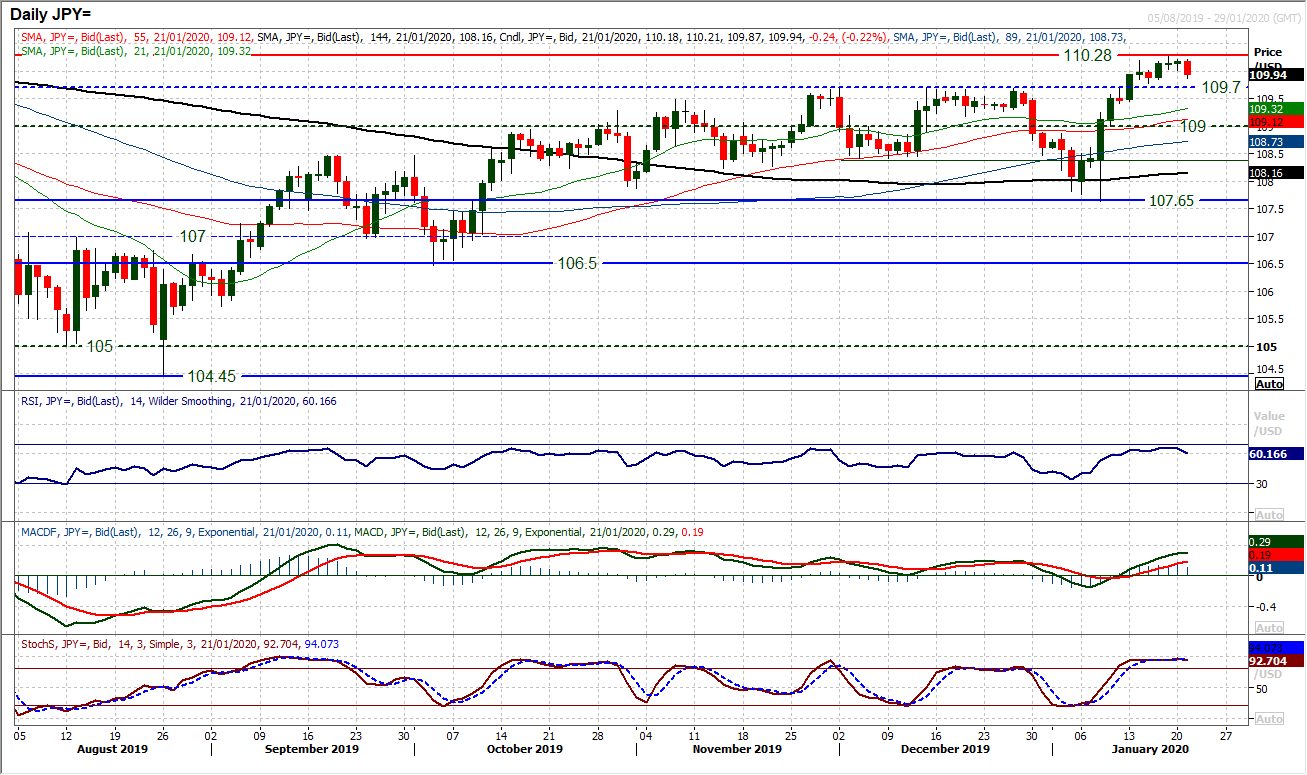
Dollar/Yen has spent the past few sessions hovering around 110.20, and holding the breakout above 109.70. However, the fear has been that, like so many previous attempts, the breakout would quickly consolidate and fall away again. It has taken a few days, but an early slide back today could be a move now that ushers in a correction. Momentum indicators are worth watching, with the RSI dropping back. The RSI failing below 60 (on a closing basis) would be an important signal that would suggest the bulls losing their strength. The hourly chart shows that there has been a rolling over of the breakout, however, it would need a breach of 109.70 (the breakout support) to really suggest that a corrective move was setting in. So the reaction to this morning’s early selling will be important. If it is confirmed as the US traders return to their desks, then a breakdown below 109.70 would be the threat. Holding above 109.70 support is needed to maintain a positive outlook for this breakout. Resistance at 110.20/110.30 is growing too. A closing move clear of 110.20 opens 110.65 and then towards 111/112.
Gold
Gold is positioning more positively in recent sessions as a run of higher lows has formed. We have been talking about how gold has been performing well despite a stronger dollar, so if/when the dollar does begin to slip back again, gold is in prime position for renewed upside. And so, with the underlying support for gold growing, a push through initial resistance at $1563 has subsequently been seen today. Daily momentum has been bottoming for the past few sessions, and RSI is now picking back up into the high 60s, whilst Stochastics also look to be crossing higher again. Looking at the hourly chart there is a positive bias forming to momentum, with MACD lines consistently above neutral now and RSI looking to push into the 60s. Support is with the breakout of $1563 and then $1555/$1558, with a pivot support at $1546 now a marker for the bulls. The next resistance is the 23.6% Fibonacci retracement (of $1445/$1611) at $1572, above which is effectively a full retracement to $1611 again.
WTI Oil
Indicative intraday moves with US oil trading shut for Martin Luther King day means that the market has been volatile into early trading today. A sharp retracement lower brings the support of the key pivot of what is now $57.35/$57.85 back into prominence. Along with the support of a slightly shallower (but still three months) uptrend there is a confluence of support around the $57.50 area now. We still see RSI holding around this 40 area and this once more is a key moment for the medium term outlook. A close below $57.35 would be a significant bull disappointment now and would open $55.00 as the next support. Friday’s traded high of $59.00 is resistance.
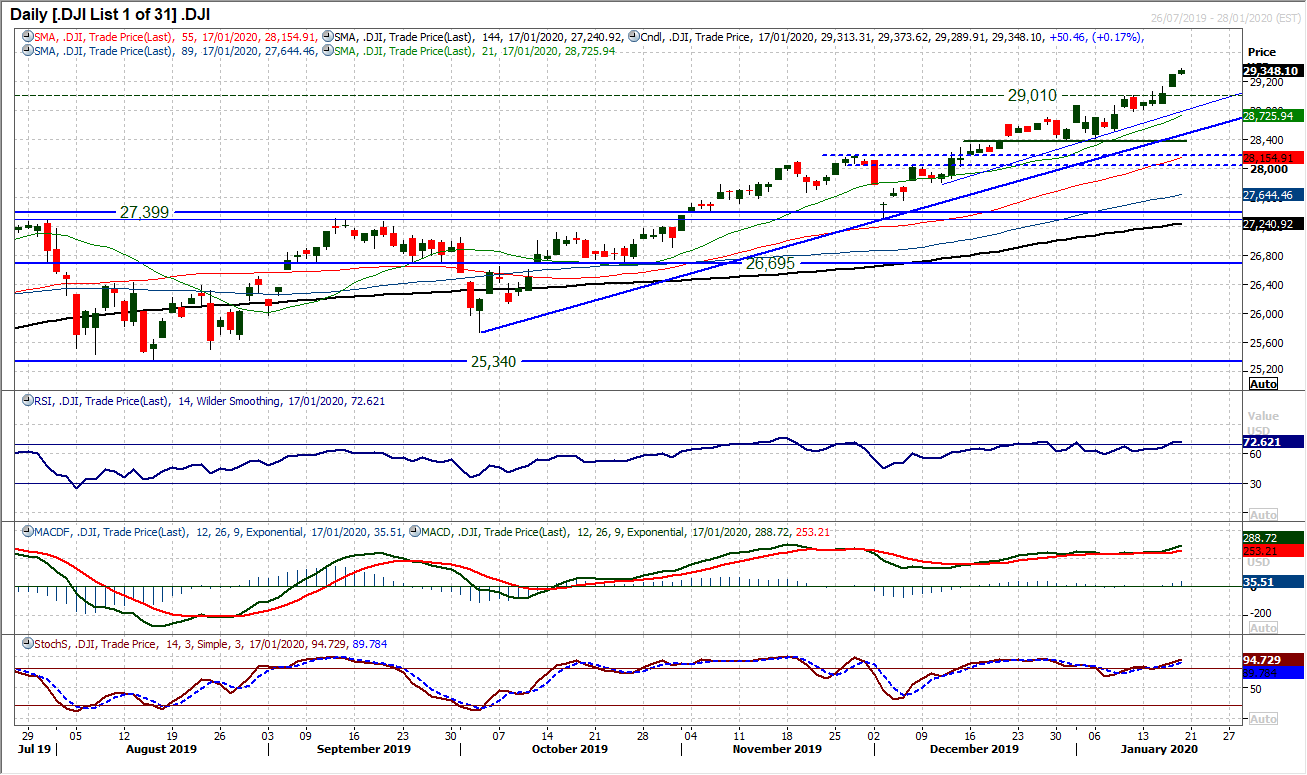
Another positive candle on Friday and another close at an all-time high, before yesterday’s public holiday where the market was closed. Momentum with the run higher continues to build into strong configuration now. Although with marginally stretched momentum there will be a corrective move at some stage, and with the futures hinting at an early unwind today, an initial correction could be seen. There is still a gap open at 29,127 which ideally needs filling, whilst the first real support comes in at 29,010 and back around 28,873. Support of a five week uptrend comes in at 28,835 today too. We still see near term weakness as a chance to buy and with little real slowdown in momentum, Friday’s high at 29,374 is unlikely to be the ultimate all-time high of this bull phase.
DISCLAIMER: This report does not constitute personal investment advice, nor does it take into account the individual financial circumstances or objectives of the clients who receive it. All information and research produced by Hantec Markets is intended to be general in nature; it does not constitute a recommendation or offer for the purchase or sale of any financial instrument, nor should it be construed as such.
All of the views or suggestions within this report are those solely and exclusively of the author, and accurately reflect his personal views about any and all of the subject instruments and are presented to the best of the author’s knowledge. Any person relying on this report to undertake trading does so entirely at his/her own risk and Hantec Markets does not accept any liability.
