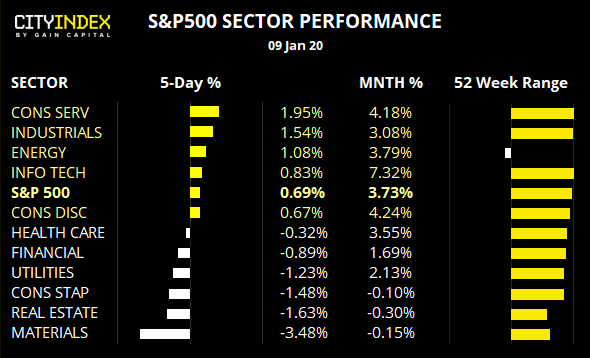
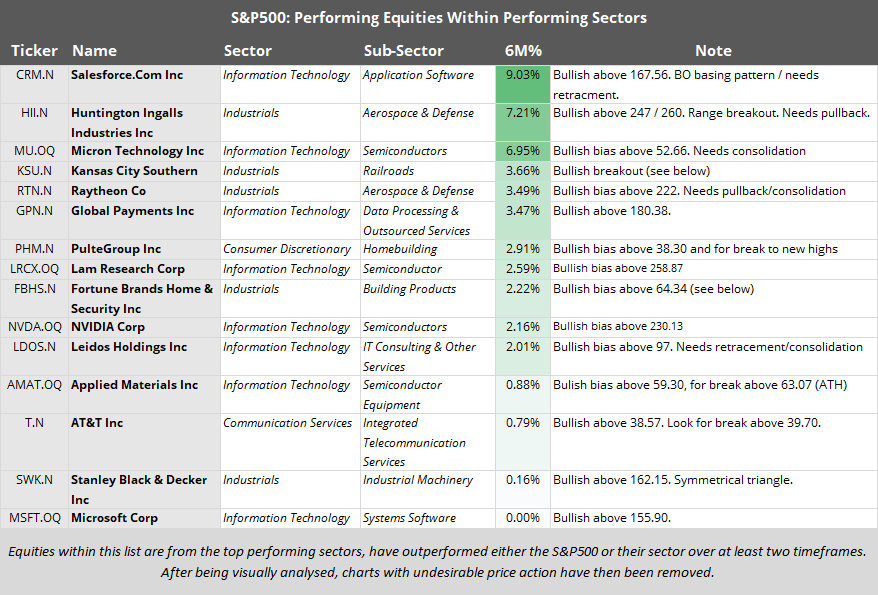
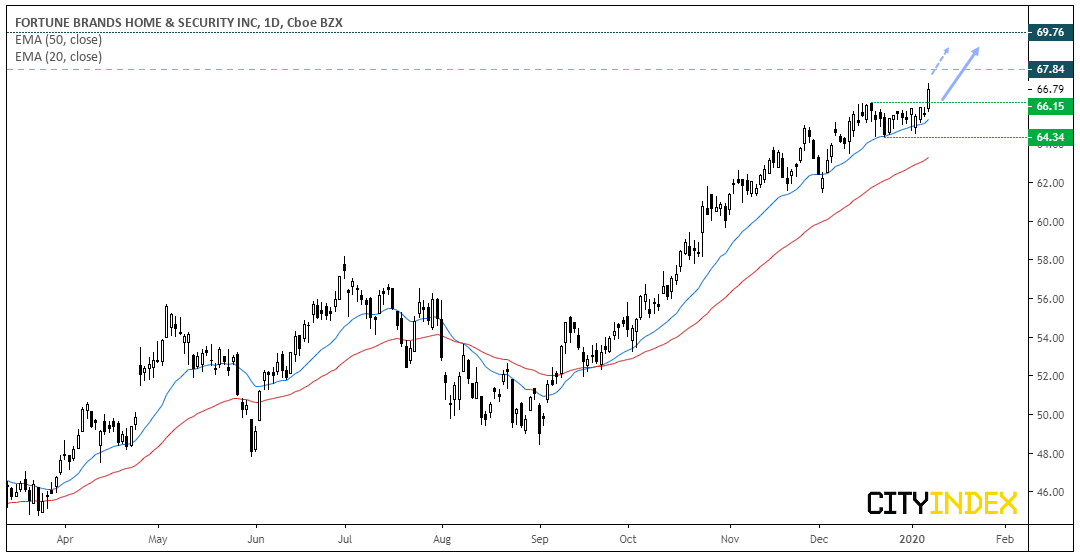
The S&P500 made a fresh all-time high on an intraday basis, yet closed back beneath the 3258.10 high. It’s not quite a bearish hammer, but it does show a hesitancy to break higher for now. Still, E-mini futures posted an elongated, bullish hammer and Asia prices are sniffing at the record highs. With Middle East tensions on the back burner (for now) and the potential for a phase one trade deal on Wednesday, we favour the index to break to new highs. However, if it’s to break beneath 3200 then a correction is underway.Info-tech, consumer services and industrials have been the strongest performers over the past 52-weeks. Yet measured from the December 2018 low, the clear winner is the real estate sector having racked up +17.3%. In fact, over this period the only other sector to gain is the communications sector at +2.9%.The energy sector remains effectively rangebound, much like after its failure to break out of its 9-month high. It’s also the only sector to trade lower over the past 52-weeks, and trail other sectors performance by a long shot.Fortune Brand Home & Security (FBHS): A breakout to new highs has been supported by a strong trend structure, following a period of consolidation at the highs. Furthermore, the breakout was seen in higher than average volume but. The trend remains bullish above 66.34 but traders could seek bullish setups above 66.15.
Bulls could seek dips above 64.34. Although a direct break above yesterday’s high could entice momentum traders, who could use 66.15 to aid with risk management.3rd party Ad. Not an offer or recommendation by Investing.com. See disclosure
here or
remove ads
.
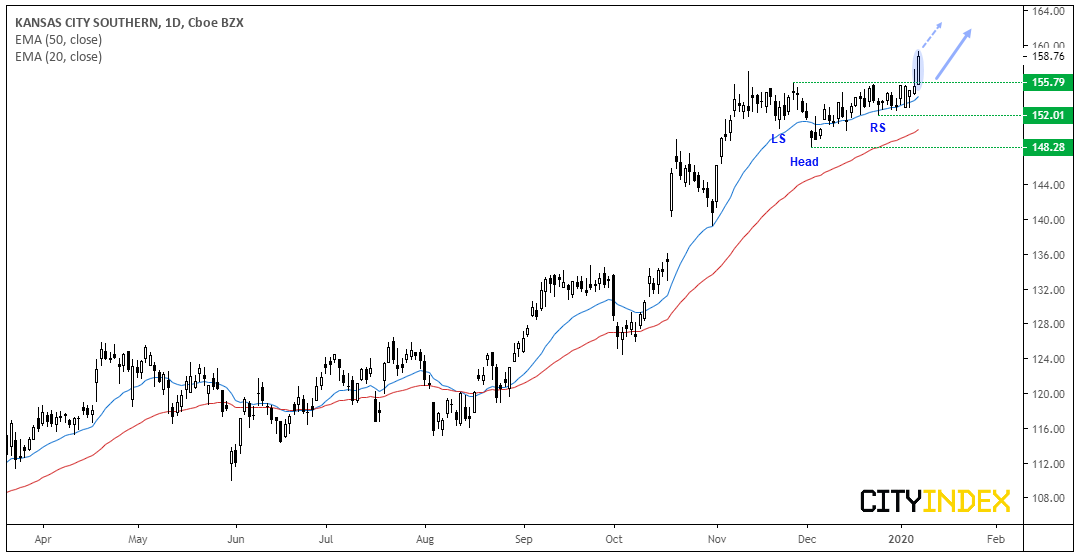
Kansas City Southern (NYSE:): After consolidating for over two months around record highs, we finally saw a bullish breakout on a strong close to fresh highs. It also appears to have confirmed an inverted head and shoulders pattern, which is a continuation pattern in an uptrend. Moreover, the breakout was on high volume to show strength coming into the move. Whilst the daily trend remains bullish above the 148.28 wing low, momentum traders could look for closer areas of support to aid with risk management.
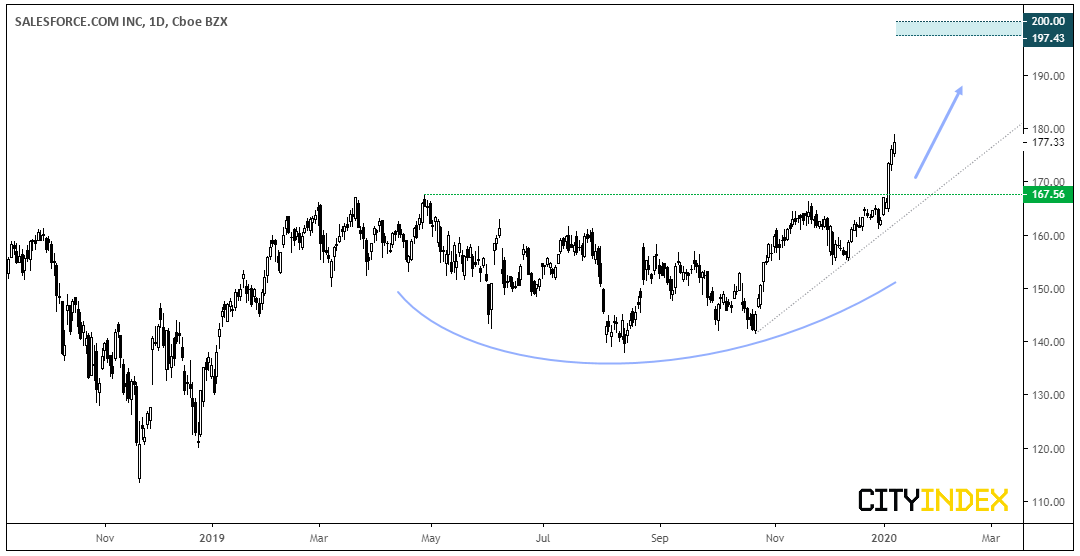
A break above yesterday’s high assumes direct gains, and the 155.79 resistance level can be used to aid risk management.If prices consolidate, bulls could use the 152 swing low to maintain their bullish bias (as a break below it invalidates the setup).Bulls could use an open target with it being at record highs.Salesforce.com (NYSE:): Monday saw a breakout from an 8-month basing pattern on high volume. If The pattern projects a target just below 20, if successful. Ultimately, we remain bullish above the 167.56 breakout level, but we’d prefer to see a pullback towards this key level or a period of consolidation.
Bulls could wait for a retracement and to see if either the 167.56 breakout level or bullish trendline holds as support.3rd party Ad. Not an offer or recommendation by Investing.com. See disclosure
here or
remove ads
.
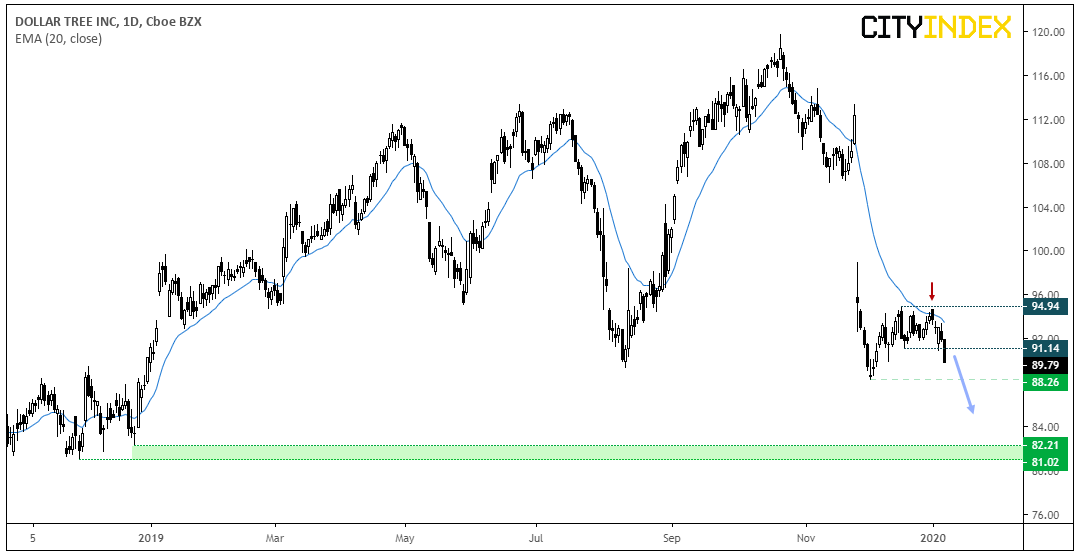
Dollar Tree (NASDAQ:): The dead cat has bounced and is now rolling over once more. Following a 13% gap lower in late November, it spent best part of December trying (but ultimately failing) to lift itself from the lows. Bearish momentum has clearly returned and the correction appears to have ended at 94.94.
Bias remains bearish below 94.94. although bears could also use 91.14 resistance to aid with risk management (or fade into).Due to the strength of the bearish trend, we anticipate a downside break of 88.26Bears could target the lows around 81-82."Disclaimer: The information and opinions in this report are for general information use only and are not intended as an offer or solicitation with respect to the purchase or sale of any currency or CFD contract. All opinions and information contained in this report are subject to change without notice. This report has been prepared without regard to the specific investment objectives, financial situation and needs of any particular recipient.
Any references to historical price movements or levels is informational based on our analysis and we do not represent or warrant that any such movements or levels are likely to reoccur in the future. While the information contained herein was obtained from sources believed to be reliable, the author does not guarantee its accuracy or completeness, nor does the author assume any liability for any direct, indirect or consequential loss that may result from the reliance by any person upon any such information or opinions."
3rd party Ad. Not an offer or recommendation by Investing.com. See disclosure
here or
remove ads
.
Original Post
