Market Overview
In light of what is on the near term horizon, traders can be forgiven for taking a step back in the next day or so. With a decision on the potential next tranche of tariffs due by 15th December, there is also central bank meetings of the FOMC, ECB and Bank of England in the coming days. Furthermore, a UK election result which could define the direction of Brexit (another key risk factor) for well into 2020. It perhaps comes as little surprise that major markets have hit a period of consolidation. Yields are lacking direction, forex major pairs are holding support and resistance levels, and gold continues to range.
Equities have been the most interesting mover of the key asset classes in recent days, but also show a lack of conviction early this week. It will be interesting if comments from the US Agricultural Secretary Sonny Perdue, that the tariffs will not be implemented, can cut through for traders today. The slightest degree of positive risk suggest only minimal reaction. The trouble is that the Fed and ECB are likely to sit very tight in their policy meetings, whilst the Bank of England will feel restrained from any action which could be deemed to influence the election.
It may not be until the small hours of Friday morning and the UK election at which the first signs of volatility return again. That is unless there is an indication of the tariffs decision before then. Overnight, China inflation showed mixed signals in November. China CPI jumped to +4.5% (+4.2% exp, +3.8% in October) amid soaring prices of pork in the swine flu epidemic. However, on the flip-side, the China PPI remains in deflation at -1.4% (-1.5% exp, -1.6% in October) as the trade dispute and global economic slowdown bites.
Wall Street closed lower last night with the S&P 500 -0.3% at 3136. However, a degree of stability has taken overnight, with US futures +0.1% higher. This has generated a quiet session in Asia (Nikkei -0.1%, Shanghai Composite +0.1%). European markets are equally cautious early today with FTSE futures +0.1% and DAX futures 0.1%.
In forex, a marginal slip back on USD is again taking off, with NZD rising to the top of the performance table, whilst JPY is underperforming. In commodities, there is almost no direction on gold or silver, whilst oil is also consolidating.
The economic calendar has a European focus today. The UK data comes with UK monthly GDP for October at 0930GMT which is expected to show +0.1% growth (-0.1% in September) with the rolling 3 month growth at 0.0% as stagnation continues. UK Industrial Production is at 0930GMT and is expected to show monthly growth of +0.2% in October (-0.3% in September) whilst this would marginally improve YoY growth back to -1.2% (-1.4% in September).
German ZEW Economic Sentiment is at 1000GMT and is expected to show a small improvement to 0.0 in December (from -2.1 in November.
The German ZEW Current Conditions are also expected to show improvement to -22.3 in December (from -24.7 in November).
Chart of the Day – French CAC 40
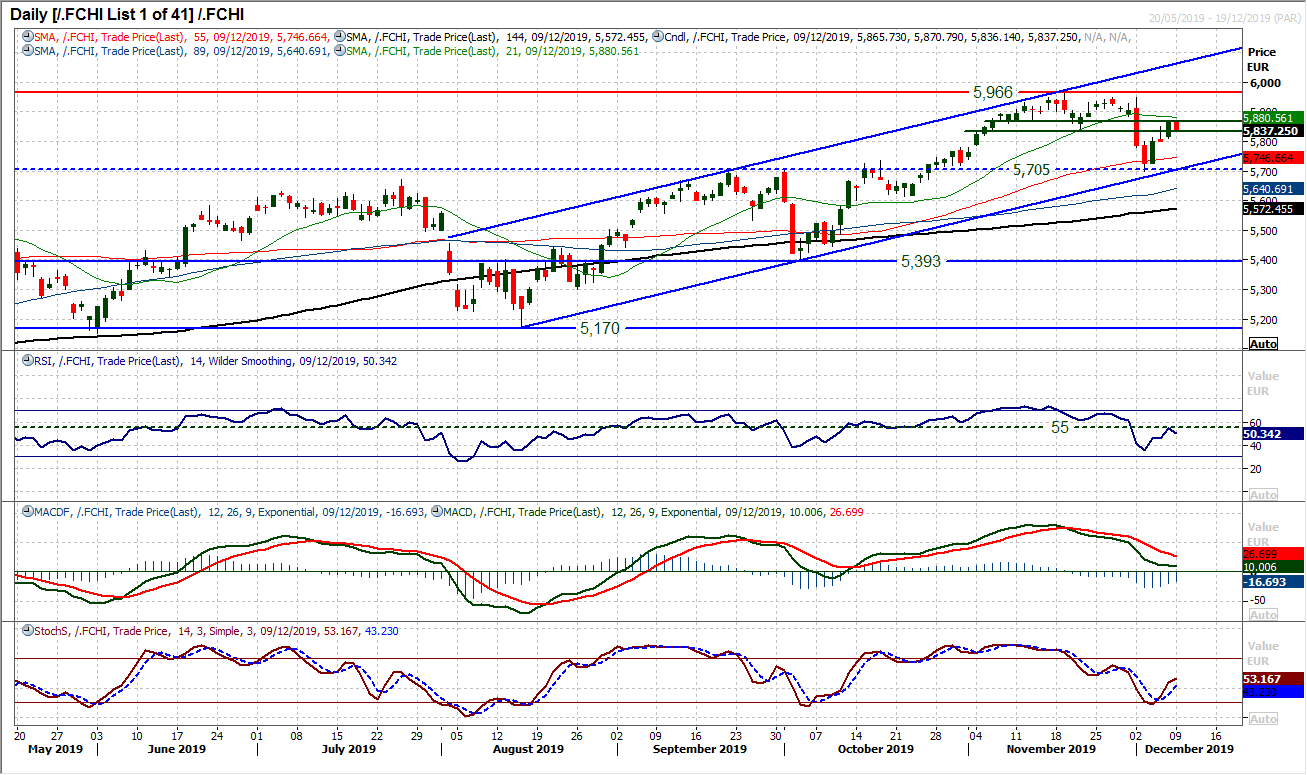
The French CAC has been trending higher since August as corrections have been bought into. The reaction to the sharp decline of early December has many similar hallmarks to the recovery in the wake of the early October correction. The rebound is once more back at an interesting inflection point. The bulls are ready, but the rebound has hit the buffers around some overhead supply from mid-November. However, given the renewed upside potential on momentum indicators, such as MACD Lines bottoming above neutral, the market is primed for the next leg higher. Near term resistance is around 5870/5875, whilst it is interesting to see the RSI faltering around 55, often a turning point for the next leg higher for the channel. It now needs a push through 5875 to open the move towards a test of the key resistance 5948/5966. A close back under 5800 would suggest the bulls may not quite be ready yet for the move, but whilst the trend channel is intact we are happy to buy into weakness.
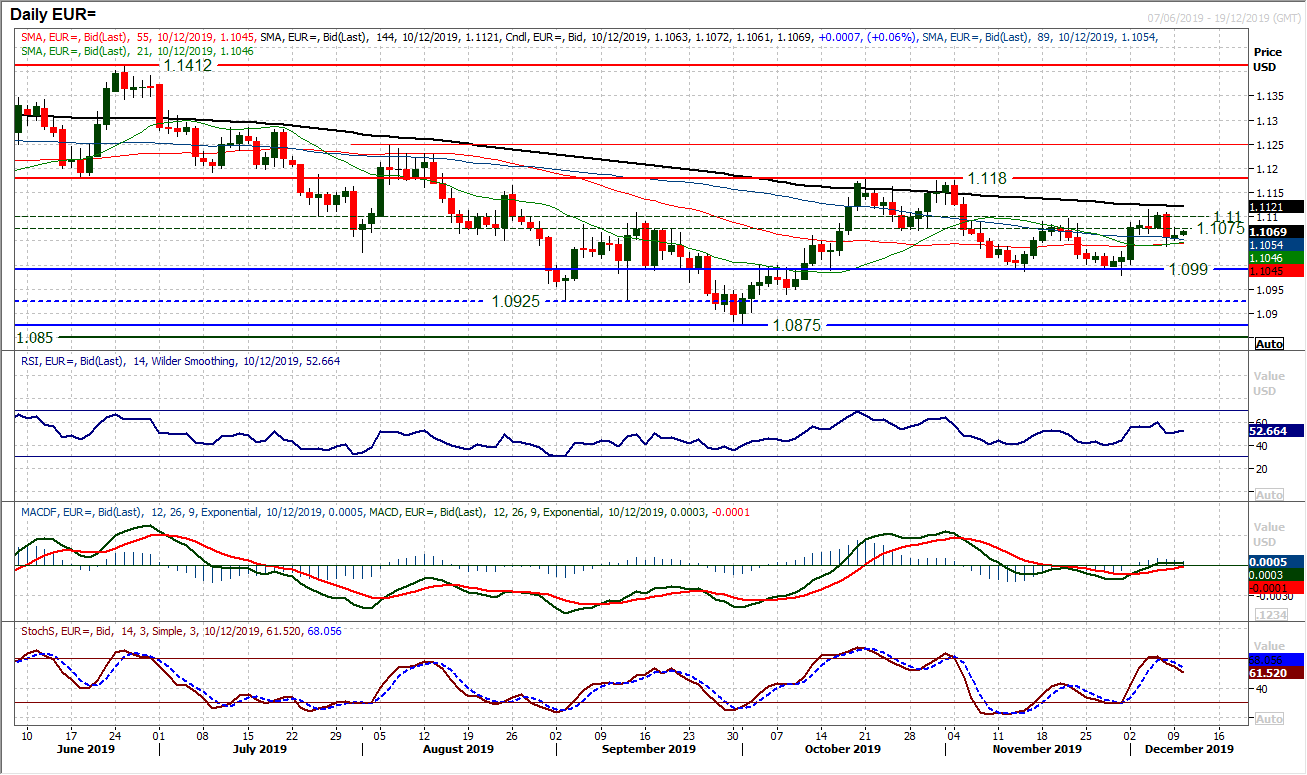
The signs are that EUR/USD will lack conviction in front of the FOMC meeting tomorrow (if not, in front of the tariffs decision). The sellers had an opportunity to take control after Friday’s bearish engulfing candle, but the consolidation that has followed suggests a market lacking conviction. Another early consolidation back towards the old $1.1075/$1.1100 mid-range pivot today reflects this. Momentum indicators are neutral (RSI flat almost bang on 50, MACD lines flat at zero) to very slightly corrective (Stochastics falling). However, there is nothing to suggest any conviction has built in the wake of Friday’s strong negative candle. It is a wait and see market once more. Initial support is at $1.1040 which protects the growing medium term floor at $1.0980/$1.1000. We still see the pivot band $1.1075/$1.1100 as a near term neutral zone.
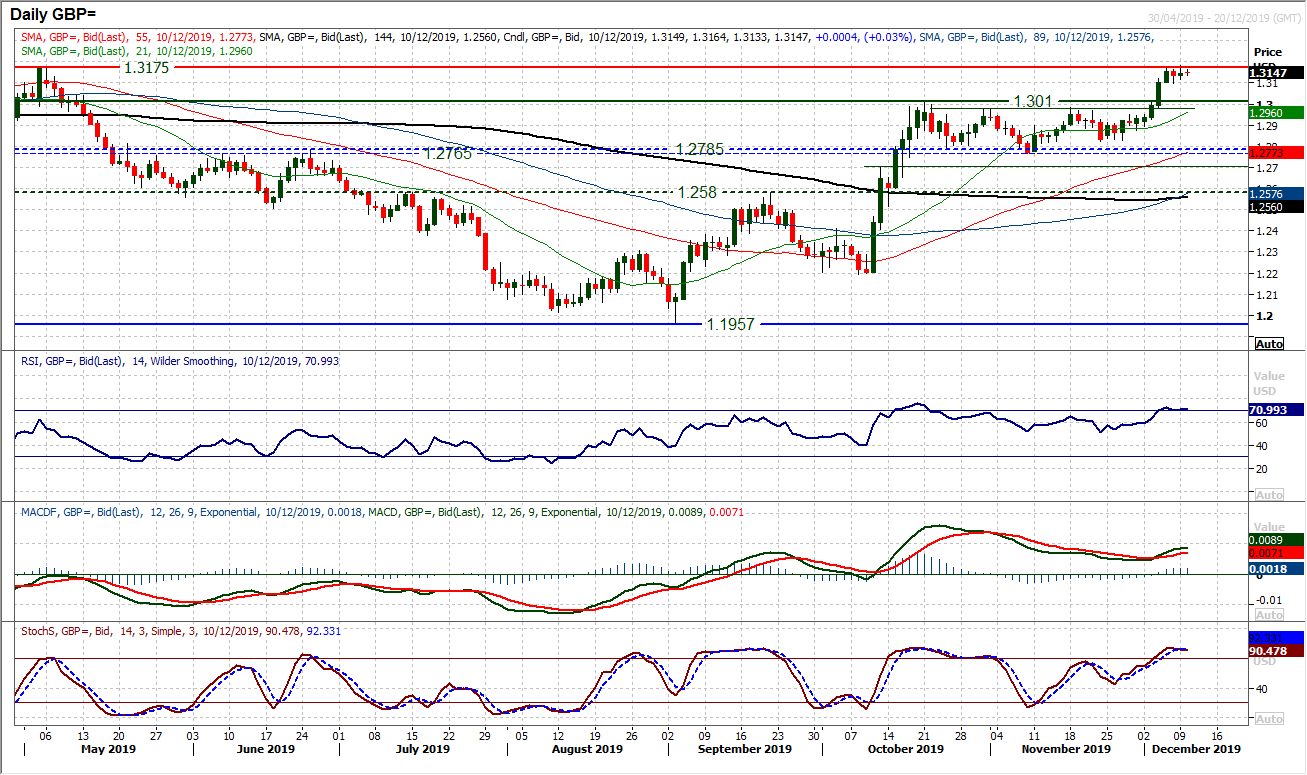
It is interesting to see that the past few sessions have been hitting the resistance around $1.3175 and been unable to push on. There is still the positive sterling bias which has helped to pull Cable well clear of $1.3000, however the market is starting to stall. The Fed on Wednesday (no surprises likely) followed by the Bank of England (definitely no surprises on election day) but the real action will be in the early hours of Friday morning. An election result going with the polls which gives the Conservatives a solid majority would be sterling supportive for the run higher. Technical momentum is strong and this is a scenario that traders are seemingly positioning for. Initial support at $1.3100 protects a drift back towards $1.3000. A retreat could be seen if the final polls show recent campaign gaffs by the Conservatives have hit them in the polls. We expect a small majority which would be the most market neutral outcome and a tepid reaction on Cable. Above $1.3175 opens $1.3250 (implied breakout from consolidation rectangle) and $1.3385 the March 2019 high.
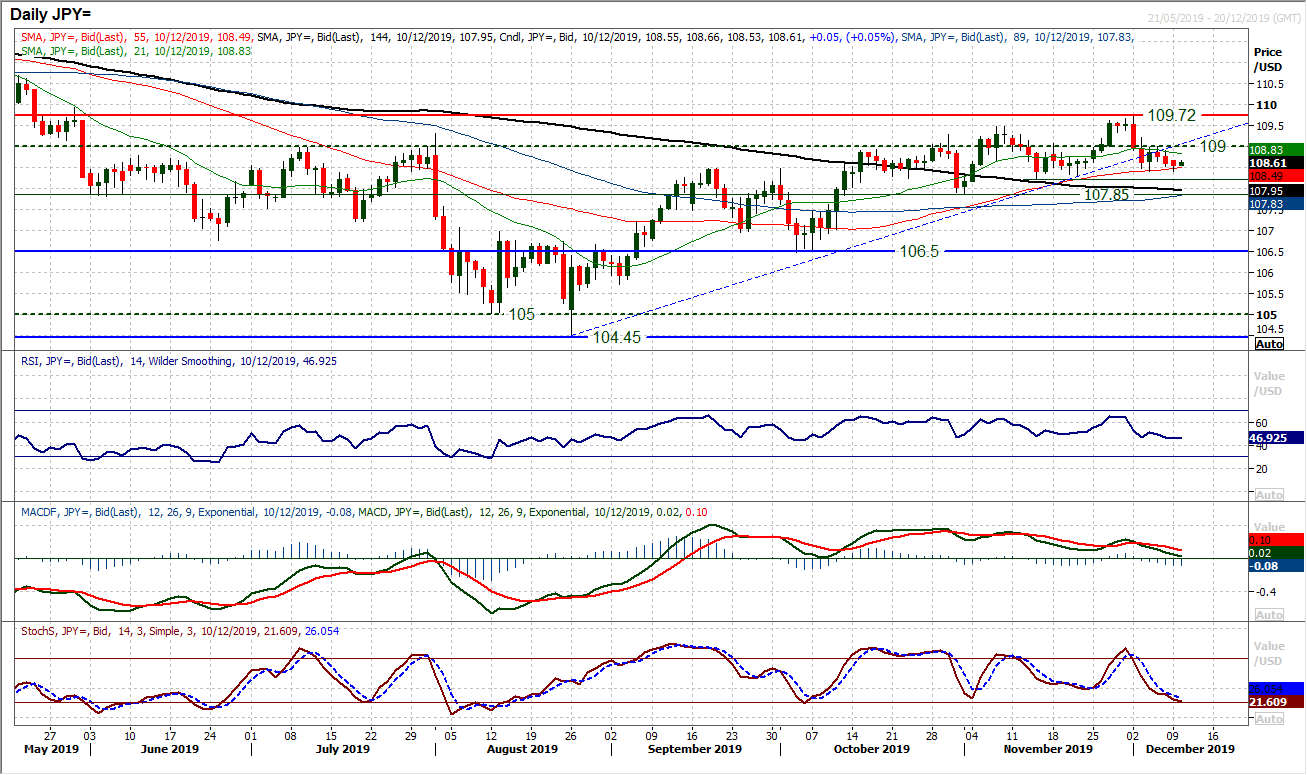
The building sense of dollar bulls having sustainably lost control continues to grow. Having failed to find positive traction in the wake of such an unambiguously strong payrolls report on Friday, the bolstering of resistance at 109.00 is leaving the bulls at risk of a correction. With another negative candle yesterday (there has been one positive candle in eight sessions now), the initial support at 108.40 is under threat. However, initial support at 108.40 has again held overnight which suggests a market again lacking real conviction. The key support remains at 108.25 which is the first higher low of the old multi-month uptrend and if this were to be breached it would be a significant moment in the medium term outlook. There is still a marginal positive configuration on medium term momentum, but there is an increasingly tentative sense of this. The RSI needs to hold above 45 and MACD lines above neutral to sustain this.
Gold
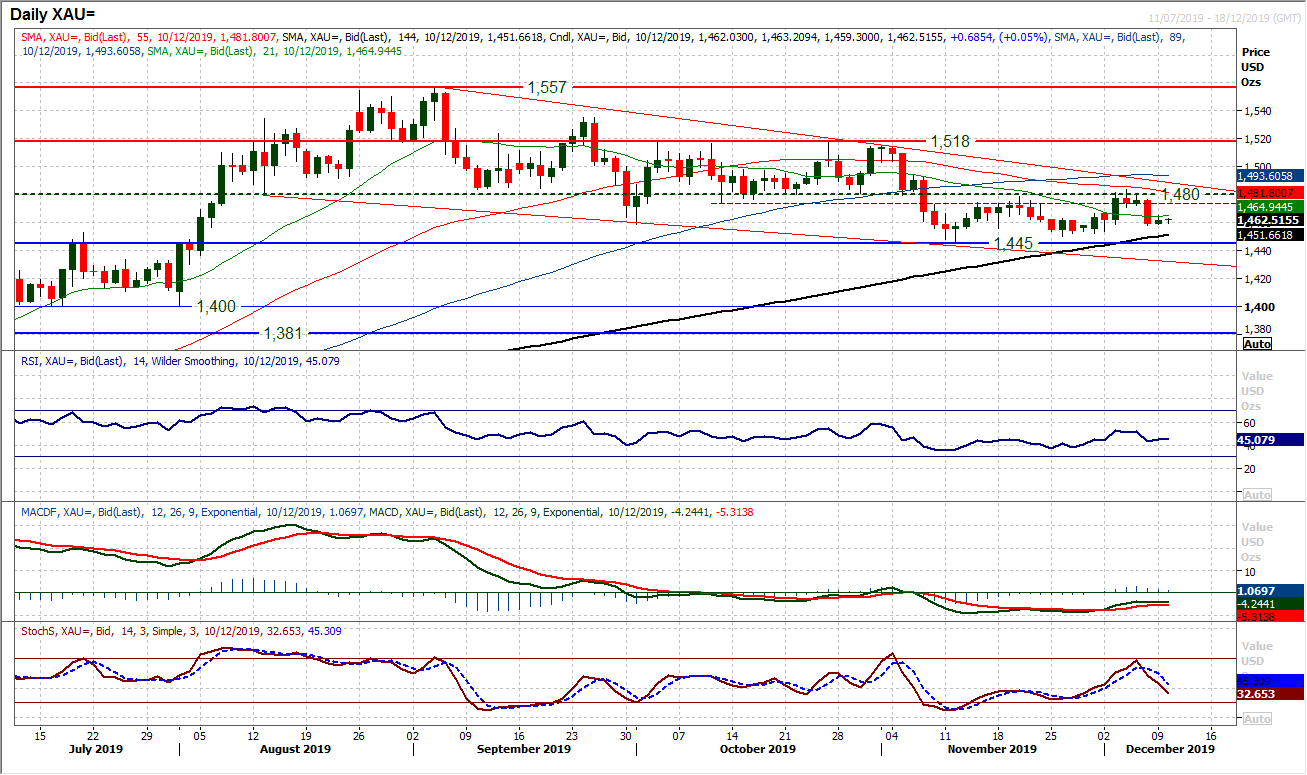
There is still a lack of conviction running through the gold market. After Friday’s bear candle there was an opportunity to be decisive, but this is a market unable to take a view right now. We have been (and continue to be) medium term negative on gold, given the run of key lower highs and lower lows over recent months. Rallies remain a chance to sell. However, support around $1445/$1450 is building as an area that remains intact over recent weeks. Given the importance of the tariffs decision in the coming days, we do not expect gold to take any decisive direction (unless the Fed throws a massive curve ball). If the US decides to not implement tariffs this would be risk positive and gold negative. A close below $1445 opens $1380/$1400 again. Key resistance around $1480/$1484 is building, with the top of a downtrend channel around $1488 today.
WTI Oil
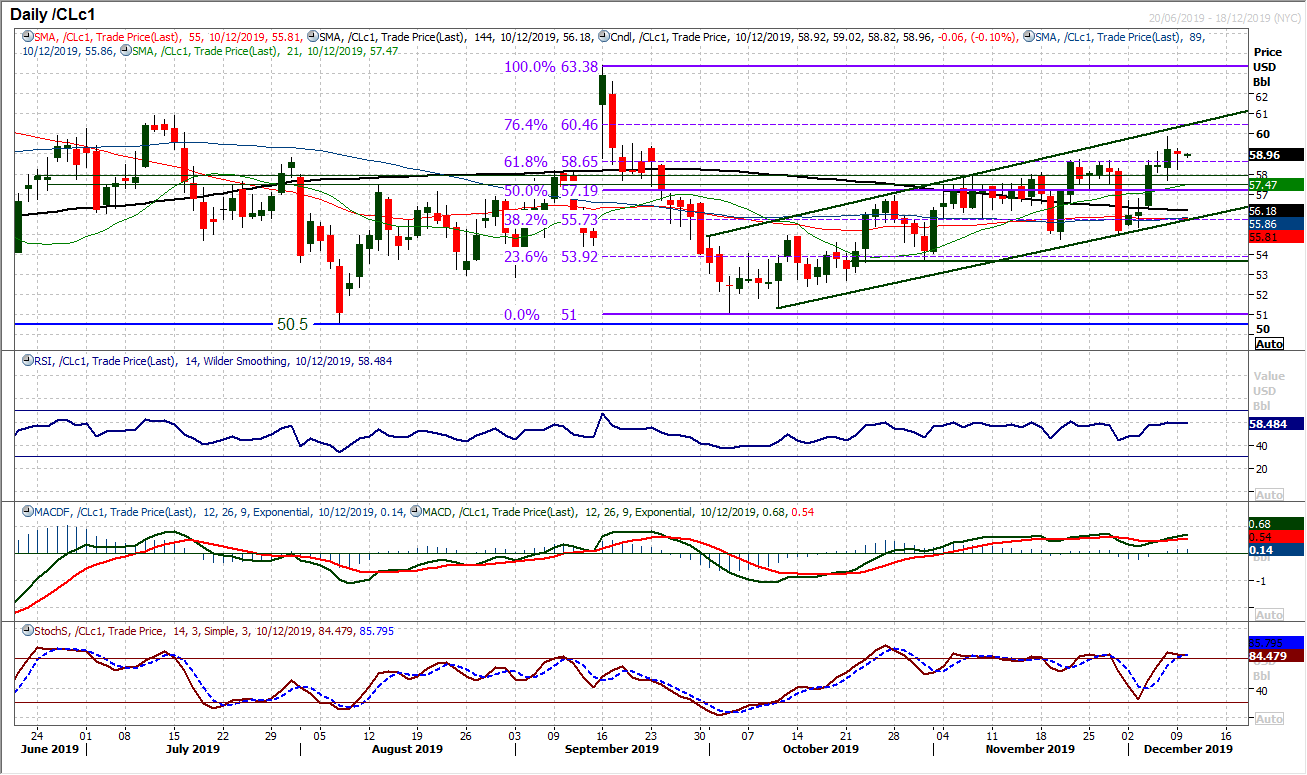
The history of this recovery on WTI over the past nine weeks shows that breakouts struggle for sustained traction. Breakouts above resistance tend to be met with consolidation before another spike lower lends a buying opportunity. Friday’s latest breakout has since been followed by an inside day yesterday and another early consolidation today. It is interesting to see that momentum indicators are tailing off again (RSI at or around 60) and Stochastics lines a shade above 80. We remain buyers into weakness as too many times the breakouts have not been the conviction signal to buy. There is support again around $57.20/$58.00. We do see a positive recovery outlook continuing on oil, but breakouts should be viewed with caution. If the US avoids placing extra tariffs on China then this would be oil positive.
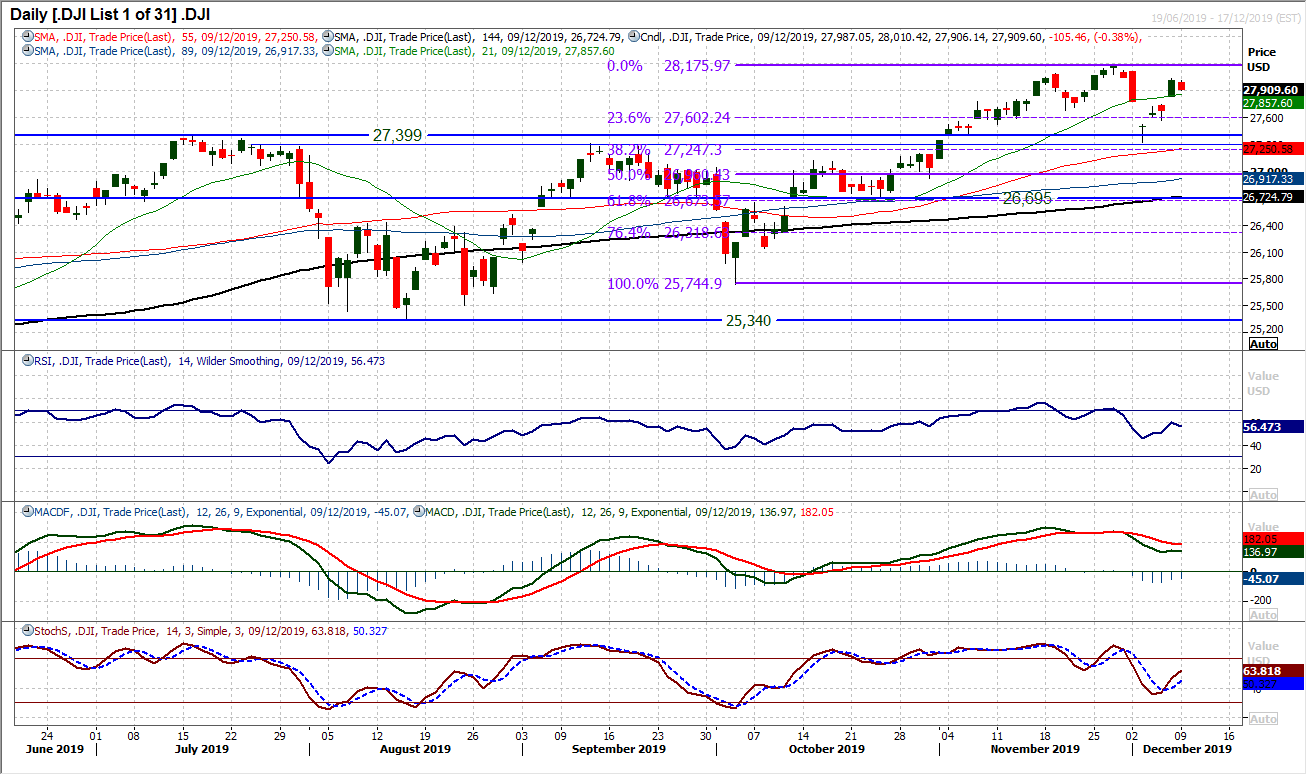
A minor corrective slip on the Dow has just taken some of the steam out of the move higher. An “inside day” has just pulled the reins on a rising RSI and Stochastics. Essentially, yesterday’s session has taken the impetus out of the bull run, but is likely to be part of a consolidation in front of a raft of key announcements in the coming days. Wall Street focus will be on not only the Fed (Wednesday), but at some stage in the coming days on a decision over tariffs. Technically, the Dow has initial support at 27,840 with a gap still open at 27,745. Given the legacy of Friday’s sharp move higher still is a dominant factor in this chart which has opened the highs again at 28,175, the inside day for yesterday’s session changes very little. We see near term rallies as a chance to buy for a retest of the high. Support at 27,562 is a key near term higher low.
"""DISCLAIMER: This report does not constitute personal investment advice, nor does it take into account the individual financial circumstances or objectives of the clients who receive it. All information and research produced by Hantec Markets is intended to be general in nature; it does not constitute a recommendation or offer for the purchase or sale of any financial instrument, nor should it be construed as such.
All of the views or suggestions within this report are those solely and exclusively of the author, and accurately reflect his personal views about any and all of the subject instruments and are presented to the best of the author’s knowledge. Any person relying on this report to undertake trading does so entirely at his/her own risk and Hantec Markets does not accept any liability. """
