Market Overview
With traders in the US busy eating their Thanksgiving turkey, major markets have seen time for a consolidation. In the absence of US bond markets, in a time of yield differentials being key, this means a period of quiet. There is yet to be any significant reaction to Donald Trump signing into law the Congressional bills supporting Hong Kong. Equally there has been little reaction to China’s response which warns of “firm counter measures”. The question is whether the two sides can leave the issue of Hong Kong and that of “phase one” of a trade agreement as mutually exclusive. Without US bond markets for guidance, reaction across major markets has been muted.
We could get more of an indication today with US bond markets open for a half day this morning, but again liquidity will be reduced and we may not get a true reflection until Monday. There is very little direction of note on the G4 currencies, whilst gold is again almost dead flat. There is still a broad expectation that moves towards a rudimental trade agreement are still progressing. Risk appetite is still cautious this morning (equities lower, whilst mild weakness for the Chinese yuan is also a reflection of this) but we are still buyers of risk into weakness. Watch for some elevated volatility on the euro this morning, with flash Eurozone inflation on the agenda.
Wall Street was shit for Thanksgiving yesterday, but US futures are -0.3% this morning. Asian markets slipping slightly overnight, with the Nikkei -0.5% whilst Shanghai Composite -0.6%. European markets are again a shade cautious this morning with FTSE futures and DAX futures -0.3%, both following the US.
In forex, there is almost zero direction to speak of across major pairs. In commodities, there is also no notable direction on gold or silver, whilst oil is also flat.
With the US still digesting Thanksgiving turkey, there is a focus on Eurozone inflation on the economic calendar today. Flash Eurozone HICP for November is at 1000GMT is expected to see headline inflation improve to +1.3% (from +1.2% in October), whilst core inflation is expected to improve to +1.2% (from +1.1% in October). Eurozone Unemployment for October is at 1000GMT and is expected to remain at 7.5% (7.5% in October).
Chart of the Day – AUD/JPY
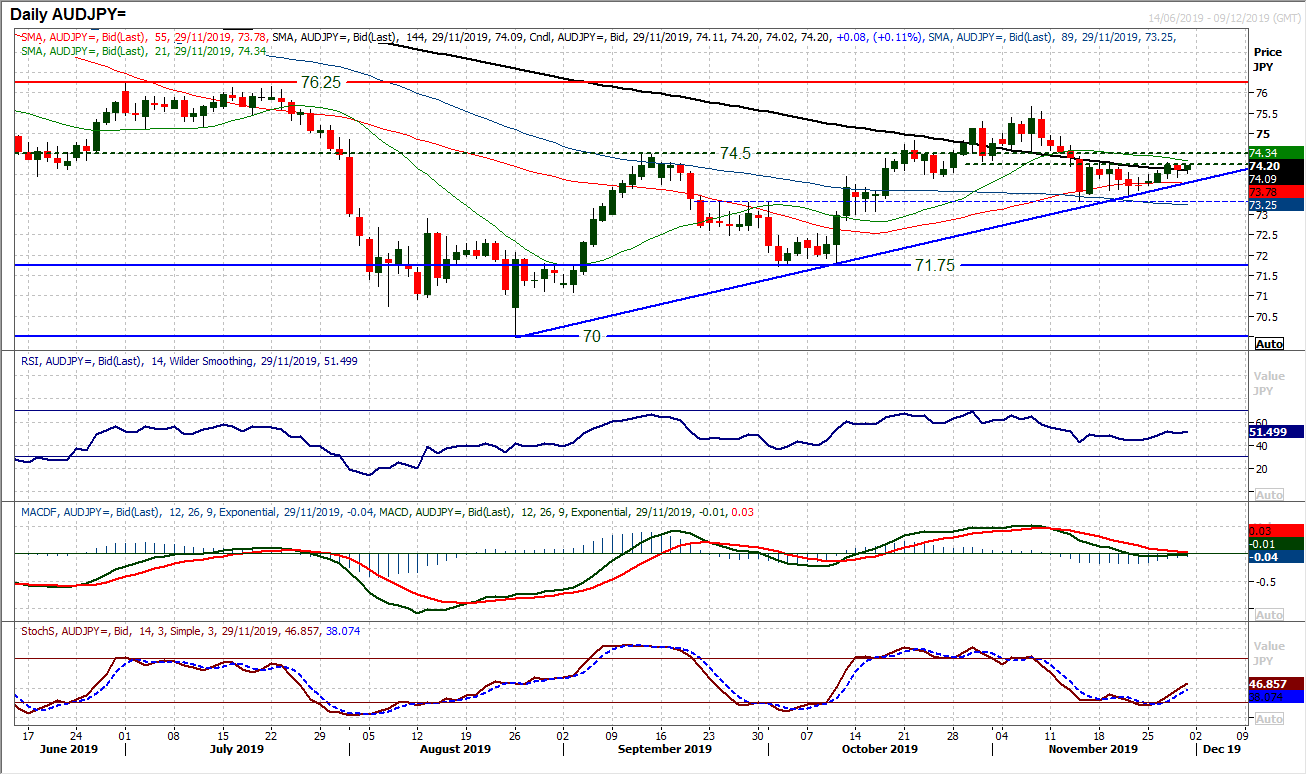
Despite the relative pressure that the Aussie has been under in recent weeks through the major forex crosses, we continue to see the broad positive risk appetite reflected through AUD/JPY. The three month uptrend continues to track higher and underpin the market. A test of the pivot band resistance is now underway and could be the key turning point for the next bull run. There is resistance being tested now at 74.30/74.50 and this week, the resistance band has formed the barrier. It comes as momentum indicators turn higher around key levels. The RSI has again turned higher around 40, whilst MACD lines are bottoming out around neutral, whilst Stochastics are swinging higher from a bull cross. There is undoubtedly a squeeze coming with the three month uptrend up at 73.80 today, but the bulls are positioning for renewed upside. A close above 74.50 is still needed, and yesterday’s negative candle has not helped the bulls. However, there is still an uptrend to be bought into and the bulls are finding support at higher levels again. Support at 73.35/73.50 is increasingly important now.
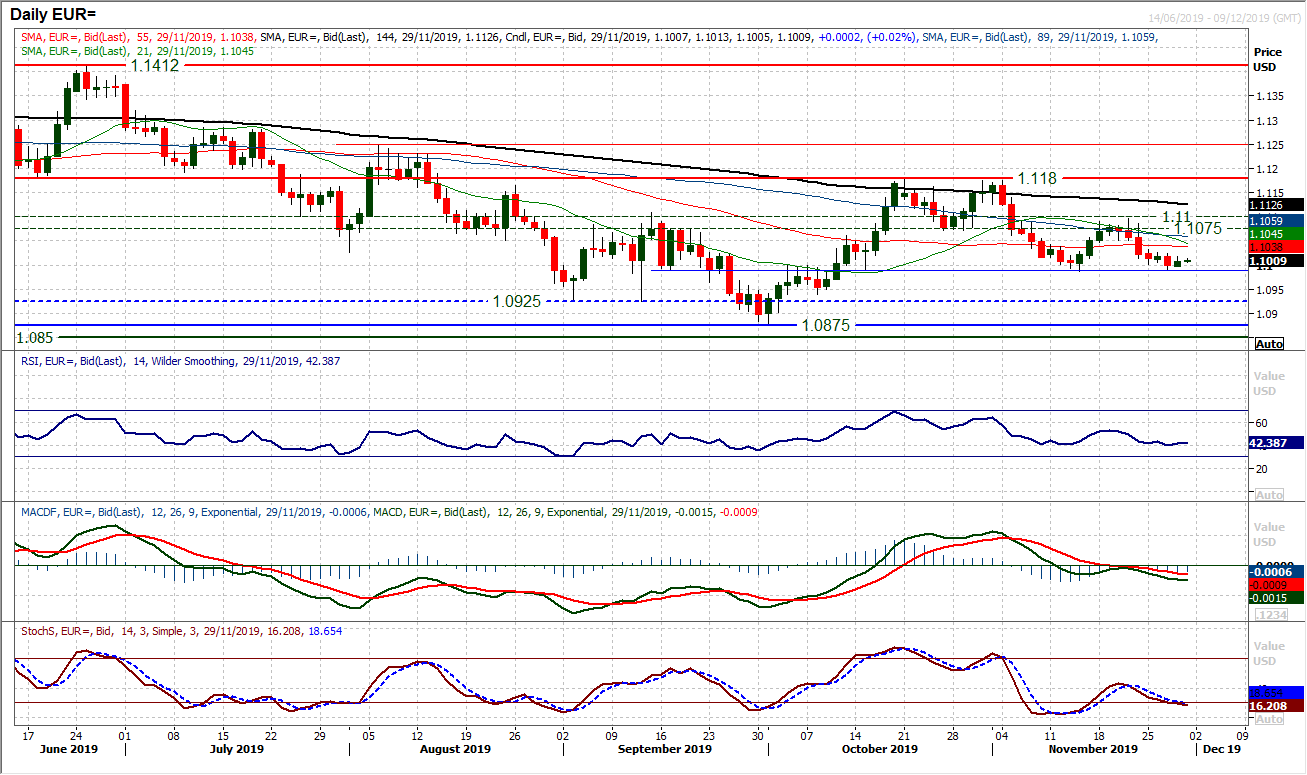
With the US on public holiday yesterday the euro bulls took the opportunity to build support. A mild positive session has allowed the support around the old pivot of $1.0990 to develop. The longer this support is tested and holds, the more important the implication of the next move. We see this morning, once more the support is still holding, but again this is a shortened session on US bond markets, so we may not get a true reflection of market outlook until Monday. This comes as resistance built up throughout this week at $1.1030/$1.1050 also weighs. Given the negative bias on momentum indicators (MACD lines falling, Stochastics into bearish configuration, we continue to hold an outlook of corrective slip on EUR/USD. However, a breach of $1.0990 remains elusive for now, and whilst the RSI remains above 40 we would not see this as being confirmed. A close below $1.0990 would be the key move, opening the lows $1.0875/$1.0925. Resistance overhead comes in immediately at $1.1030/$1.1050 with the pivot band $1.1075/$1.1100 above.
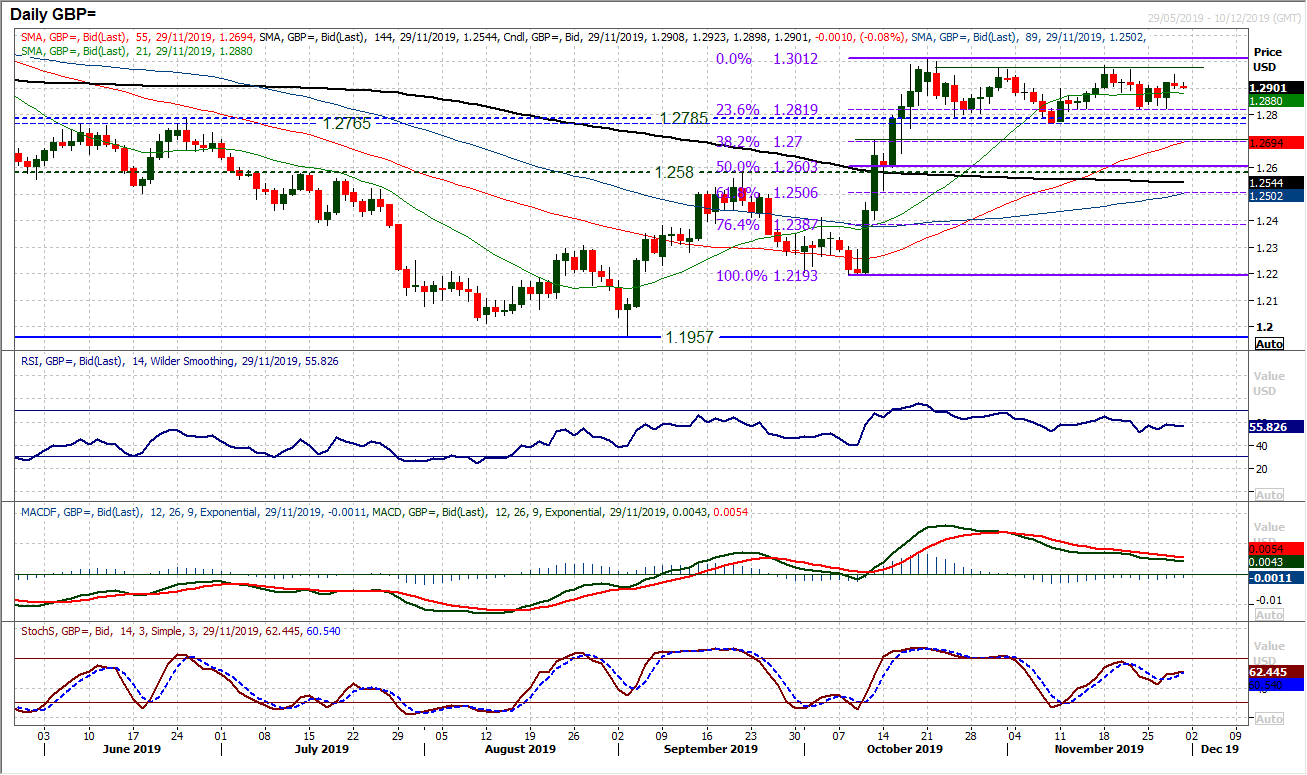
Despite a mildly corrective candle yesterday, there is a slight positive bias now within the six week trading range between $1.2765/$1.3010. Tuesday’s decisive positive candle shows how the bulls are tied to the prospect of a Conservative majority in the UK election. Whilst there are still significant uncertainties surrounding this (yesterday’s mild slip came as numerous caveats to Tuesday’s favourable poll for the Conservatives weighed), there seems to be an appetite to continue to support weakness within this range now. The support band $1.2765/$1.2820 is growing in importance, whilst momentum indicators have been through a period of moderation in recent weeks and are settling around positive territory. The hourly chart shows support building around $1895/$1.2910 and a more positive hourly momentum set up. Resistance at $1.2950 initially which protects the consolidation range highs between $1.2975/$1.3010.
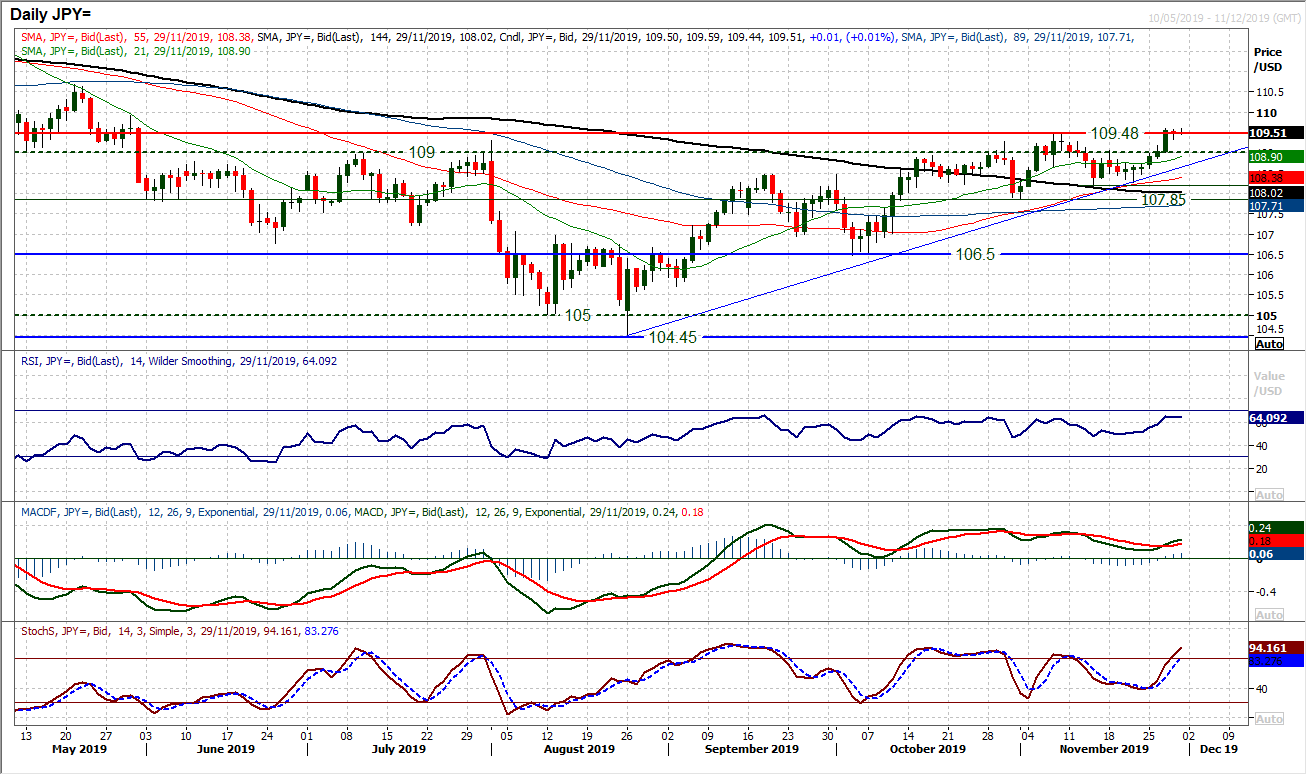
Whilst the market has held up around the old resistance at 109.50 there needs to be a significant caveat given to yesterday’s session, given the Thanksgiving public holiday for the US. We may not get a true reflection of how the market views Wednesday’s strong bull candle until Monday now (as today’s session is a shortened one for bond markets and therefore liquidity will be again significantly reduced). Despite this, holding decisively above not only the old medium term key resistance of 109.00, but also nearer term support at 109.20 is adding a positive bias. This is also coming through on momentum indicators which see the RSI holding above 60 and Stochastics moving into positive configuration. With the uptrend (albeit redrawn) of what is now the past 13 weeks, and a run of higher lows and higher highs, we look upon this breakout with positivity. We now just need to see the bulls believing that this is the time for confirmation of the move. So often previous moves to and above 109.00 have faltered. So holding on to 109.00 as a new basis of support would be a key indication of confidence. Closing (on Monday) above 109.50 opens 109.90 initially but the next key resistance is 110.65. The uptrend is at 108.65 today, with 108.25 now a key higher low.
Gold
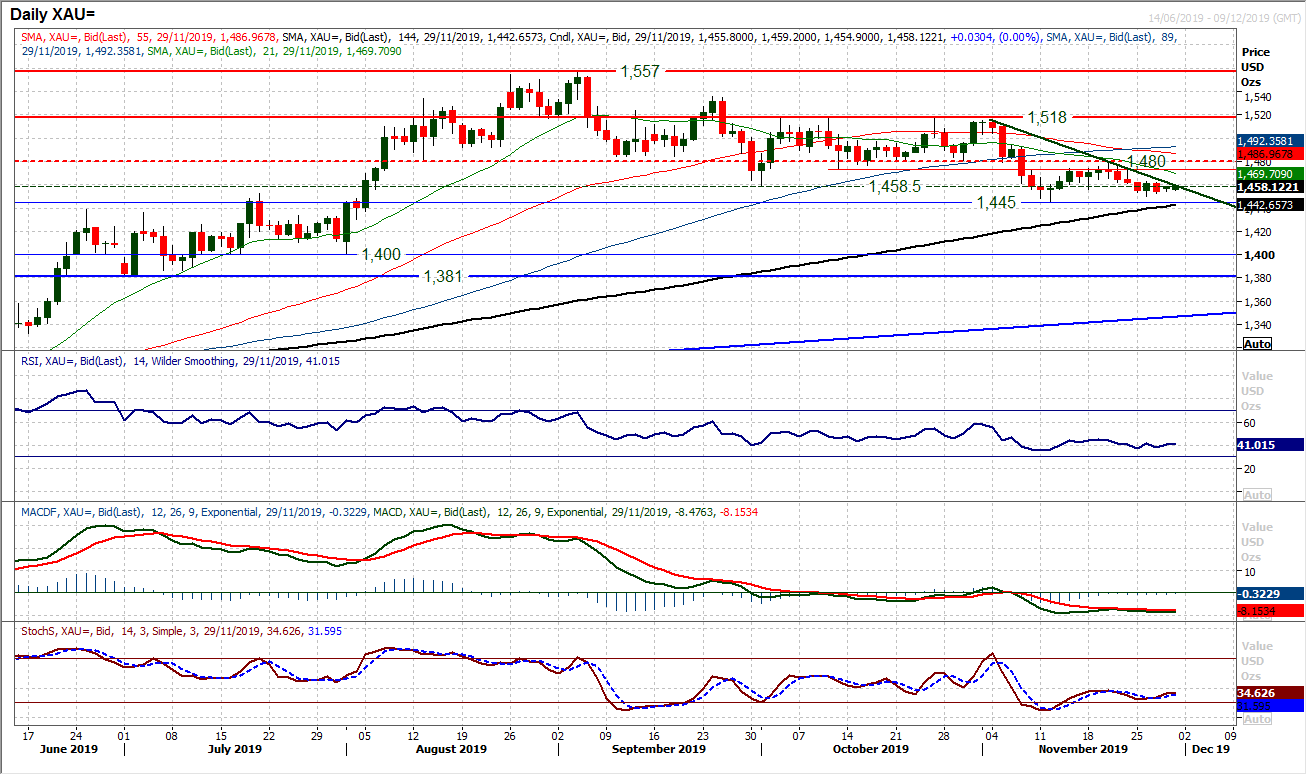
With the US being on public holiday for Thanksgiving yesterday, this has certainly reduced volatility on gold in the past day or so. This now means that a near term consolidation is running the risk of a breach of the near four week downtrend. Despite this, though, a consolidation to break a downtrend due to public holiday in the US does not equate to a recovery. There is still a lack of bull pressure, and a corrective outlook continues to build. The downtrend falls at $1459 today (there is intraday resistance around $1462 on the hourly chart) and momentum indicators remain correctively configured. It all suggests that rallies will continue to fade and pressure will grow on the November low at $1445. A breach of $1445 would continue the medium term run of lower highs and lower lows, with a retracement back into the $1380/$1400 support area. We remain sellers into strength, with the importance of the resistance band around $1480 growing by the day.
WTI Oil
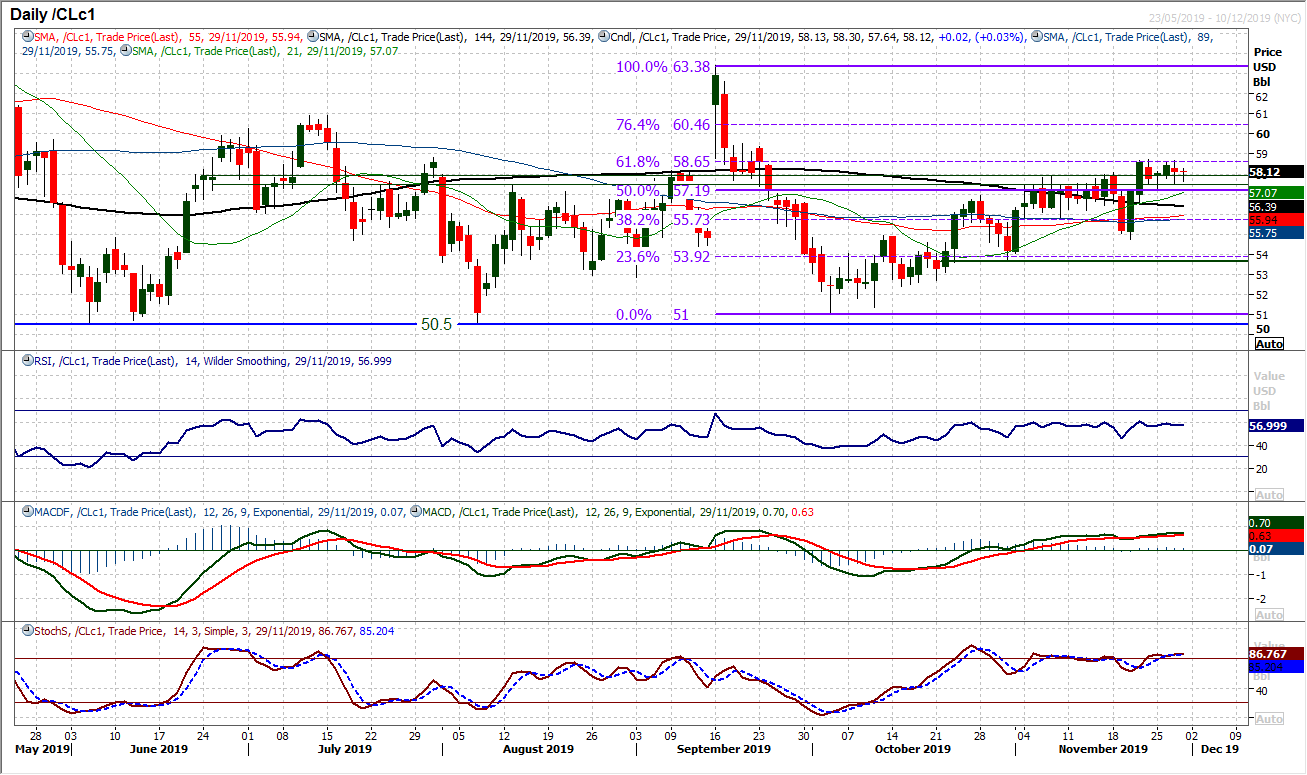
A period of consolidation has set in for WTI. However, this is a consolidation that the bulls will not necessarily mind. Having broken to an eight week high last week, WTI is now settling and has spent the past few sessions using old resistance levels as a basis of support. The 50% Fibonacci retracement (of $63.40/$51.00) at $57.20 marks a low of a range up t $57.80, the old November highs. Having not instantly given back the breakout will give the bulls confidence. With momentum indicators positively configured, weakness remains a chance to buy in this run of higher lows and higher highs. We would be looking for the next higher low above the key support at $54.75 now. The current barrier to gains is the 61.8% Fib at $58.65, but once this can be overcome, then 76.4% Fib comes into play at $60.45.
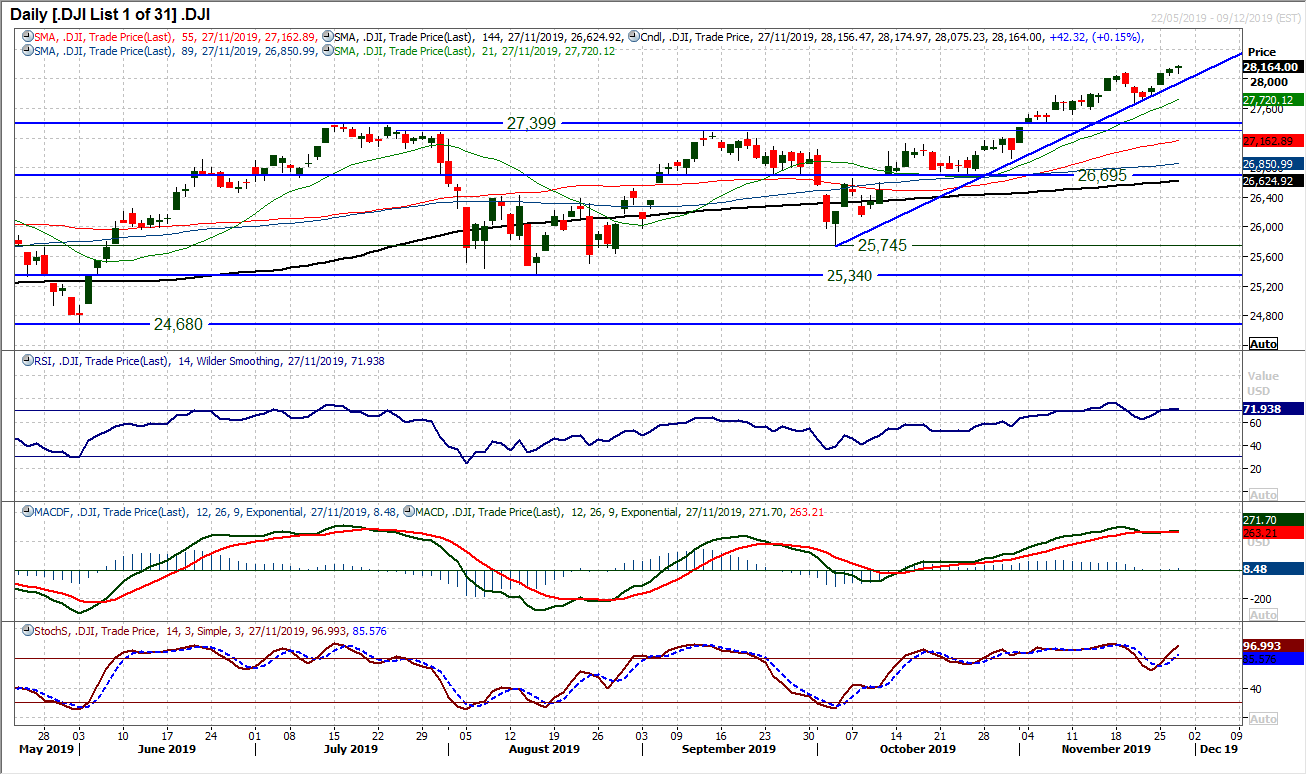
Wall Street was closed for Thanksgiving yesterday, however, on Wednesday, Dow finished another session in all-time high territory to leave the market in a strong position. Technically this is a strong outlook with the (slightly redrawn) eight week uptrend intact and momentum indicators positively configured. It will though be interesting to see how traders respond today as US futures are suggesting an early pullback amid a mild risk retreat. So watching the uptrend (at 27,990) will be the first test. There is key support of a higher low now at 27,675. We still see weakness as a chance to buy, but would be looking for confirmed support to do so.
"""DISCLAIMER: This report does not constitute personal investment advice, nor does it take into account the individual financial circumstances or objectives of the clients who receive it. All information and research produced by Hantec Markets is intended to be general in nature; it does not constitute a recommendation or offer for the purchase or sale of any financial instrument, nor should it be construed as such.
All of the views or suggestions within this report are those solely and exclusively of the author, and accurately reflect his personal views about any and all of the subject instruments and are presented to the best of the author’s knowledge. Any person relying on this report to undertake trading does so entirely at his/her own risk and Hantec Markets does not accept any liability. """
