Market Overview
There is a sense that major markets could be at near to medium term inflection point. Today’s meeting of the Federal Open Market Committee (FOMC) is expected to deliver a third consecutive rate cut. Since the Fed cut rates for the first time back in July, traders have pondered over whether these were just mid-cycle adjustment “insurance” cuts, or part of some greater easing cycle. How Fed chair Powell delivers the message today could be crucial for the medium term dollar outlook. Since the trade dispute started looking more positive, the dollar has been hit across majors, with improved risk appetite being dollar negative. Whilst the path towards an amicable resolution in the trade dispute is not assured, the Fed may still remain cautious. Yesterday’s third consecutive month of Consumer Confidence decline will be a worry for the Fed after a recent decline in retail sales. Major markets are at key near to medium term inflection points too. EUR/USD has drifted into $1.1060/$1.1100 support, whilst the dollar is also flirting at the key 109.00 resistance against the yen. Add in gold a shade above $1480 again and we could see some key outlook changing moves for the dollar should the Fed deliver a more upbeat message with its cut today. Are these just retracements in what looked to be a more dollar negative outlook, or is the dollar about to get a new lease of life? It is over to Jerome Powell.
Wall Street was cautious into the close last night with the S&P 500 ending the session a shade lower (-0.1%) at 3037. US futures are similarly cautious again today (-0.1%) all of which has added up to a slip away on Asian markets with the Nikkei (-0.6%) and Shanghai Composite (-0.5%). European markets are also following suit in early moves, with FTSE futures -0.1% and DAX futures -0.2%. In forex, USD is slipping back this morning in front of the Fed and continuing a theme of yesterday’s session. Broadly though, major forex is on hold ahead of the Fed. In commodities there is a similar feel of consolidation with gold +$1 and silver a shade positive. The oil is has been pressure in the past couple of sessions and is again a touch weaker today.
It is a huge data of data and announcements during the US session, but there will be an eye out for German inflation too with the implications it could have for the Eurozone. German HICP is at 1300GMT and is expected to slip to +0.8% (from +0.9% in September). On to US data, the ADP (NASDAQ:ADP) Employment change at 1215GMT is expected to drop further to 120,000 (from 135,000 in September) and this is an early outrider for the payrolls report on Friday. US Q3 growth is then the focus, with Advance GDP at 1230BST which is expected to show a decline to +1.6% (down from the +2.0% Final Q2 GDP). The Bank of Canada monetary policy is at 1400BST which is expected to see no change to the +1.75% rate again. EIA Crude Oil Inventories are at 1430GMT which are expected to show a very slight build of +0.7m barrels (after last week’s surprise drawdown of -1.7m). However, the main event of the day is undoubtedly the FOMC monetary policy decision at 1800GMT. The Fed is expected to cut the Fed Funds range for a third consecutive meeting by -25 basis points to +1.50%/+1.75% (from +1.75%/+2.00% in September). This is not a meeting for economic projections or dot plots, so the statement changes will be key and the message from Fed chair Powell during the press conference.
Chart of the Day – AUD/JPY
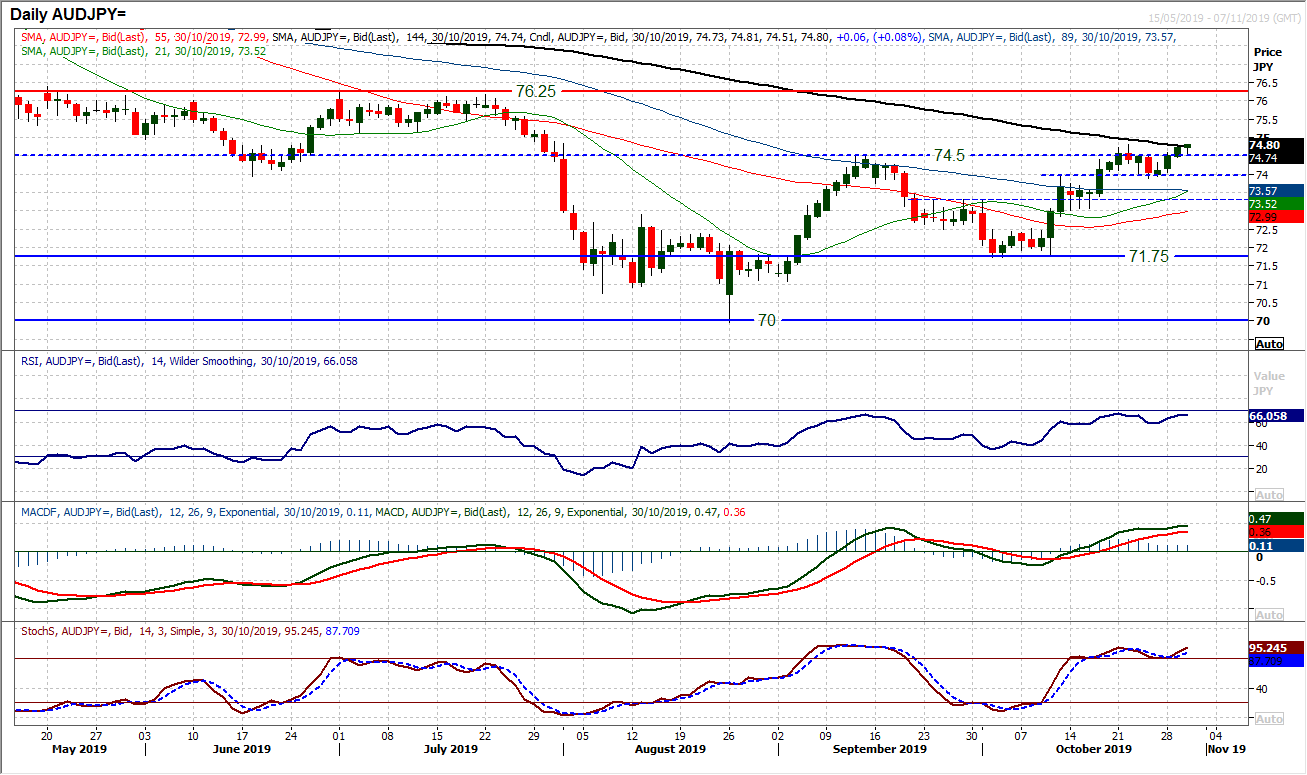
It does feel as though something is brewing on the Aussie. Better market risk appetite is a positive for the higher yielding, higher risk currencies and this is driving AUD/JPY to a breakout. A near three month closing high reflects this improved risk appetite. AUD/JPY closing decisively above the old September high at 74.50 continues the recovery of the past two months. It has also opened a pathway for the next resistance between 76.15/76.25. It is interesting to see momentum indicators decisively positively configured and backing the breakout, but also with further upside potential. The RSI is rising in the mid-60s, MACD lines rising above neutral and Stochastics swinging higher above 80. It all points towards using weakness as a chance to buy. The recent weeks have been characterised by old breakout levels being used as a basis of support. Last week the market bounced off the mini breakout at 73.95 (which was also an old June low) to propel the market to yesterday’s breakout. This means that there is now a decent support band 73.95/74.50 to use as a near term buy zone. A close clear of 74.82 would be the next step forward to test next resistance at 75.10/75.15 before the key July highs at 76.25.
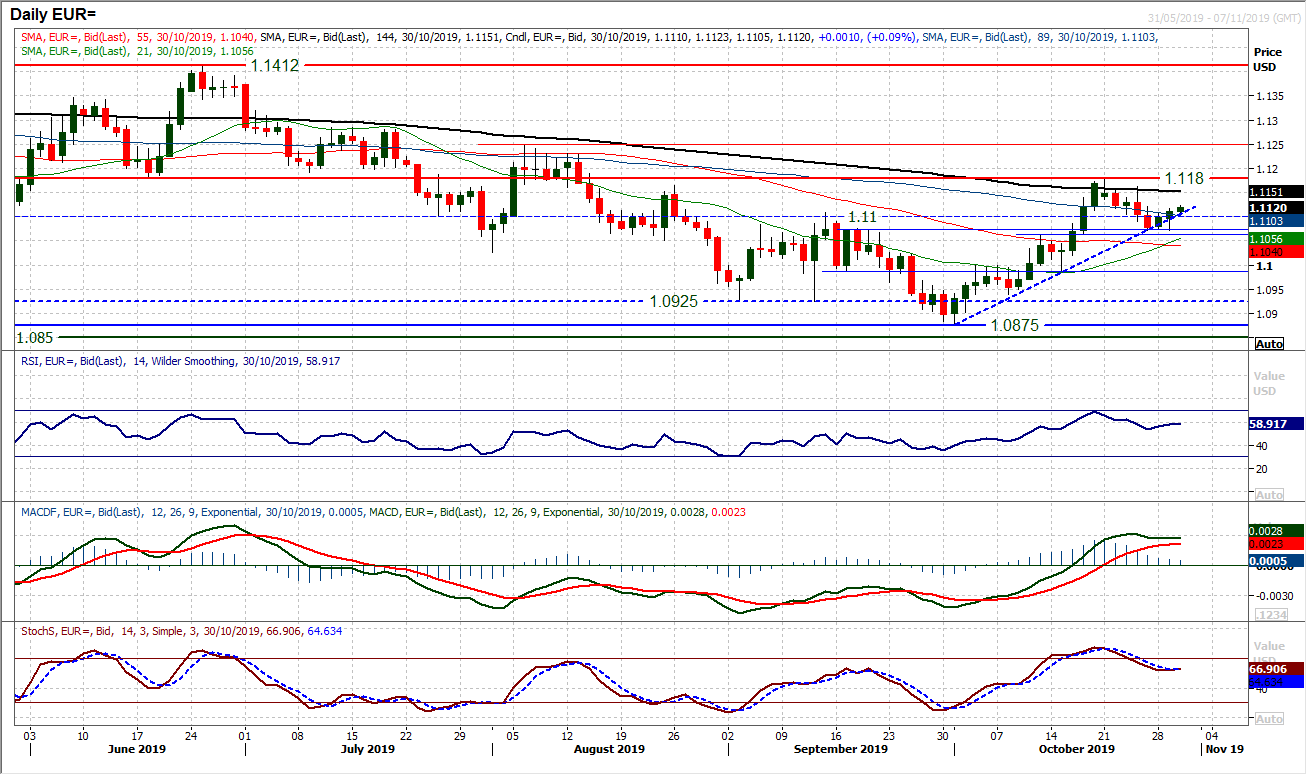
The correction on the euro has seriously tested the support of what is now a three week uptrend, however, not confirming a breach into the close leaves the bulls still in marginal control. The near term correction within the uptrend is now building from support. We have been discussing the importance of the breakout support band $1.1060/$1.1100. The band has been tested over recent sessions, but is holding firm. Although it comes after just a short phase of decline, yesterday’s bullish engulfing candle is also a sign that support is building well. Closing back above $1.1100, the bulls are in a decent position now going into the Fed meeting today. We have been concerned by sliding momentum in recent days, but with the market now forming two consecutive positive candles, there is a steadying of the Stochastics above 60, whilst MACD lines are holding well and the RSI is also steady above 50. One more, these are the building blocks for another bull leg. The importance of the support at $1.1060/$1.1070 is growing now as a failure on a closing basis from here would be a negative signal. The bulls will be eyeing resistance at $1.1160/$1.1180.
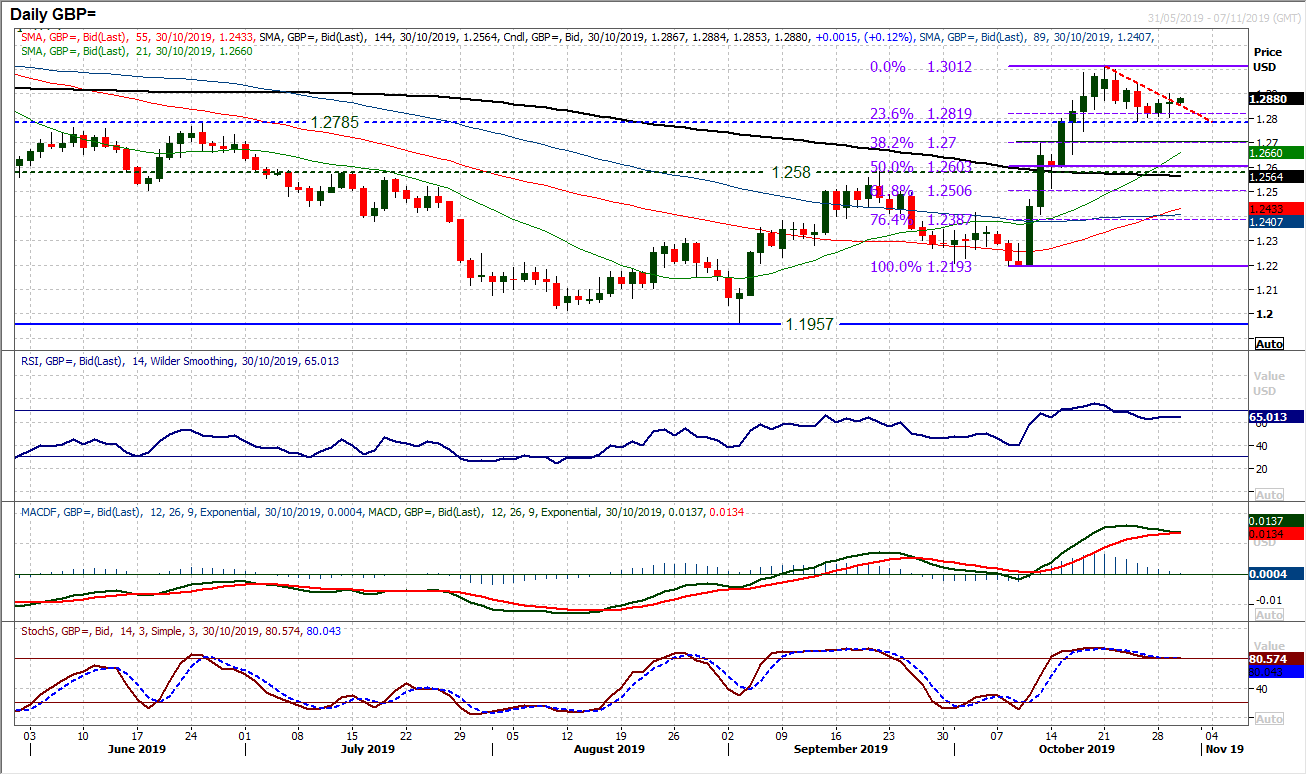
The corrective slide in Cable of the past week has just begun to steady. Whilst a UK General Election will have its political risk, at least it has the potential to provide some sort of end to the Brexit impasse. Cable has found support in the band $1.2785/$1.2820 in recent days. A small corrective downtrend is being breached this morning as a consolidation is taking hold. There certainly could be an element of uncertainty surrounding the FOMC today too, but for the first time in a few weeks, Cable seems to be settling down. Momentum indicators have rolled over but are not corrective and are reflective of the stabilisation in recent days. The importance of the support band between $1.2785 (old key June high) and $1.2820 (23.6% Fib retracement of the recent bull run) for the near term outlook is growing. Yesterday’s high at $1.2905 is initial resistance, whilst $1.2950 is a recent lower high under the key $1.3010.
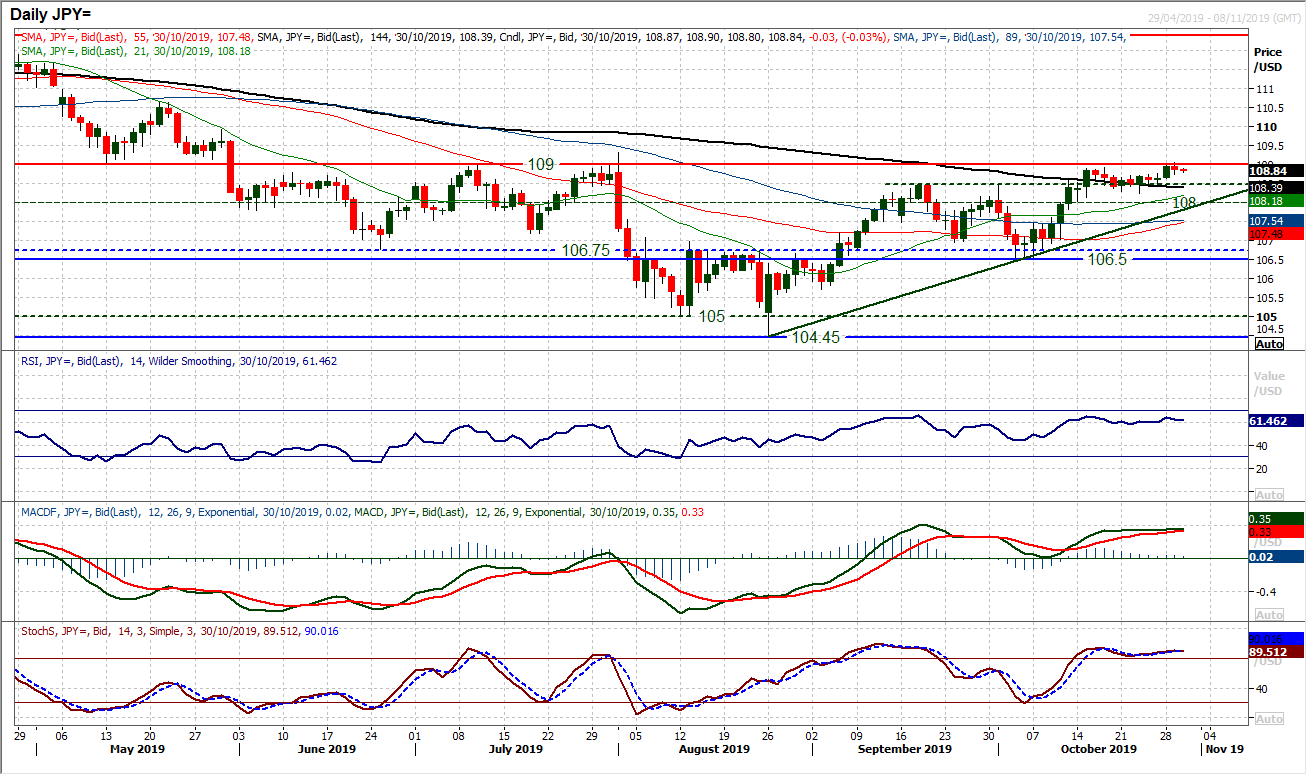
Coming into the Fed we see Dollar/Yen still flirting with the resistance at 109.00 but unable to break clear. This has been a key ceiling for months and whilst there is a positive bias to momentum, this remains a barrier to gains. The RSI has held above 60 for the past three weeks, whilst MACD and Stochastics are also ticking higher in positive configuration. The hourly chart also reflects the mild positive bias, with the hourly RSI consistently above 40 and pushing above 70, whilst the MACD lines are also consistently above neutral. We favour buying into weakness still as the bulls stand on the brink. The reticence could be in part due to the FOMC today, but if it is a hawkish cut from the Fed could be the catalyst for breakout. A decisive push above 109.00 would be a significant shift in the medium term outlook. It would open initial resistance at 109.90 and 110.65. Initial support at 108.50/108.65, with 108.25 key.
Gold
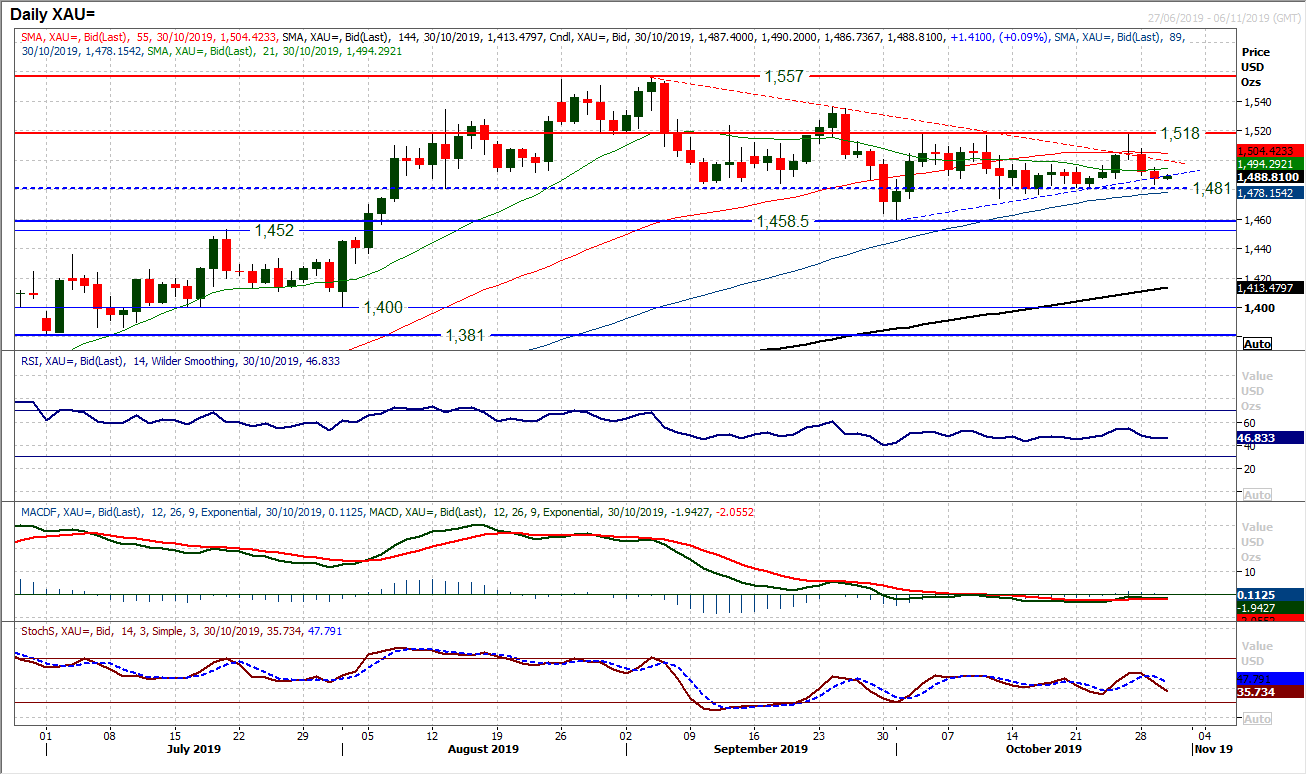
Gold is slipping back within the range once more, however essentially the market lacks decisive direction. The current drift lower is just a retracement of a previous move higher last week. The support has been firm around $1480 over recent weeks. The odd intraday breach (to $1474) but the market continues to hold $1480 into the close. Momentum indicators are showing almost no real direction. Although the sensitive Stochastics are marginally in decline, there is nothing to suggest on a technical basis, that there is about to be a decisive move. Trading back under $1500 lends a negative bias to trading within the range, with the hourly chart showing resistance $1495/$1500. The Fed could drive a breakdown tonight with positive guidance within the expected rate cut. A close below $1480 opens $1458 as a the key October low.
WTI Oil
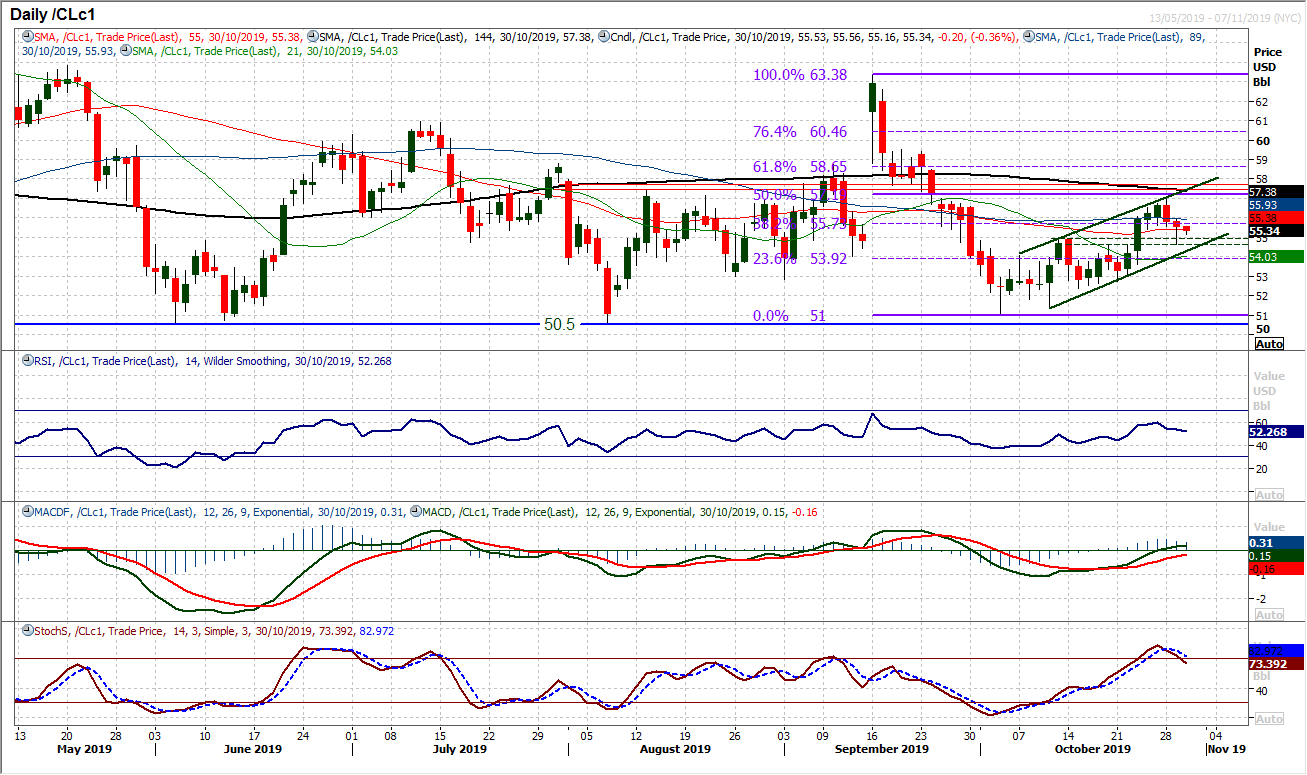
A recovery uptrend channel has developed over the past few weeks and we recently discussed the importance of the breakout supports holding in order to embolden the more positive outlook. Subsequently, the support band $54.60/$54.95 held almost to the tick yesterday as the market rebounded decisively from intraday weakness. This maintains the outlook of buying into weakness within the channel higher. However, the market is again drifting back lower this morning and once more this support band $54.60/$54.95 becomes key. Furthermore, the channel support rises into the support band in the next couple of days, so this confluence becomes increasingly important. Momentum indicators are also beginning to slip away, with this being (currently) a potential third negative session in a row. This is becoming a point at which support becomes crucial for the near to medium term recovery prospects. A close back above the 38.2% Fibonacci retracement at $55.75 would re-energise the bulls.
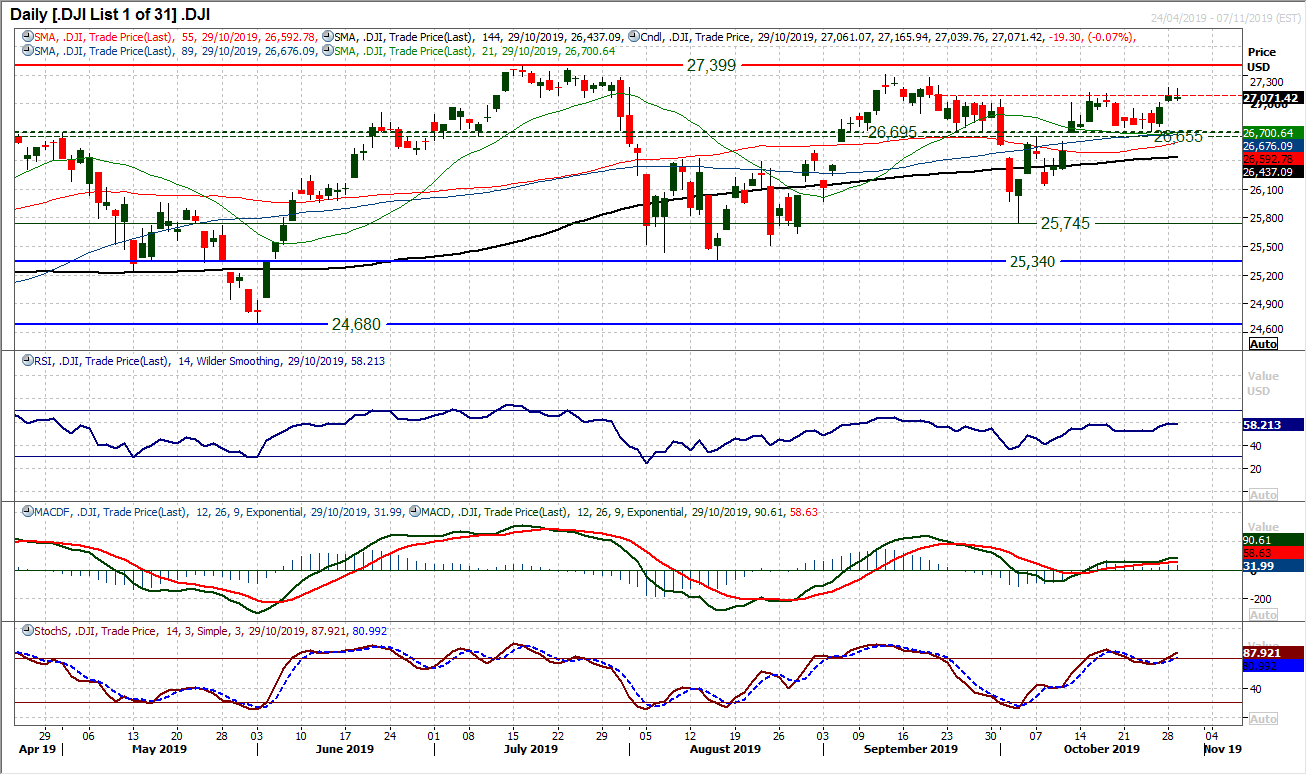
A day of consolidation has once more seen the Dow unable to break clear of the resistance band 27,040/27,120 which has restricted the market for the past five weeks. Another intraday attempt higher could not be sustained, although this is a move which effectively means the band of resistance is now extended to 27,040/27,165. Despite the market closing a shade lower on the day, there is still a positive bias to momentum indicators which would leave the bulls encouraged. The consolidation could be attributed in part at least to the imminent FOMC decision, but unless there is a surprise and the Fed does not cut rates, we continue to expect weakness to be bought into. The importance of the 26,655/26,695 support band grows by the day and whilst this remains intact the bulls will be in control. We expect a closing breakout above 27,165 in due course and a test of resistance 27,307 along with the all-time high at 27,399. Initial support today at 26,935/27,015.
"""DISCLAIMER: This report does not constitute personal investment advice, nor does it take into account the individual financial circumstances or objectives of the clients who receive it. All information and research produced by Hantec Markets is intended to be general in nature; it does not constitute a recommendation or offer for the purchase or sale of any financial instrument, nor should it be construed as such.
All of the views or suggestions within this report are those solely and exclusively of the author, and accurately reflect his personal views about any and all of the subject instruments and are presented to the best of the author’s knowledge. Any person relying on this report to undertake trading does so entirely at his/her own risk and Hantec Markets does not accept any liability. """
