Market Overview
There is an element of cautiously positive risk appetite just creeping back into markets this morning. The hope that the US and China can come together to sign up to “Phase One” of their agreement on trade took a step forward over the weekend as both sides talked up prospects. Agreements over respective poultry imports will help to pave the road, but the cancellation of the next phase of tariffs due in December would be a real boost for sentiment if agreed.
Talks continue on a vice ministerial basis and the APEC meeting in mid-November is still being eyed as a potential signing event. With volatility falling on equities (the Vix is at a three month low) and on Treasuries (also near a three month low), this should allow traders to look more towards higher risk currencies. The yen is the main underperformer moving into today’s session, whilst equities are also tentatively pushing higher. The EU is still set to announce its decision on another Brexit deadline extension (a three month extension is likely despite the protestations of French President Macron), whilst UK Prime Minister Johnson will try once more to get Parliament to agree to a General Election. Sterling as ever will be in focus as a result.
Wall Street closed solidly higher on Friday with the S&P 500 +0.4% whilst US futures are +0.2%. Asian markets have been positive early today, with the Nikkei +0.3% and Shanghai Composite +0.9%.In Europe there is a slightly more cautious look, with DAX Futures showing mild gains +0.1% whilst FTSE futures are -0.1%.
In forex, the theme of mild risk positive outlook is also present with JPY underperforming, whilst USD is mildly weaker against EUR and GBP.
In commodities, gold is holding still above $1500 but lost some of its recent bull traction, whilst oil is a shade lower after showing decent gains in recent days.
It is a quiet start to the week for the economic calendar. The US Trade Balance is at 12:3 0BST and is expected to see the deficit increase slightly to $73.5bn (from -$73.1bn in August).
Chart of the Day – EUR/CHF
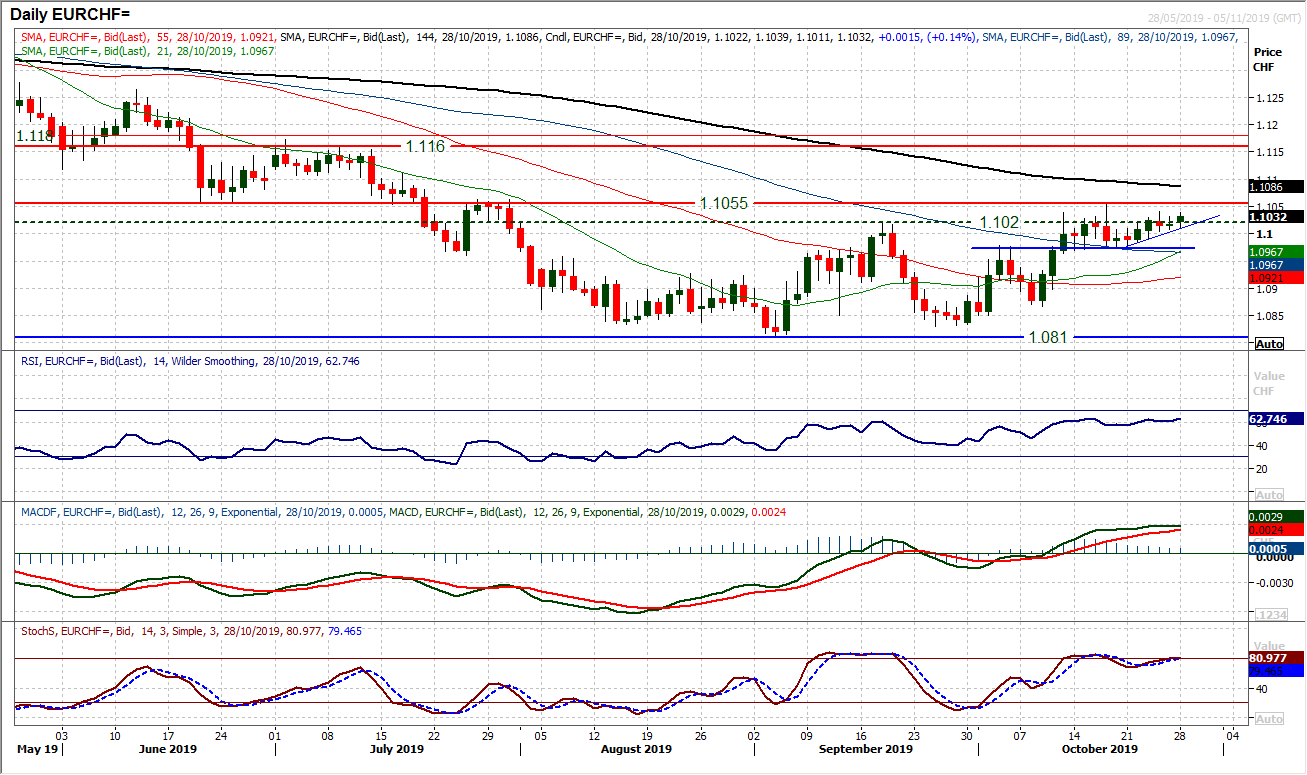
The market is still straining for a closing breakout above a key resistance band between 1.1020/1.1055 and although the bulls have been unable yet to make their move, they are increasingly well positioned. Holding above a near term pivot at 1.0980 as a basis of support in the past couple of weeks, near to medium term moving averages (21 and 55) are picking up decisively. Momentum indicators are increasingly positively configured, with the RSI consistently around 60 (an early move today has the RSI above 63 which is the highest since April), MACD lines rising at multi-month highs and Stochastics strong. With a move into the 1.1020/1.1055 resistance band, the bulls are testing higher. We look to use weakness to find support above 1.0980 as a chance to buy for what is a developing recovery. Increased conviction for this move would come with a decisive close above 1.1020 to be confirmed above 1.1055. This would all then open for a bigger medium term recovery (and suggest an ongoing risk improvement).
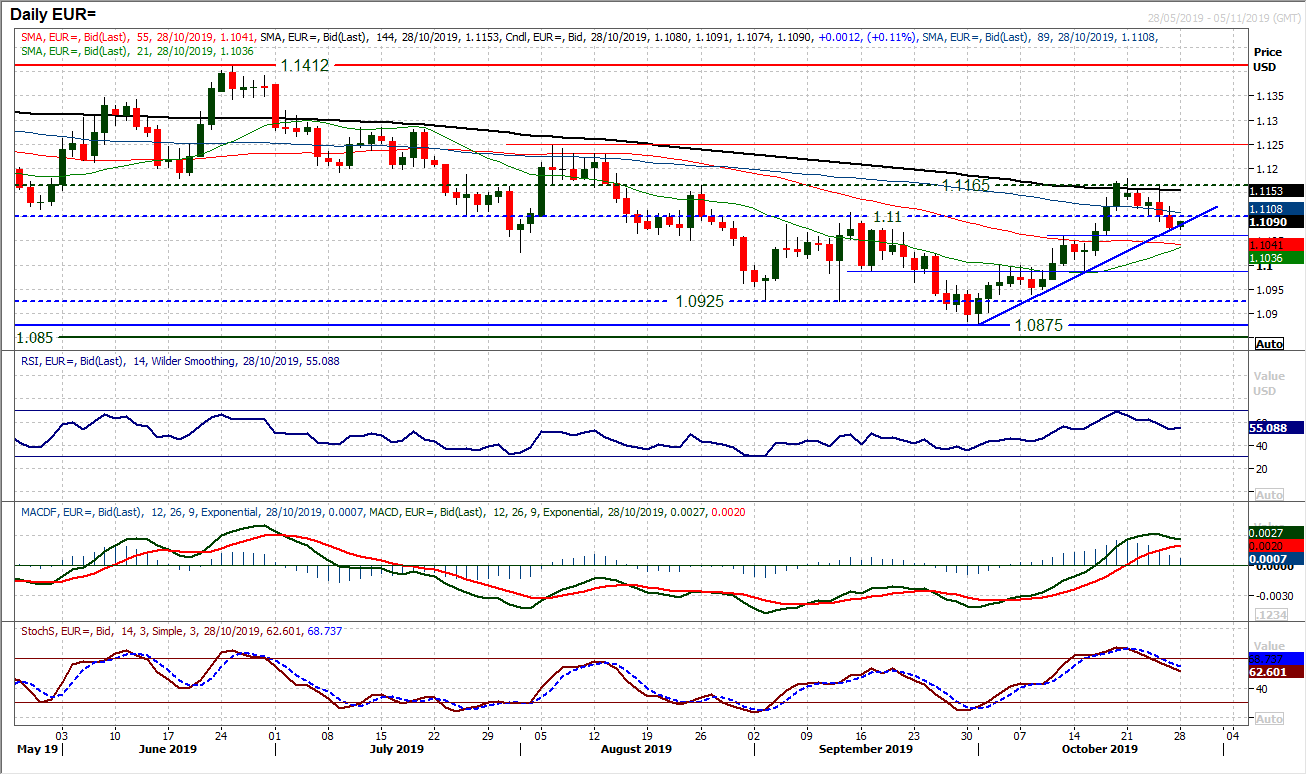
The rally on the euro has slipped away in the past week and is now at a key crossroads. How will the bulls respond to the correction? The uptrend of the past three weeks is being tested and the market is back below the $1.1100 breakout again. Support at $1.1060/$1.1075 is being tested and a closing breach would be a disappointment for the bulls. We are also looking at the RSI in the mid-50s, where a decisive drop under 50 would be another negative signal. The market is undoubtedly corrective on a near term basis, but is this enough to destroy the recovery? Hourly momentum reflects the corrective move and the bulls need to overcome resistance at $1.1090/$1.1120 to end a sequence of lower highs. A close under $1.1060 opens $1.0990.
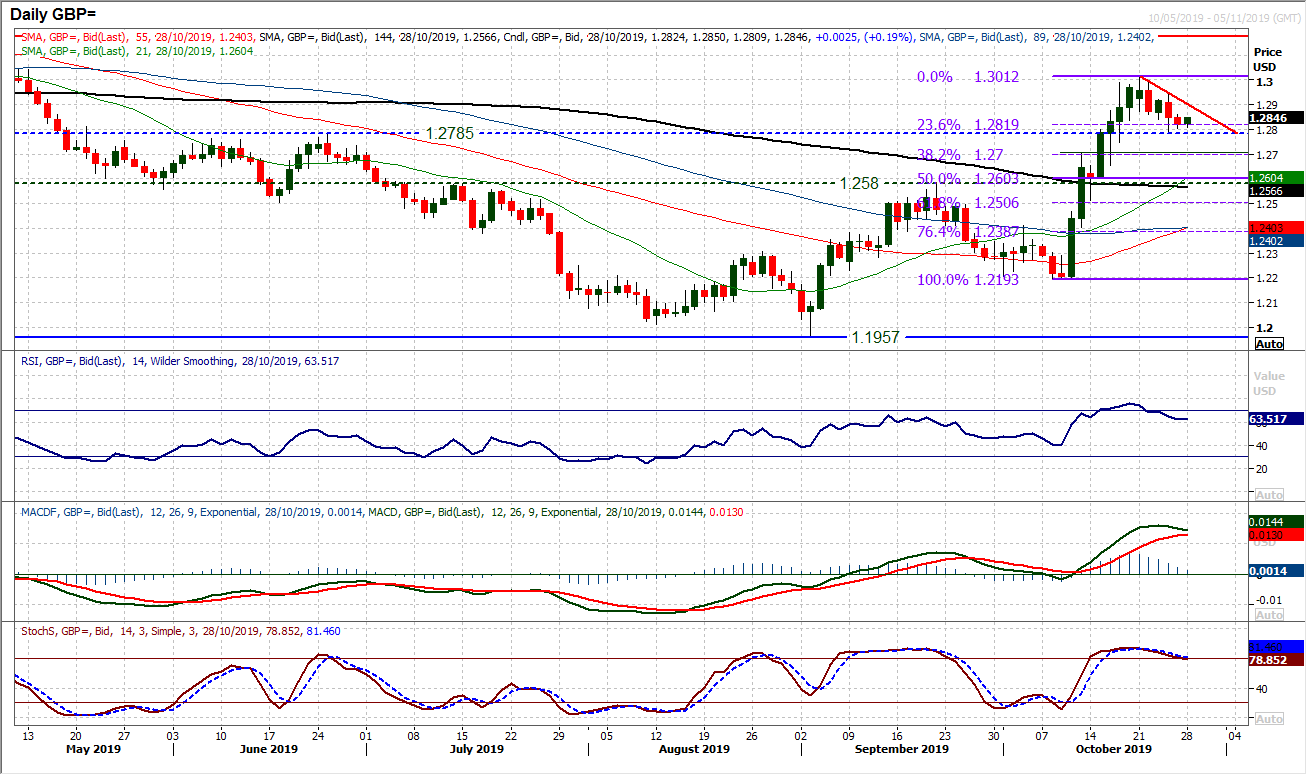
A negative drift on sterling has developed over the past week as a retracement from $1.3012 has set in. It is interesting that the selling momentum has not really taken off and this reflects what looks to be a cautious drift. Much of the caution is borne out of political uncertainty, but the configuration of recent candles has sterling rallies fading now. There is a band of support $1.2785 (an old breakout) and the 23.6% Fibonacci retracement (of $1.2195/$1.3010) around $1.2820. The decision of the EU-27 of how long to extend the Article 50 extension will be a key defining factor in how deep this correction could go. Technically, a closing breach of $1.2780 opens $1.2700 initially and then $1.2580. Initial resistance at $1.2865.
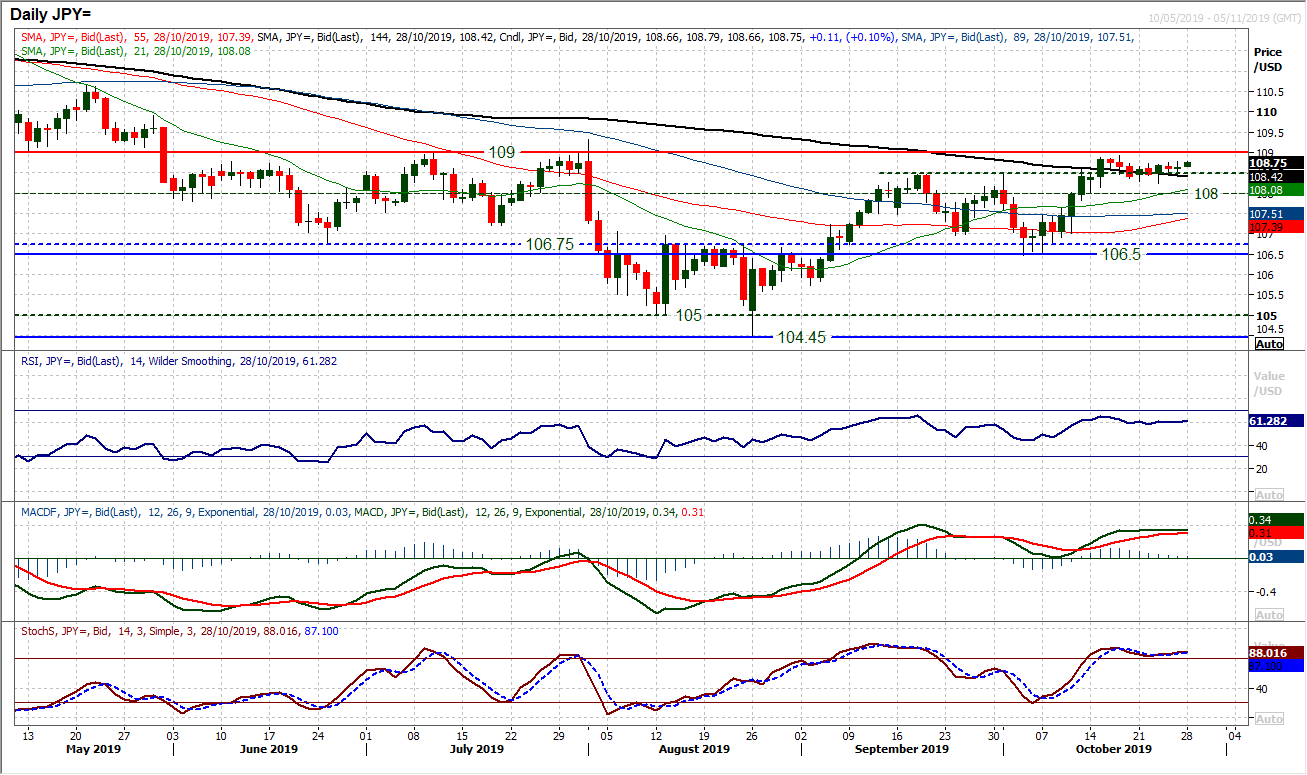
Dollar/Yen traders must be looking at the breakout on gold in the hope that something may be about to happen. However, for now the market is beset by uncertainty and lack of conviction. Yet another nothing candlestick on Friday means that the pair has now traded for the past eight sessions in a 70 pip range between 108.25/108.95. It is noticeable that Dollar/Yen does go through phases like this occasionally, as momentum indicators stagnate and the market lacks conviction. Essentially the outlook will remain in this position until either a break above 109.00 key pivot resistance, or below 108.00 (on the hourly chart a key support within the 106.50/109.00 range. A very slight tick higher today will have the bulls dreaming of breakouts but there is little reason to be overly keyed up until 109.00 is decisively breached.
Gold
A run of buying pressure for gold in recent sessions has seen the bulls put together a series of positive closes. However, a failure at the old $1518 resistance once more will have been a disappointment. How they respond now will be key. It is interesting to see that the $1500 psychological level held firm on Friday’s sharp pullback, before the bulls have seemingly looked to build again. This means that the seven week downtrend that did not see a confirmed breach on Friday, if once more under serious threat. Going on momentum indicators, there is a growing sense that the bulls are massing now. The RSI is holding consistently in the mid-50s and at four week highs, which suggests a sustainable test of $1518 is coming. Stochastics and MACD lines ticking higher is also reflective of this. The hourly chart shows positively configured momentum with hourly RSI above 40 and MACD lines above neutral. Intraday weakness is increasingly a chance to buy. A closing break above $1518 opens $1536 as the next resistance. Support is in place now between $1497/$1500.
WTI Oil
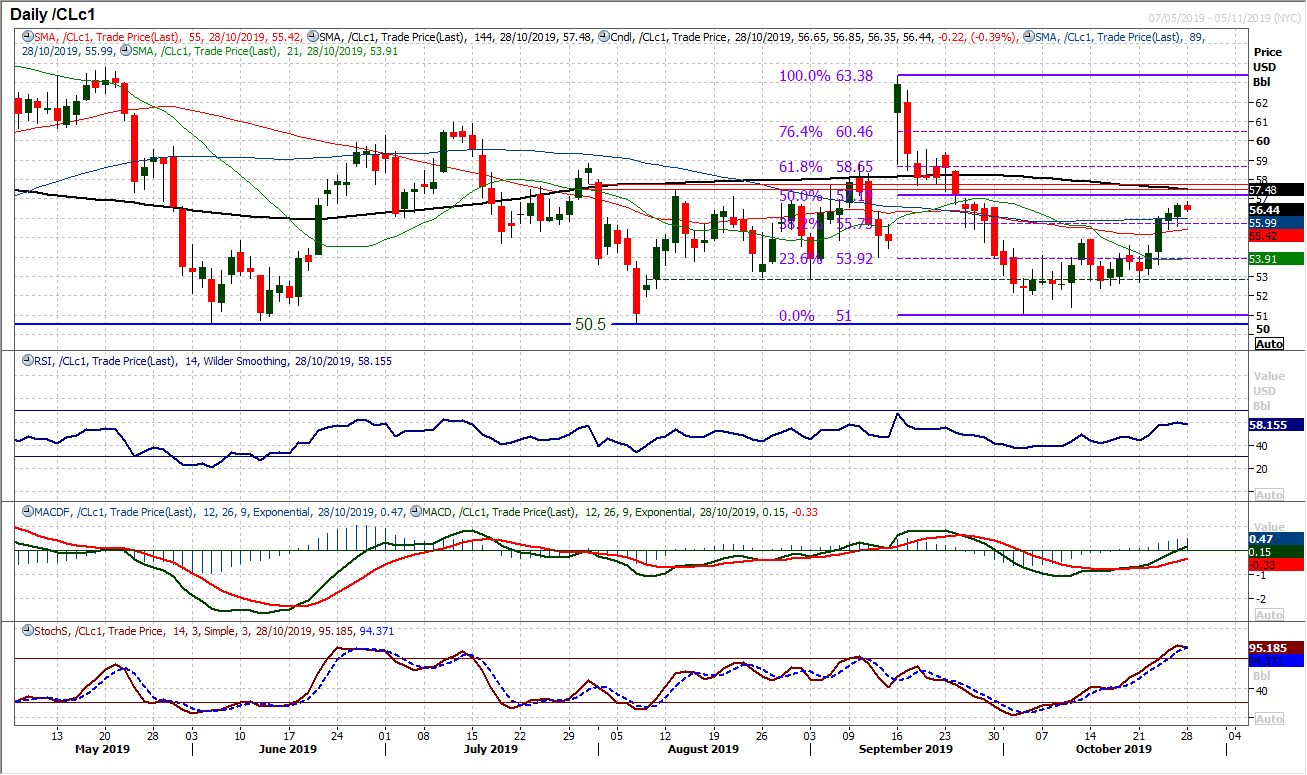
During Friday’s session it had looked as though the bulls were just losing some conviction in the recovery, but a strong showing into the close means that four positive loses and four positive candles in a row now. The fact that the bulls continue to hold on to the breakout above $54.95 maintains the improving outlook. The market is now trading clear of the 38.2% Fibonacci retracement (of $63.40/$51.00) at $55.75 and this now opens 50% Fib at $57.20 as a next target area. With momentum indicators steadily improving this suggests that corrections will be seen as a chance to buy. The 38.2% Fib level at $57.20 is now supportive.
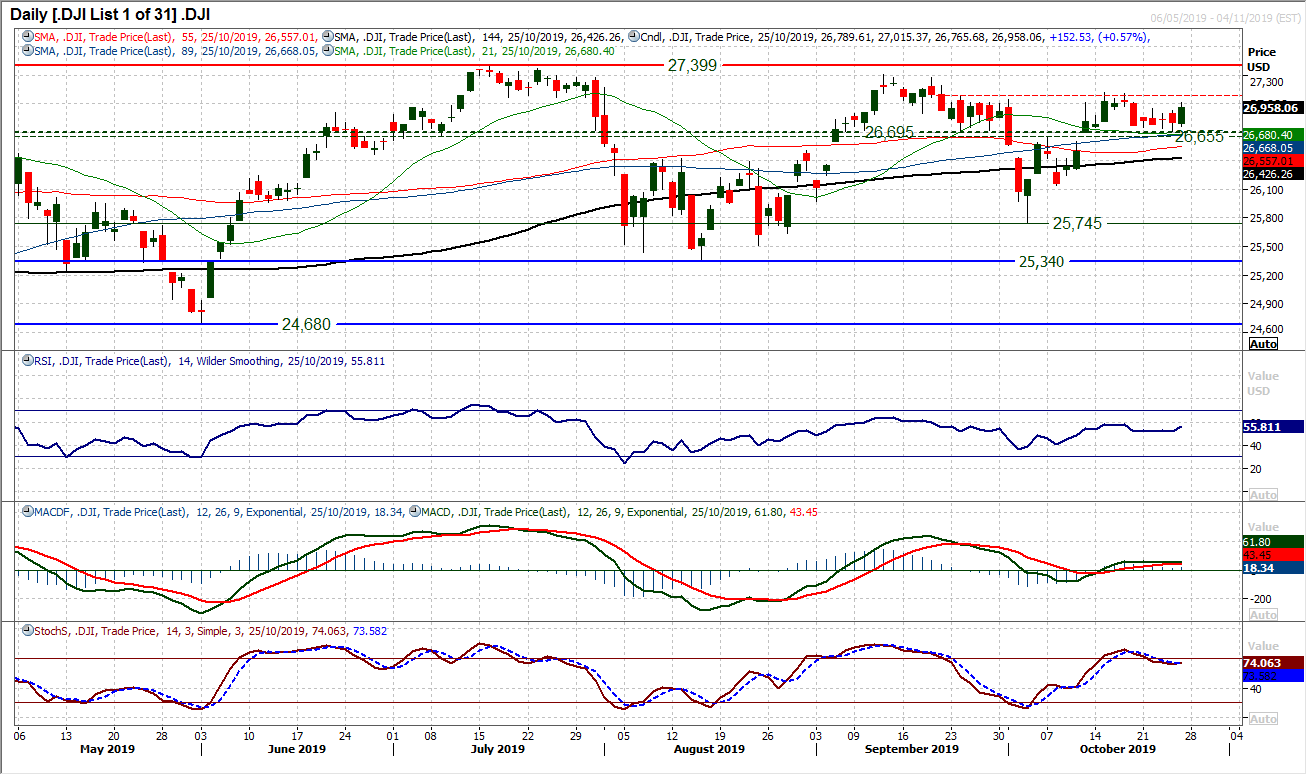
After a run of mixed to negative candlesticks over the past week, the Dow bulls have found a degree of traction to hold on to intraday gains and form a solid positive session. The test is now whether the groundwork can be built upon to derive some sort of breakout. The resistance band at 27,040/27,120 is the key barrier overhead now, having restricted the bulls for the past month. However, momentum is still cautious as daily signals suggest there is some way to go to convince, but finally some glint of light nonetheless. The hourly chart is similar, with an improvement, but nothing of conviction yet. That would come above 27,120. The bulls will point to the strengthening of support between what is now a band 26,655/26,715.
DISCLAIMER: This report does not constitute personal investment advice, nor does it take into account the individual financial circumstances or objectives of the clients who receive it. All information and research produced by Hantec Markets is intended to be general in nature; it does not constitute a recommendation or offer for the purchase or sale of any financial instrument, nor should it be construed as such.
All of the views or suggestions within this report are those solely and exclusively of the author, and accurately reflect his personal views about any and all of the subject instruments and are presented to the best of the author’s knowledge. Any person relying on this report to undertake trading does so entirely at his/her own risk and Hantec Markets does not accept any liability.
