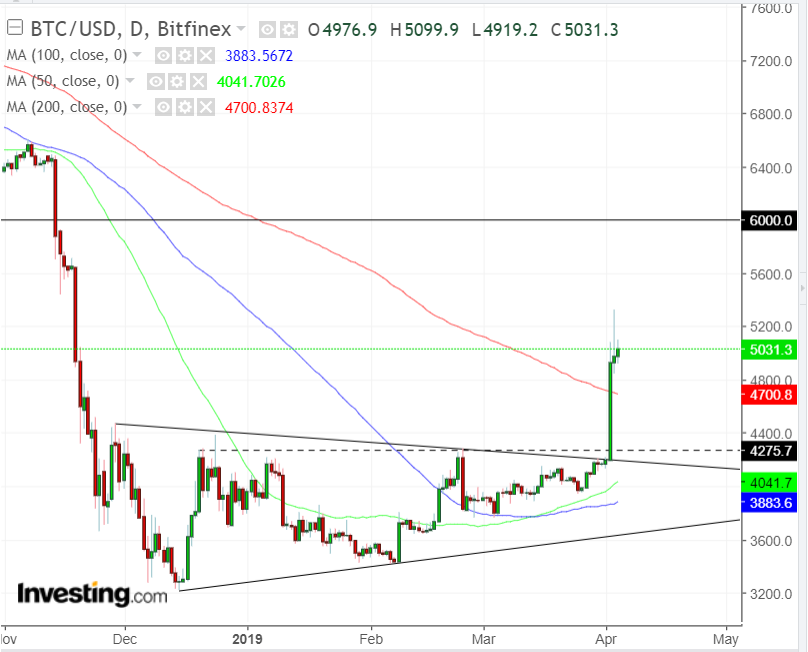
After what seemed like an endless coma, Bitcoin suddenly surged a mind-boggling 17.4% on Tuesday, slicing through its 200 DMA as if that key metric wasn’t even there. It was the digital currency's biggest jump since the cryptocurrency go-go days of late 2017.
Yesterday, the most popular digital currency by market cap extended the advance by as much as 6% and ended the session up 2.3% at $4968.7. What's driving the unexpected advance is unknown and perhaps there is no hidden catalyst either.
The digital asset is overwhelmingly traded by retail traders. It's famous for its volatility, with sudden ups and downs triggered by nothing more than rumors and random moves that snowballed. Bitcoin has stopped the hearts of many traders, both on the way up to $20,000 in December 2017, and on the way down to the $3,000 levels, where it had been languishing till Tuesday’s breakout.
What traders really want to know is whether something is stirring, prompting those in the know to scoop up contracts before they return to what crypto aficionados consider a balanced value. While we don't know if that's the case, we can attempt to weigh the likelihood of a reversal and advise on how to manage the trade for a favorable risk-reward ratio.
The price did, in fact, complete a bottom, in the shape of a symmetrical triangle. That means that since November 2018 and until the breakout, supply and demand were at an impasse. The breakout, however, demonstrated a shift in that dynamic. Such flips tend to turn into transformations, as those who were wrong join the victors, and those who were right increase their positions.
However, even if the price has indeed bottomed, traders could still end up with a loss if they enter half-cocked. While the price advanced for the fourth straight day, Wednesday’s jump closed far off its high. This was forming a potential shooting star, as the price eyed the $6,000 level, presumed resistance stemmed by the lows of much of 2018.
As such, we’d urge patience. Wait for a pullback, even at the risk of losing this move.
Trade Strategies
Conservative traders should wait for a complete return move to the triangle at the low $4000 levels and look for the bounce that would confirm the pattern’s support, with at least one long, green candle engulfing a red or small candle of either color.
Moderate traders might wait for the pullback for a better entry but might forego waiting for trend confirmation.
Aggressive traders may enter a contrarian short position, if the price nears yesterday’s $5,330 highs.
Trade Sample
- Entry: $5,300
- Stop-Loss: $5,350
- Risk: $50
- Target: $5,000
- Reward: $300
- Risk-Reward Ratio: 1:6

