Market Overview
There has been a rather muted start to what could be another crucial trading week. In the coming days top officials from the US and China will meet in Washington to negotiate a potential trade deal. However, the tier one data out of the US is joining the deterioration across other major economies is shaping sentiment once more. It also shows the importance of securing a deal is growing, to prevent sustained economic deterioration in the US. A global economic slowdown is accelerating and the trade dispute between the world’s two largest economies is a major factor. Prospects of an agreement between the US and China are still not great, even as President Trump has tried to talk them up in recent days.
Friday’s mixed jobs report for the US may have not reflected the manufacturing sector slowdown leaking across the broader economy as had been feared (after the ISM data). However, traders will know that unless there is a deal between the US and China, it will only be a matter of time before it does. So traders are circumspect this morning. Add in another whistleblower to come forward in the President Trump impeachment story and there is further risk aversion for traders to factor in. This is helping the performance of safer haven assets, with the yen and gold supported today. On the Brexit front, there are dwindling prospects for a rehashed deal meaning there is renewed negative pressure creeping in for sterling again this morning.
On Wall Street there was a considerable rebound into the close, with the S&P 500 +1.4% at 2952. However, US futures have slipped back early today, currently around -0.4% lower, which has weighed on Asian markets with the Nikkei -0.2%. In Europe there is a mixed start to trading, with FTSE Futures a tick lower, and DAX Futures +0.2%.
In forex, there is little direction on USD, whilst GBP is marginally weaker and AUD also lower.
In commodities, the risk aversion is lending a degree of support to gold today although little real direction, whilst oil is also around the flat line.
There are no major events on the economic calendar today.
Chart of the Day – NZD/USD
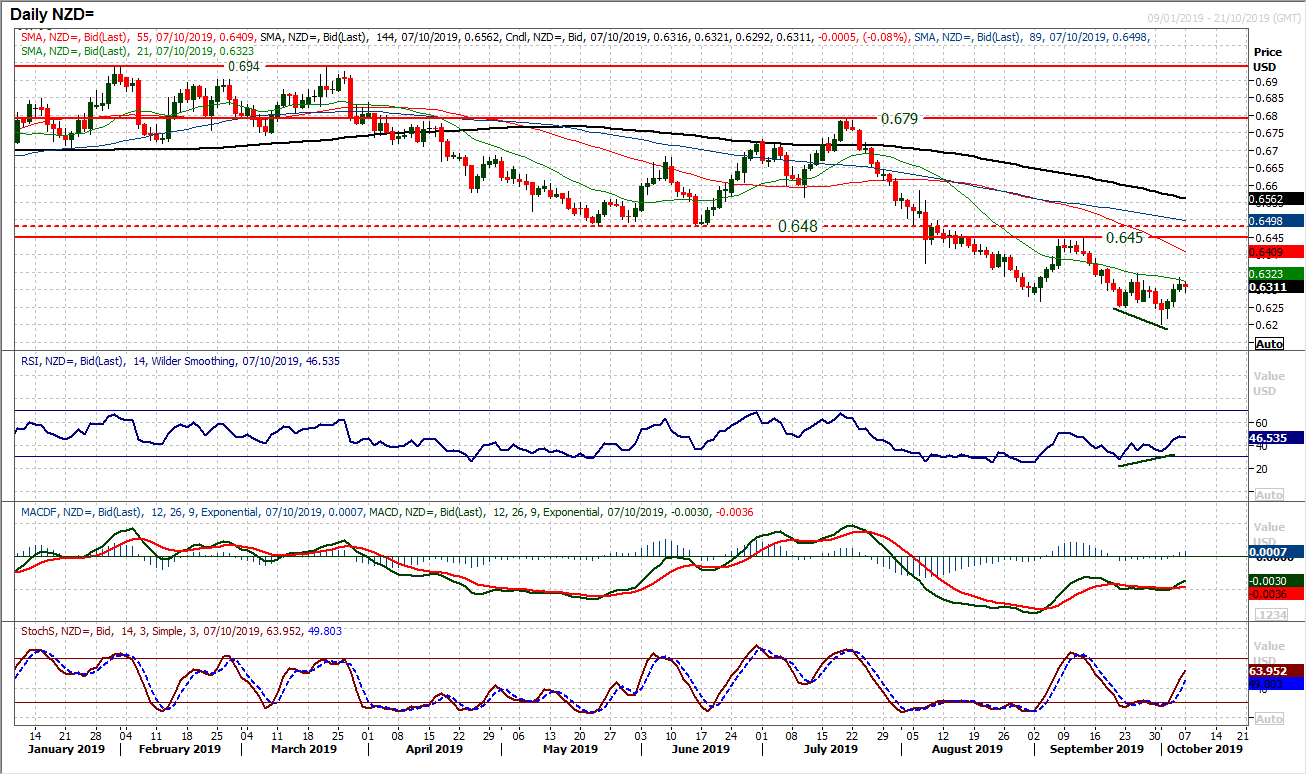
With three successive positive sessions, the Kiwi is threatening a recovery. The technical indicators would certainly support one too. There is a bullish divergence with a failure swing on RSI, along with a buy signal on Stochastics and even positive traction on MACD lines. This comes as the market is pushing to test the first importance resistance in the rebound at $0.6350. A small base pattern would complete above $0.6350 to imply c. 100 pips of further recovery. Interestingly that would bring NZD/USD exactly back to the key September high at $0.6450. Watch for the RSI moving above 50 which would be a ten week high and would suggest a change in outlook where at least on a near term basis, weakness is a chance to buy. This is reflected on the hourly chart which shows a growing run of higher lows leaving support in the band $0.6270/$0.6300. Under $0.6250 would abort the recovery prospects.
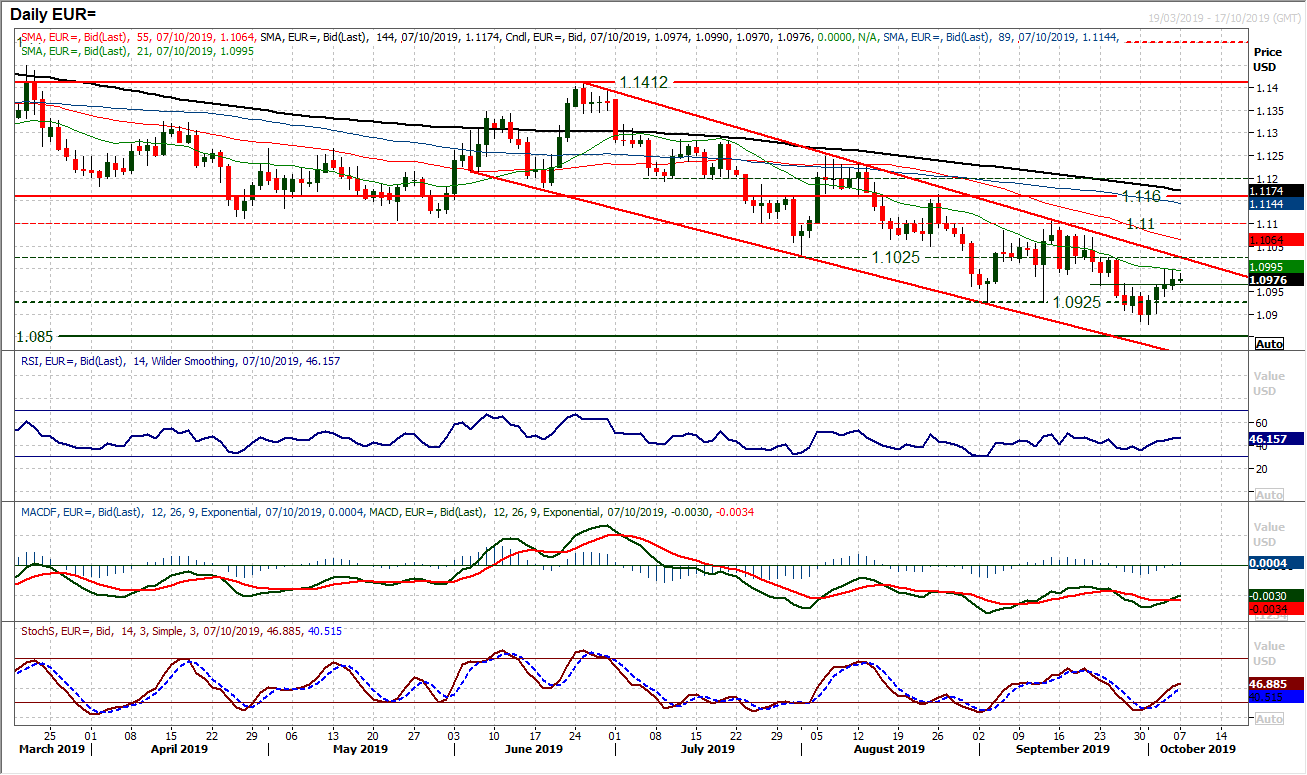
The euro has now gained ground over the past four sessions, something we have not seen on EUR/USD since June when the downtrend channel began. For now we have to still see this rebound in the context of what is now a 15 week downtrend. How the bulls respond to any renewed selling pressure will be important too. In the past week there has been a fairly steady recovery, but if the sellers look upon the first sign of selling pressure and press the panic button, the market could quickly be back around the $1.0875 low again. Momentum remains negatively configured under 50 and until this is breached then the rebound will still struggle for traction. Perhaps this is the source of the last couple of sessions where the market has closed off the highs. There is resistance with the $1.1025 old low which is a confluence with the trend channel resistance now. Closing back under $1.0965 would be a test for the bulls now to see how strong they really are.
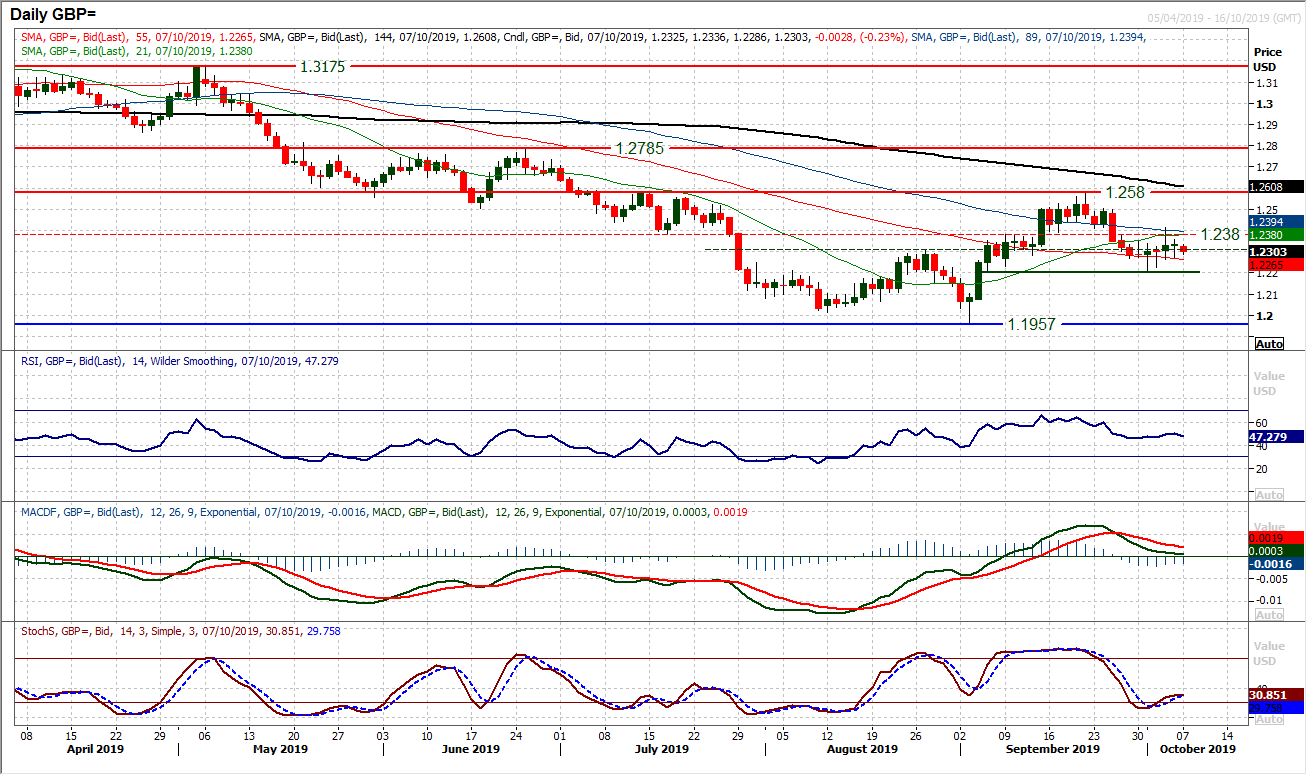
Cable is becoming a market that has lost its conviction. We discussed previously about the small bodies of the candlesticks making for an indecisive market. This was shown once more on Friday with a doji candlestick, whilst early moves today continue to reflect a market lacking any conviction. Momentum indicators have flattened, with the RSI and MACD around their neutral points adding to the increasingly neutralised market. We continue to see resistance at the old $1.2380 pivot, with support now initially at $1.2270 above the $1.2205 low. Traders are keeping their powder dry for now. Watch for newsflow on Brexit this week, in addition to the trade dispute to be key catalysts.
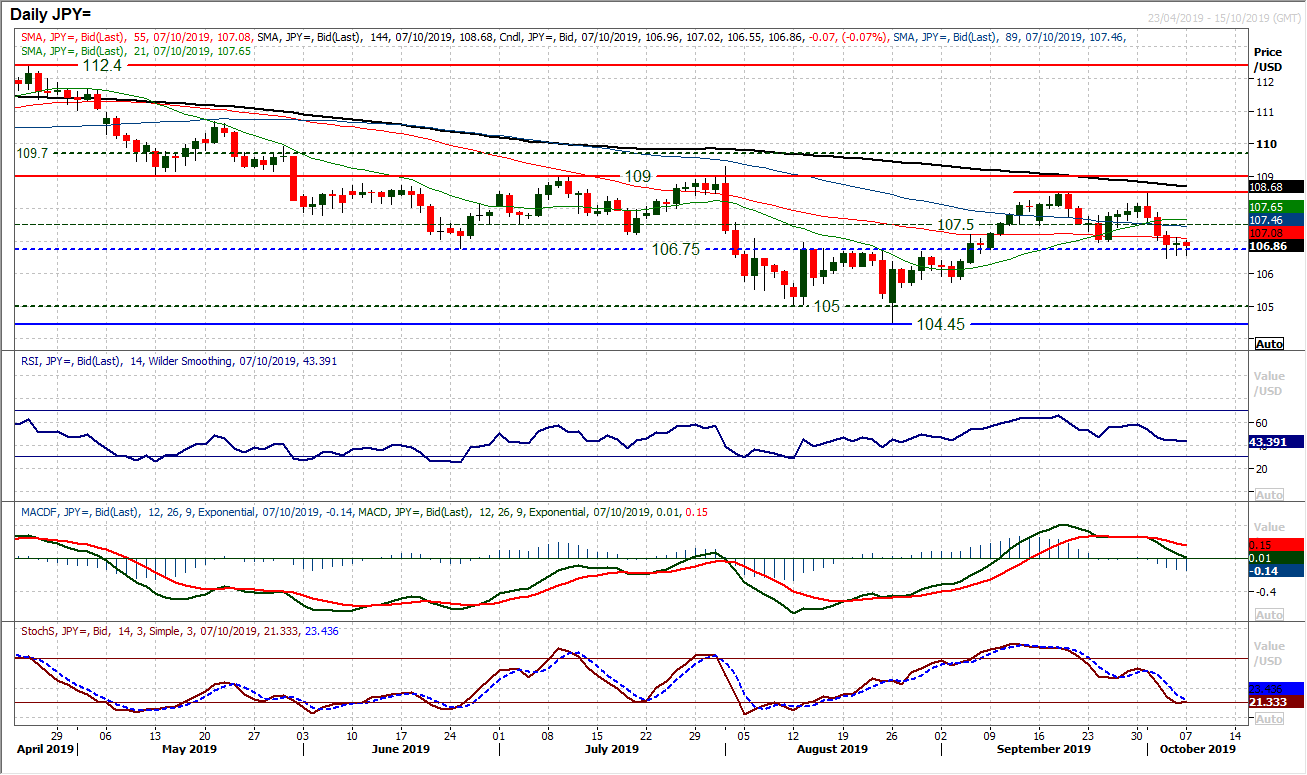
A rather mixed look to the payrolls report on Friday has done little to change the outlook on USD/JPY. A run of negative candlesticks in recent sessions may have stalled slightly, but a breakdown below 106.95 is confirming with another closing breach of support. This completes a top that implies a further -150 pips of downside towards the 105.50 area now. Given the significant deterioration across momentum indicators, intraday rallies should be seen as a chance to sell. The RSI holding under 50, along with the MACD lines accelerating lower and negative configuration on Stochastics reflect this. A close under 106.75 (the neckline of the old base pattern) would begin to add traction to the deterioration. Subsequent support comes in at 105.70. The hourly chart shows resistance in the band 106.95/107.30 as an intraday sell zone. There is further resistance 107.40/107.90.
Gold
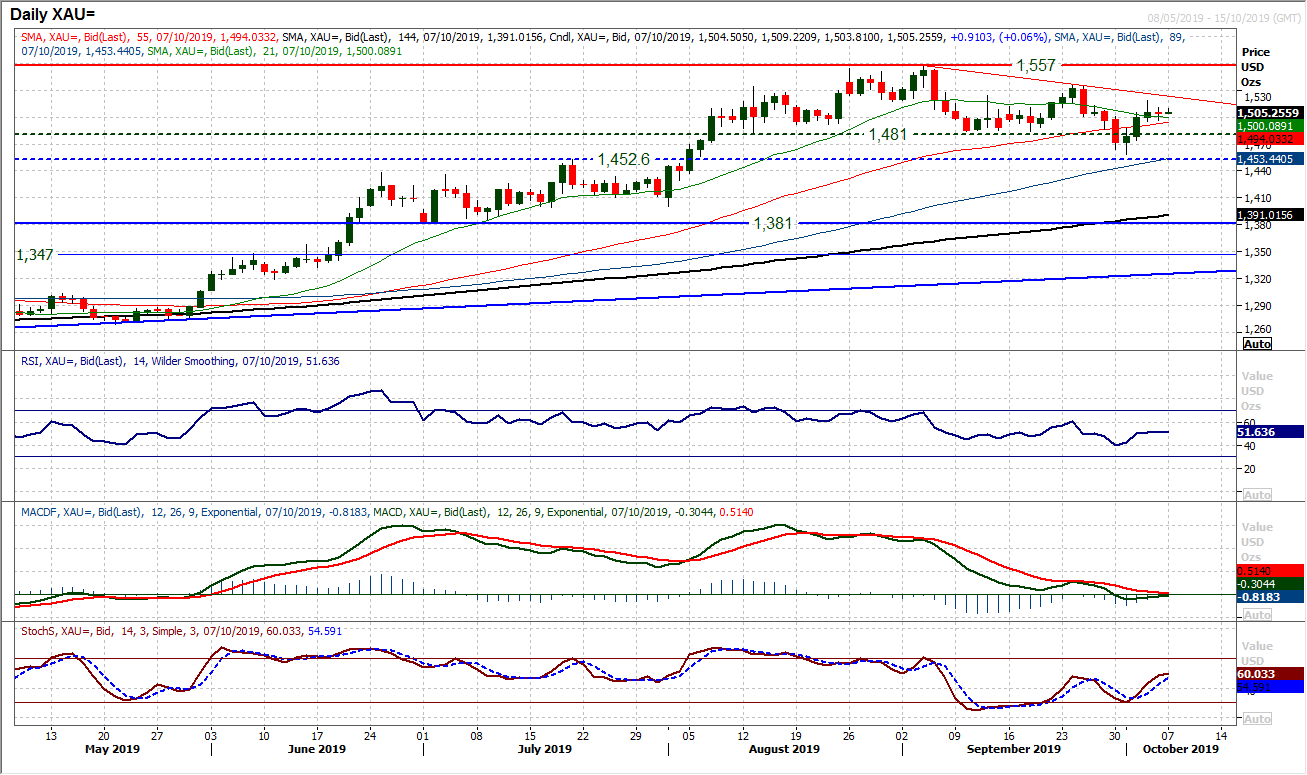
The outlook for gold is at an important crossroads again. We have been looking upon the rebound of recent sessions with a degree of caution. A bull failure would have taken the opportunity to sell in Friday’s payrolls report, but the market has stalled again. Friday’s doji candle reflects a mixed outlook lacking conviction. The fact that the market has not instantly rolled over having turned back from last week’s high of $1518.50, would suggest that there is some backing to the recovery. However, we see momentum indicators which have become increasingly neutral once more on both daily and hourly charts, where by the RSI and MACD lines are gravitating to neutral on both time horizons. A multi-week top pattern has not been entirely dispelled but the market is now holding above all the daily moving averages again. There are a range of mixed signals on gold to sift through but the bulls will be looking at the resistance at $1518.50 and a one month downtrend (at $1523 today). There is also a growing importance of support $1495/$1497 that the sellers need to breach.
WTI Oil
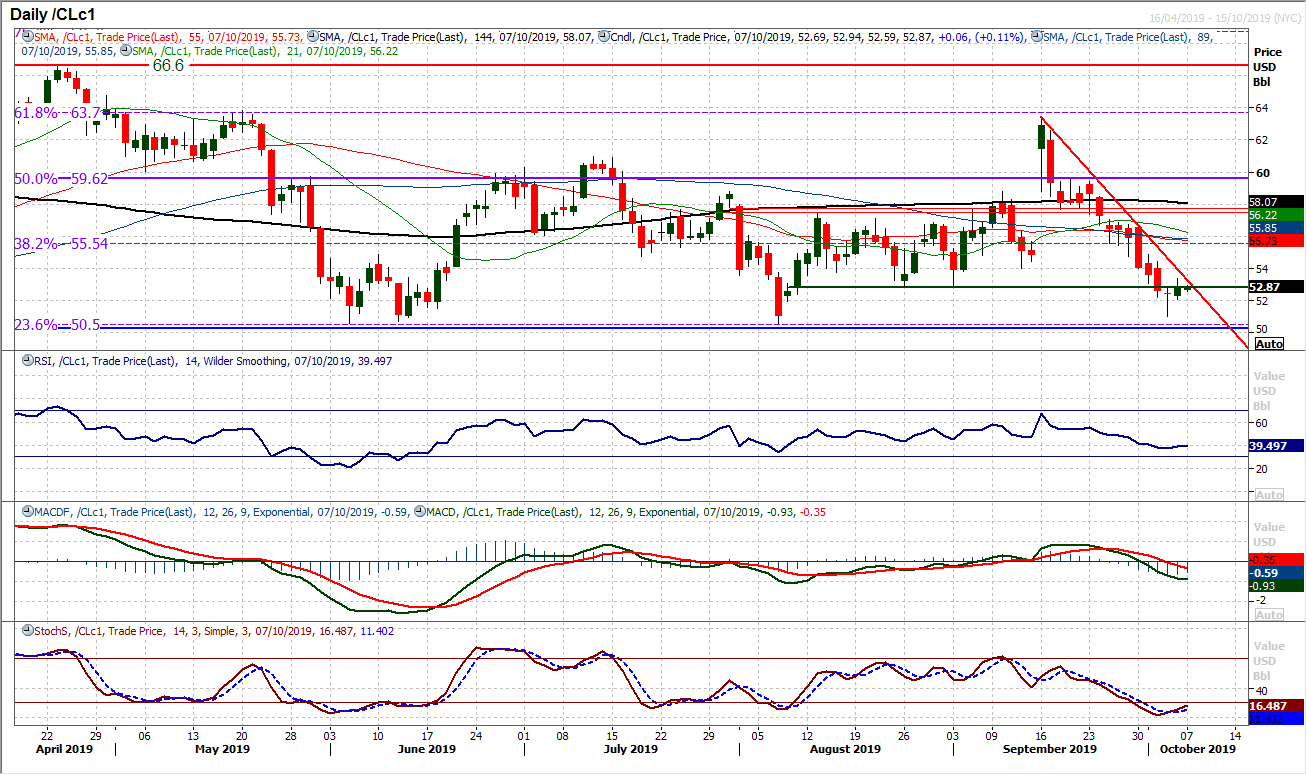
The momentum of the sell-off has dissipated as the run of losses has been curbed. A long lower shadowed doji reflects uncertainty in the decline, whilst the sharp three week downtrend is now being retested. Interestingly this comes as the market is testing the resistance of the old low at $52.85. It seems that this is a near term crossroads for WTI. A tick higher on Stochastics is not yet confirmed as a buy signal, but momentum looks to be tempering. It is interesting to see this slowing sell-off coming as the key floor at $50.50 has again held firm (last week’s low at $51.00). We need to see if this is the beginnings of a recovery again which has repeatedly come throughout 2019 in this area. A close back above $54.00 would confirm.
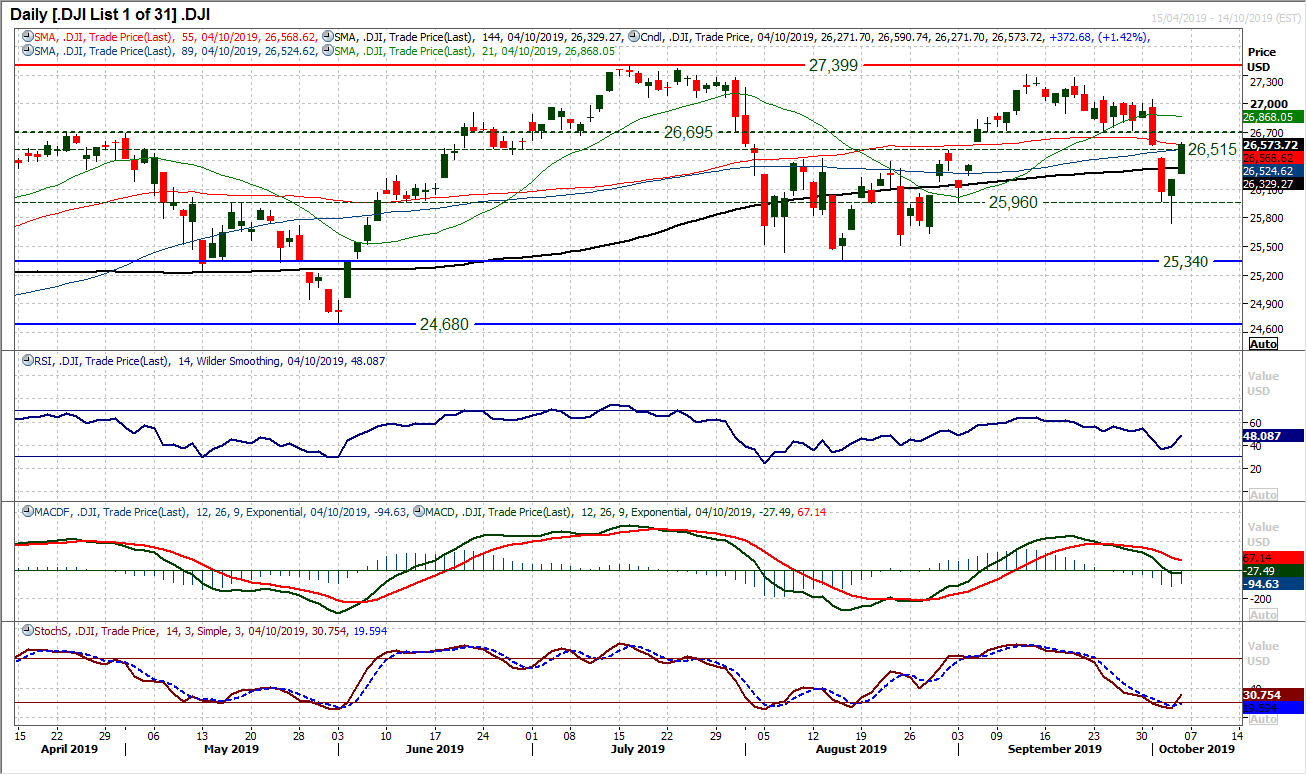
Near term volatility shows little sign of abating on the Dow as a second strong positive candlestick on Friday has helped to unwind previous losses. Effectively, in closing the downside gap at 26,562 the bulls are moving to negate the negative implications of last week’s loss of 26,705 support. With momentum indicators swinging higher (Stochastics especially) there is a moving towards near term positivity again. A close back above 26,705 in today’s session would be a further step in the resurgence of the bulls. However, there is another gap that has been left open at 26,205 which theoretically needs to be filled.
"""DISCLAIMER: This report does not constitute personal investment advice, nor does it take into account the individual financial circumstances or objectives of the clients who receive it. All information and research produced by Hantec Markets is intended to be general in nature; it does not constitute a recommendation or offer for the purchase or sale of any financial instrument, nor should it be construed as such.
All of the views or suggestions within this report are those solely and exclusively of the author, and accurately reflect his personal views about any and all of the subject instruments and are presented to the best of the author’s knowledge. Any person relying on this report to undertake trading does so entirely at his/her own risk and Hantec Markets does not accept any liability. """
