Binance is one of the largest cryptocurrency exchanges globally, providing a platform for trading a wide variety of digital assets.
Founded in 2017 by Changpeng Zhao, Binance has quickly grown to become a major player in the cryptocurrency industry due to its extensive range of services, including spot trading, futures trading, staking, lending, and more. The exchange is known for its low transaction fees, robust security measures, and a user-friendly interface that appeals to both novice and experienced traders.
Relevant News and Updates
As of May 2024, Binance continues to expand its services and regulatory compliance globally. Recent news highlights include:
- Regulatory Approvals: Binance has been actively seeking regulatory approvals in various jurisdictions to enhance its global presence. The exchange recently secured licenses in several European countries, bolstering its legitimacy and user trust.
- Product Expansion: Binance has introduced new financial products and services, including advanced trading features and integration with DeFi platforms, aimed at attracting a broader user base.
- Security Enhancements: Following a few high-profile security breaches in the industry, Binance has further strengthened its security protocols to protect user funds and data.
What I'm looking at: Technical Analysis- Bullish Breakout Pattern
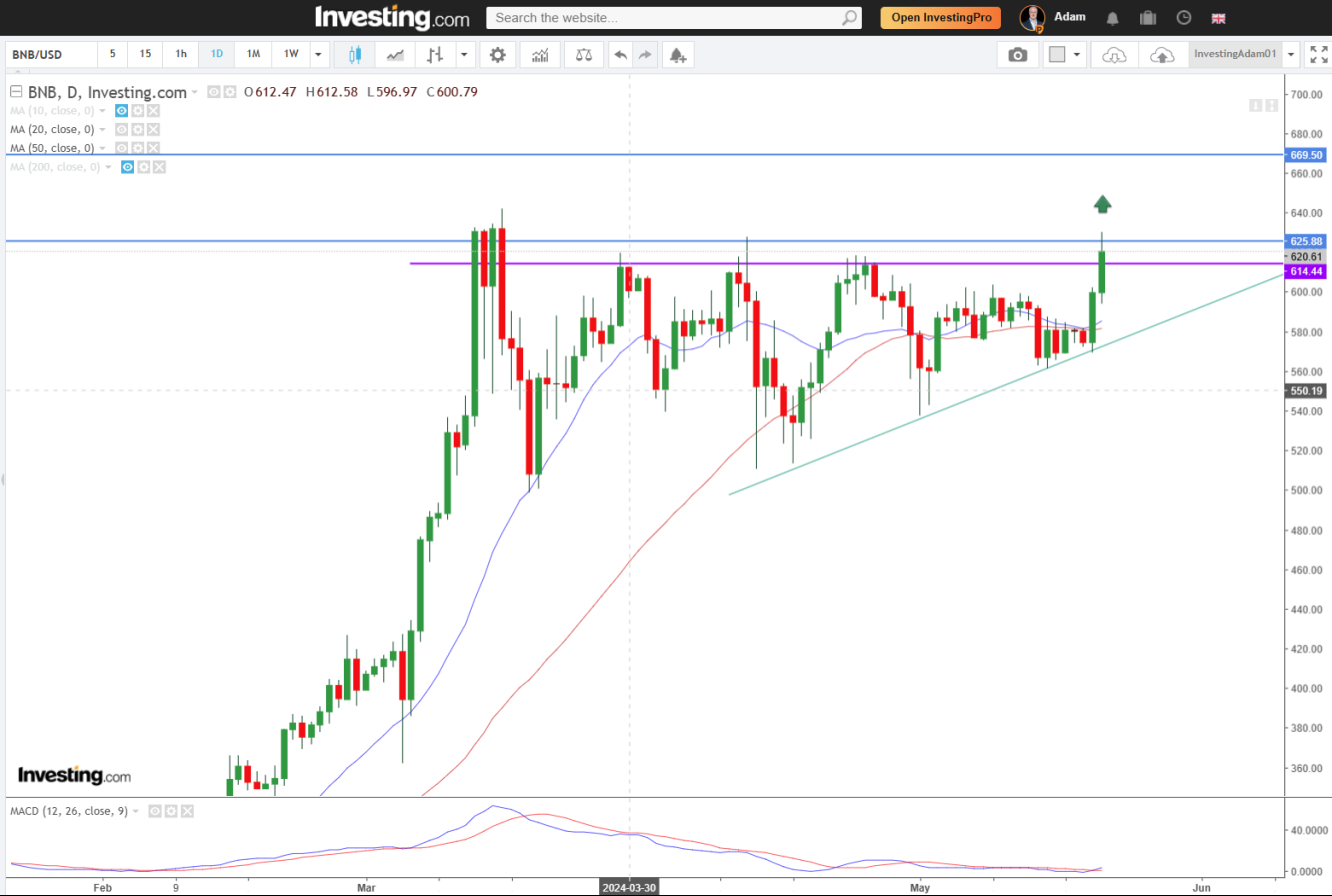
The daily chart of Binance (BNB/USD) as of May 21, 2024, shows a strong bullish breakout pattern. Here’s a detailed technical analysis:
- Ascending Triangle Formation: The chart exhibits an ascending triangle pattern, characterised by a series of higher lows and a horizontal resistance level around $620.61. This pattern typically indicates a bullish continuation.
- Breakout Confirmation: Recently, the price broke above the resistance level at $620.61 with a significant increase in volume, confirming the breakout. The next key resistance level to watch is around $669.50.
- Moving Averages: The 10-day and 20-day moving averages (blue and red lines, respectively) are trending upwards, supporting the bullish momentum. The 50-day moving average is also trending higher, indicating a strong underlying trend.
- MACD Indicator: The Moving Average Convergence Divergence (MACD) at the bottom of the chart shows a bullish crossover, with the MACD line crossing above the signal line. This suggests increasing buying pressure and further potential upside.
- Volume Analysis: The breakout was accompanied by a spike in trading volume, reinforcing the validity of the breakout. Sustained higher volumes will be crucial for maintaining the upward momentum.
The technical indicators and chart patterns for Binance (BNB/USD) suggest a bullish outlook.
The recent breakout above the $620.61 resistance level, supported by increasing volume and positive moving average trends, indicates the potential for further price appreciation.
Traders should monitor the next resistance level at $669.50 and use key support levels, such as the breakout point and ascending trendline, to manage risk.
References
- Binance Official Website
