Market Overview
Once again, it is developments in the US/China trade story overnight which are helping to shape the outlook for today’s trading. Newsflow around the dispute has been broadly positive, but with occasional smatterings of caution. China are seemingly beginning to push for rolling back of the tariffs on $125bn worth of goods into the US. Whilst this has the potential to be another good news story in the process, there is a reticence amongst traders as news of the US response to this is waited. It is unlikely to be a make or break for Phase One, but could it set the tone for Phase Two of the negotiations?
The dollar gained sharply yesterday as the ISM Non-Manufacturing beat expectations. Also comments from one of the main doves on the FOMC (albeit non-voting) Neel Kashkari that current policy was “modestly accommodative”. However, this overnight talk in the South China Morning Post has just pulled the brakes on the move. Gold and the yen are finding a degree of support again around key levels, whilst Treasury yields are also lower in early moves. US equities have also just had some of the wind taken out of them in all-time high ground. If this view continues, there could be a degree of near term profit-taking.
Wall Street closed with mixed caution yesterday, with the S&P 500 -0.1% lower at 3075 whilst US futures are flat today. This has left mixed moves in Asia, with the Nikkei +0.2% but Shanghai Composite -0.6%. In Europe there is a sense of slippage too, with the FTSE 100 Futures -0.3% whilst DAX Futures are -0.1%.
In forex, the mild risk aversion is benefitting an outperforming JPY, whilst the commodity currencies are dropping back with AUD and NZD underperforming. In commodities, the mild risk negative outlook is helping gold to find some support today, even as silver is slightly weaker. Oil has also slipped back by around half a percent.
The final services PMI data across the euro area is the main focus on the economic calendar today. At 09:00 GMT there is no expectation for any changes to the flash reading for the Eurozone final Services PMI at 51.8 (51.8 flash, 51.6 final September). The Eurozone final Composite PMI is also expected to be unrevised at 50.2 (50.2 flash October, 50.1 final September).
The EIA Crude Oil Inventories is at 1530GMT which is expected to show another inventory build of +2.7m barrels (+5.7m barrels last week).
There will also be an eye out for a couple of Fed speakers today. Charles Evans (voter mild dove) is at 1300GMT whilst John Williams (NYSE:WMB) (voter, centrist) is at 14:30 GMT. These two could be considered interesting gauges for sentiment on the committee.
Chart of the Day – EUR/AUD
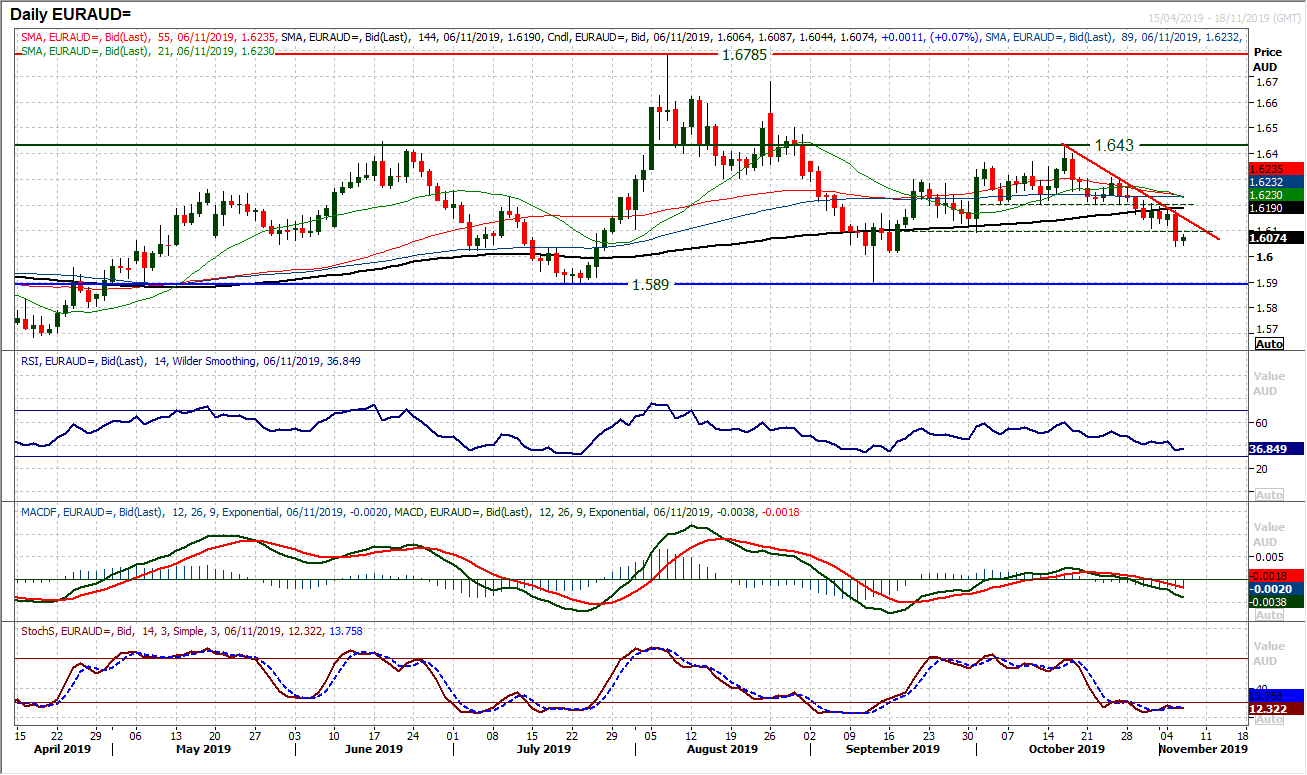
The euro recovery took a real hit yesterday and at the least, the bulls have lost their way. This in combination with a more solid looking Aussie means that EUR/AUD is selling off. A three week downtrend has formed and a downside break below support at 1.6095 hits a seven week low. The break also re-opens the key low at 1.5890, whilst initial support is at 1.6015. Momentum indicators are increasingly corrective, with the RSI under 40 (having failed at 60 again), whilst MACD lines are finding traction below neutral and Stochastics are negatively configured. This all points to rallies being seen as a chance to sell now. There is immediate resistance now 1.6095/1.6120, whilst the three week downtrend comes in at 1.6150 today. The resistance of the near term pivot at 1.6200 is key resistance now.
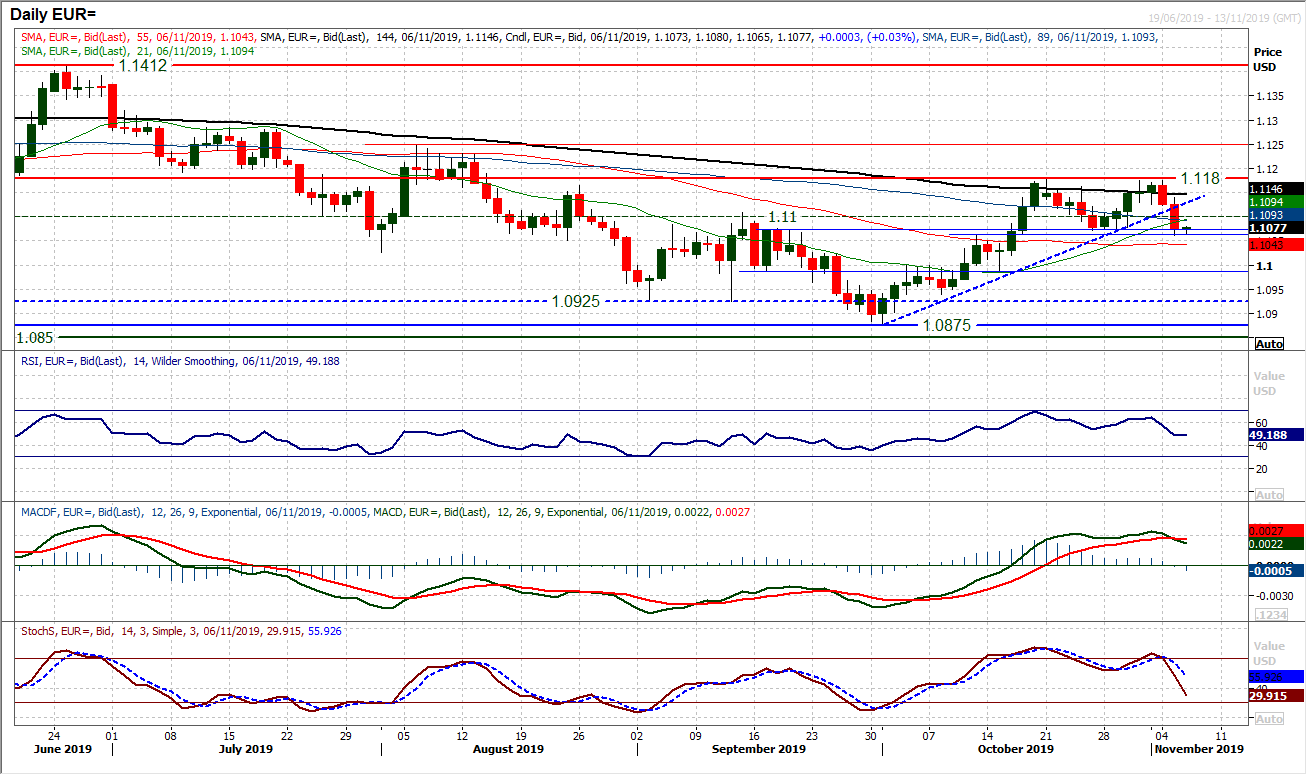
We previously discussed the importance of the support band $1.1060/$1.1075 which held up the late October decline. This support is coming under significant pressure now as the euro has really suffered in the past couple of sessions. The first point to note is that with a decisive bear candle, the decline has broken the support of a five week uptrend and the rising 21 day moving average. There is also a real concern for the bulls that the momentum indicators are all throwing off near to medium term corrective signals. The Stochastics decisively in decline, RI below 50 and most pertinently the MACD bear cross. A close below $1.1070 would be a breach of key support but also confirm a 100 pip top pattern. This is a crucial moment for the bulls to defend, otherwise EUR/USD goes into decisive reverse again. Next support is at $1.0990. The hourly chart shows momentum increasingly negatively configured, and there is resistance $1.1080/$1.1100 this morning. Support at $1.1060 is hanging on, for now, but the pressure is mounting.
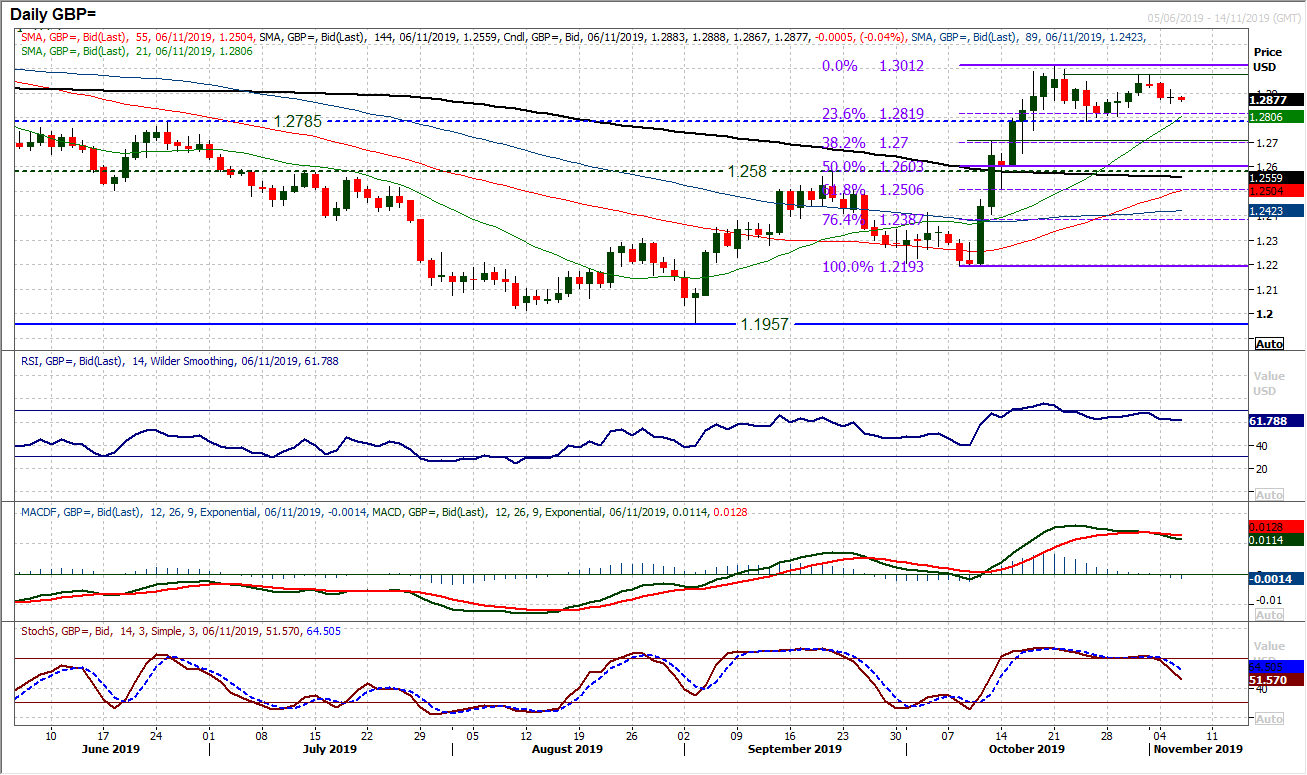
It was interesting to see that whilst EUR/USD formed a decisive negative candle, it was a doji (open and close at the same level) for Cable yesterday. A doji denotes uncertainty. Over recent sessions we have been discussing that Sterling would be settling down after its mid-October huge volatility. This stabilisation seems to be continuing, with another small (c. 60 pips) daily range and the Average True Range continuing to plummet (now down around 90 pips).A market on the drift. This is reflected in the momentum indicators which have rolled over and are slipping back, but with little real purpose. The market has formed a range $1.2785/$1.3010 and within that there seems to be a mid-range pivot band $1.2900/$1.2925 as hourly RSI develops ranging characteristics (oscillating between 30/70). Trading under this pivot there is a mild negative bias, with initial support at $1.2855.
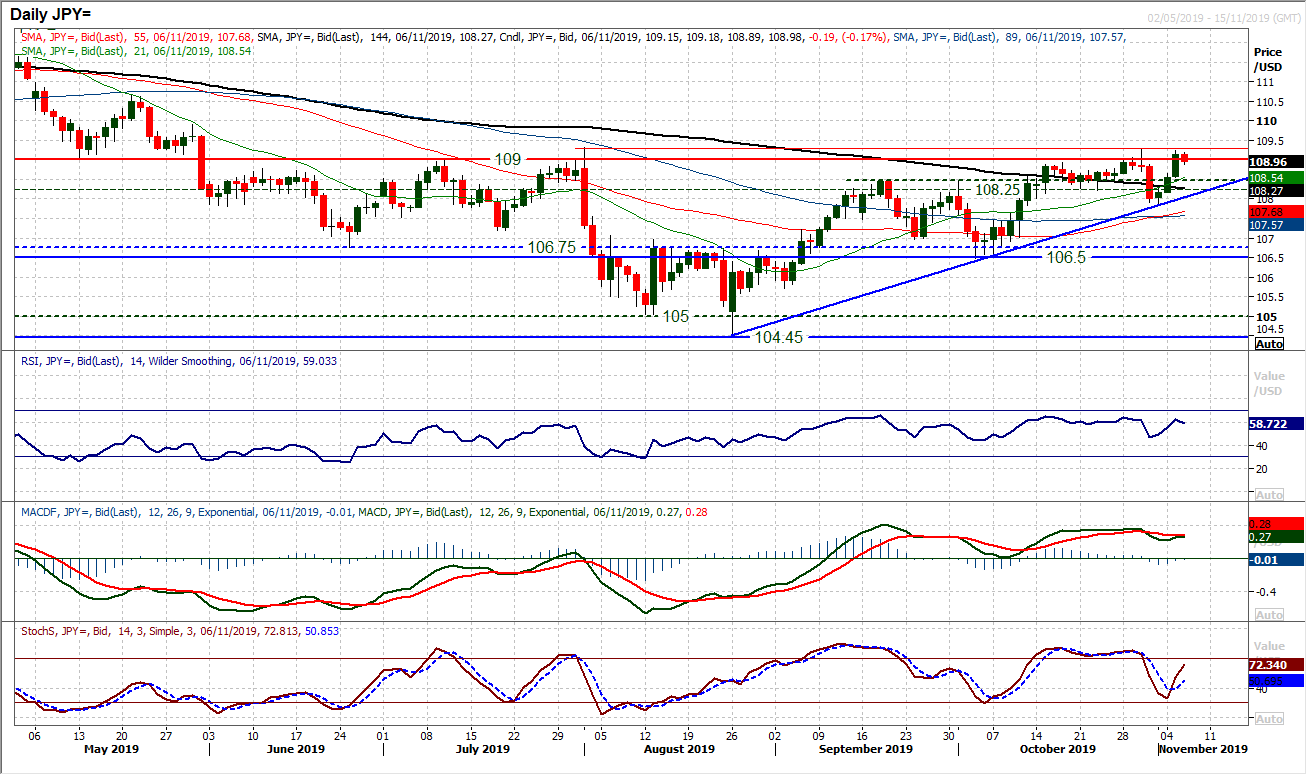
An acceleration higher on USD/JPY in the past few sessions has seen the market drive higher for a closing breakout above 109.00. This is the highest daily close since the end of May. Is this the moment where the bulls can finally break the shackles? The momentum indicators are not confirming yet, with the RSI failing over around 60 with today’s early drop back. Time and again, Dollar/Yen has seen false breakouts , so there needs to be confirmation. Just in the past week, the previous failure above 109.00 was followed by a failed break under 108.25. However, there is a broad positive bias in momentum configuration which would suggest continued upside pressure. How the bulls respond to this early pullback this morning could be key. If the bulls can prevent a retracement from gathering momentum then there could finally be something in the move. Holding on to 108.75/109.00 support could be key now. Resistance at 109.30 remains firm.
Gold
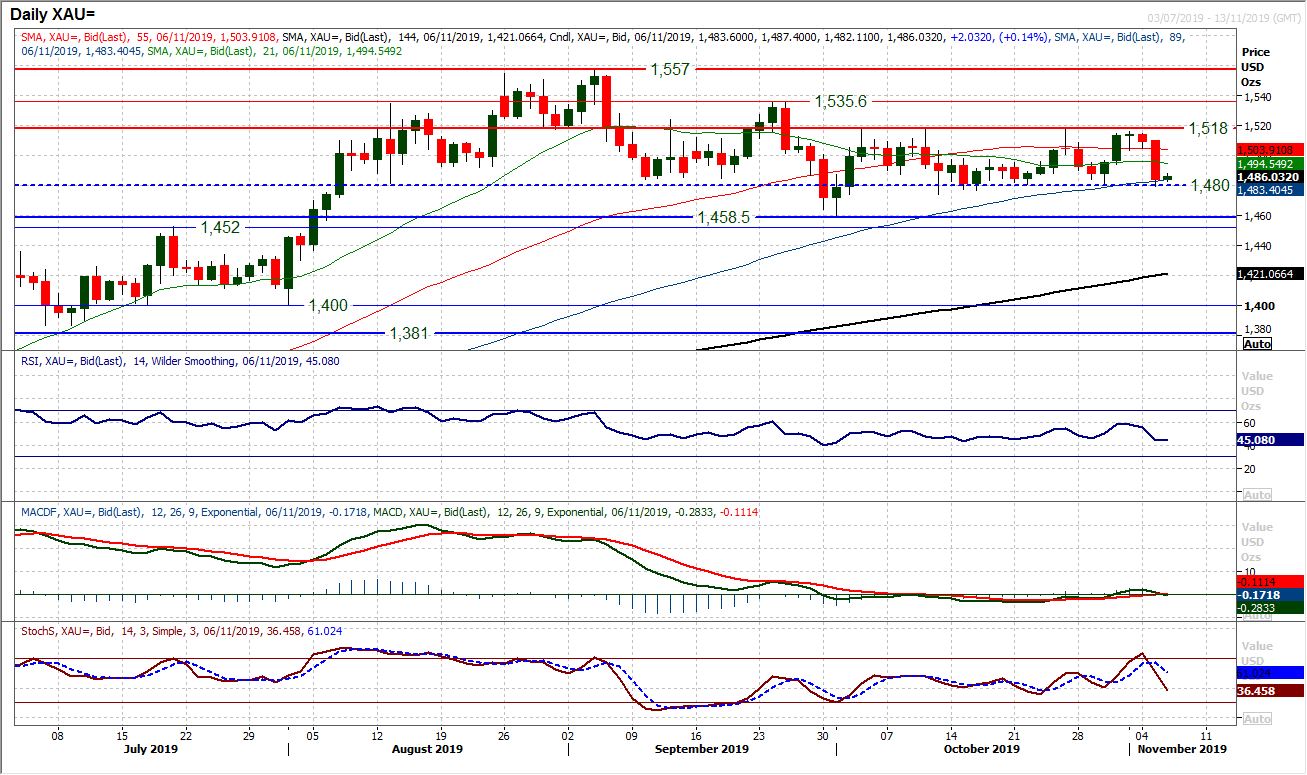
Is this the decisive move that will now break the consolidation of the past month? Yesterday’s big bear candle has opened a test of the support again around $1480. The low at $1474 (on an intraday spike) marks the support of the recent mini-range, but frequently it has been the buyers re-emerging around $1480 which has been a feature of the past month. How the bulls respond to this sell-off will be key now. A close below $1480 would open $1474 initially but also the $1458 key October low. As we have seen over the past five weeks, it is important not to trade ahead of a breakout. The early basis of support again around $1480 suggests that the bulls are still ready to fight to hang on. However, the configuration of momentum on daily and hourly charts swinging lower suggests that pressure is growing.
WTI Oil
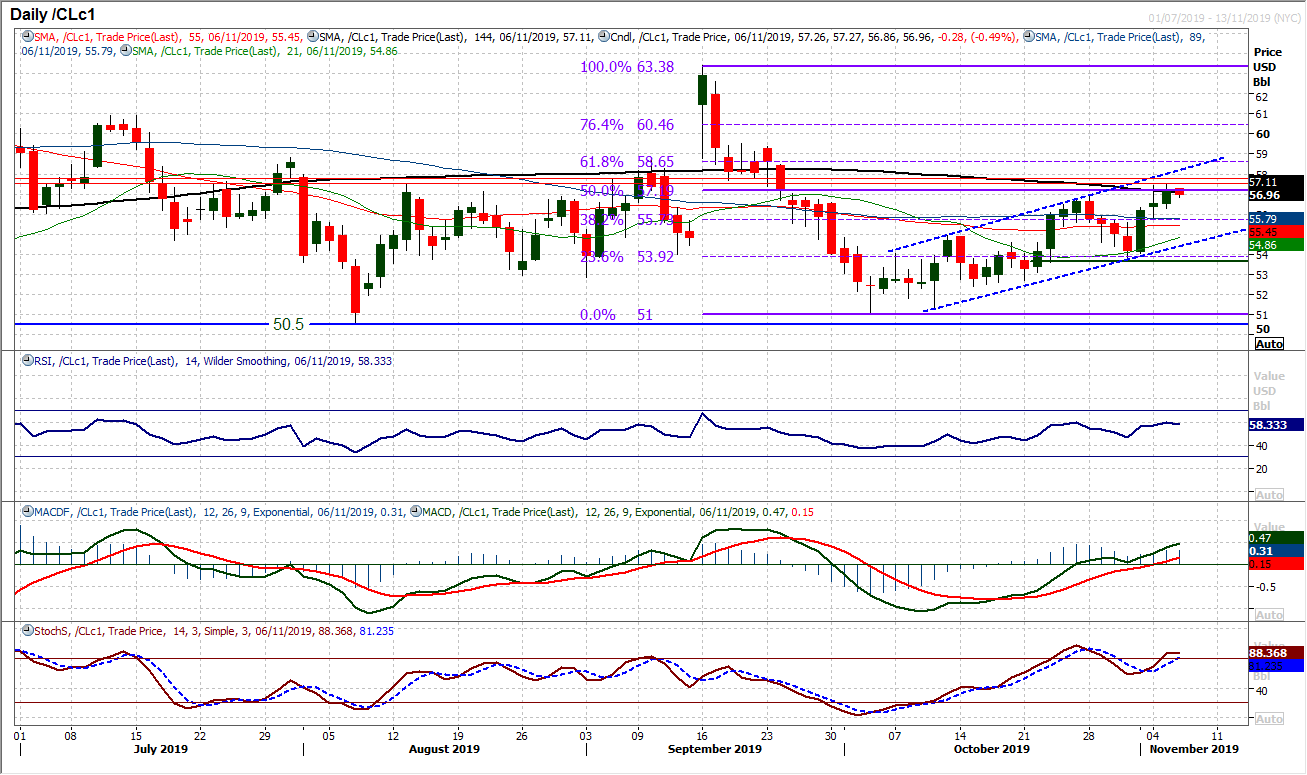
A third consecutive positive session has re-engaged the bulls and with the sequence of higher lows and higher highs continuing, essentially a channel is re-instated. There is an improving outlook with the daily momentum indicators having swung higher once more. Stochastics bull crossing, along with the MACD lines rising above neutral and RSI above 60, all adds to the improving outlook. The top of the channel (today at $58.20) is an initial upside target, however, we need to be mindful that frequently during this recovery, there are significant retracements. We would however, be buyers into weakness. Another caveat to chasing the market higher is that the 50% Fibonacci retracement (of $63.40/51.00) at $57.20 is a consolidation area, whilst a pivot of the past three months comes in at $57.50/$57.75. The hourly chart shows a slight negative divergence developing across momentum indicators which could drag on WTI as this session develops. Below $56.30 opens another near term retracement, but it would also be seen as another opportunity.
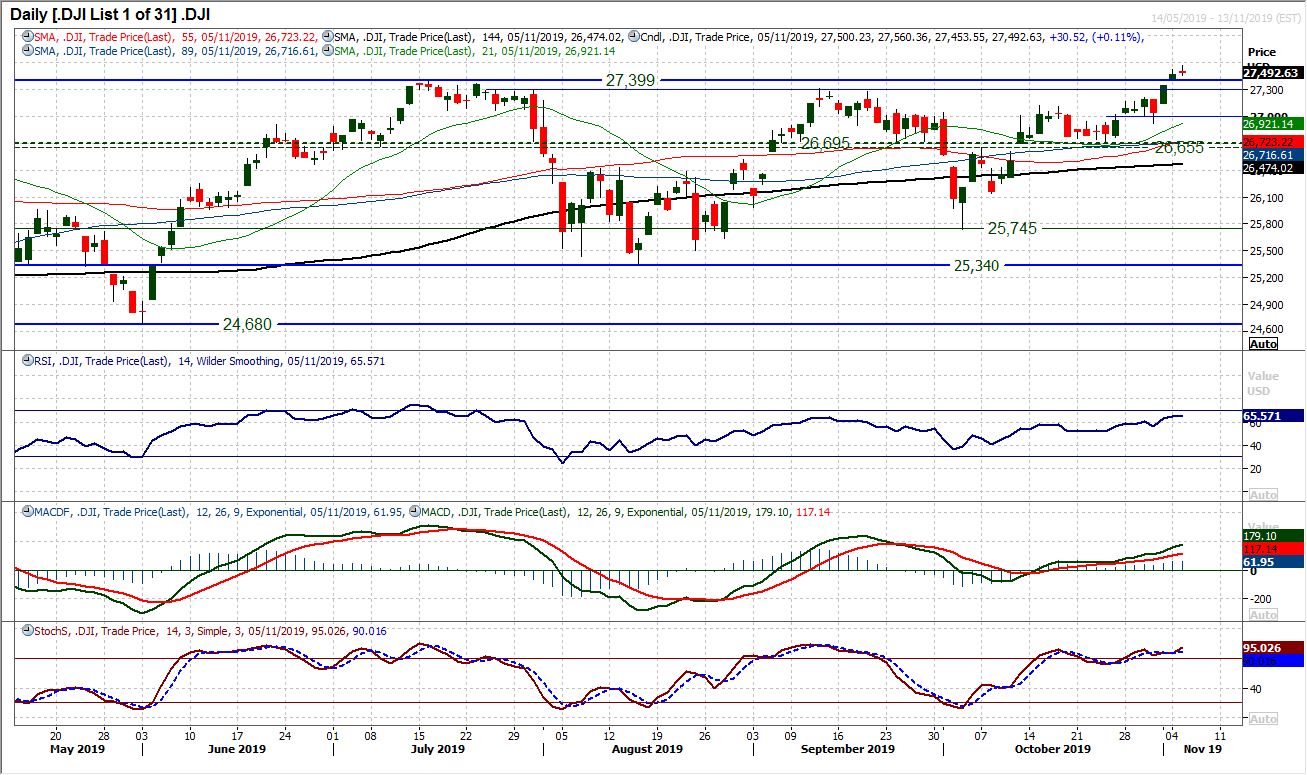
After lagging behind other Wall Street markets, the Dow finally broke to all-time high ground this week. The bulls now have blue sky to look up to, but this comes with a note of caution. Yesterday’s very mild gain formed a slightly negative candle and there is a gap still open at 27,347 which needs to be filled. The nature of the breakout has not been smash the lights out and it is still something of a cautious move. There is clear strength in the momentum though and the bulls are in the driving seat. Signals such as the RSI in the mid-60s, along with rising MACD and strong Stochastics develop a positive outlook. Futures are around the flat line today and the hourly chart gives a sense that a near term pullback (probably to fill the gap) is threatening. Slight negative divergence on hourly Stochastics, a roll over on hourly MACD hint at a retracement potential. There is decent support at the old all-time high of 27,399, the gap (still to be filled) at 27,347 and old highs around 27,300. There is little resistance aside from yesterday’s high of 27,560. We would look to buy into a supported retracement.
"""DISCLAIMER: This report does not constitute personal investment advice, nor does it take into account the individual financial circumstances or objectives of the clients who receive it. All information and research produced by Hantec Markets is intended to be general in nature; it does not constitute a recommendation or offer for the purchase or sale of any financial instrument, nor should it be construed as such.
All of the views or suggestions within this report are those solely and exclusively of the author, and accurately reflect his personal views about any and all of the subject instruments and are presented to the best of the author’s knowledge. Any person relying on this report to undertake trading does so entirely at his/her own risk and Hantec Markets does not accept any liability. """
