Crude Oil Coiling: Is A Breakout Imminent?
Matthew Weller | Apr 06, 2022 05:23
Oil's symmetrical triangle is approaching its apex, raising the probability of a high-volatility breakout in the coming days...
One of the biggest storylines from last month was the wild swings we saw in one of the planet’s most fundamental commodities, crude oil. Looking at spot WTI (USOIL), prices traced out the following path in March:
- Started the month with a surge of more than +33% in a little more than a week…
- …then fell by more than 25% into the middle of the month before…
- …Tacking on another nearly 25% through the 24thand…
- …Finally falling by 15% from those highs to close last week.
In other words, oil saw a year’s worth of volatility in just a month’s time!
Notably, each of those subsequent moves were smaller in magnitude than the previous swing, creating a series of lower highs and higher lows on the chart. In traditional technical analysis parlance, oil carved out a well-defined “symmetrical triangle pattern” across the month of March. For the uninitiated, a common analogy for this pattern is that of a spring being compressed from both the top and the bottom; it builds up potential energy and once one of those pressure points is removed, the spring (WTI price) is likely to move sharply in that direction.
As the chart below shows, the symmetrical triangle is approaching its apex, raising the probability of a high-volatility breakout in the coming days.
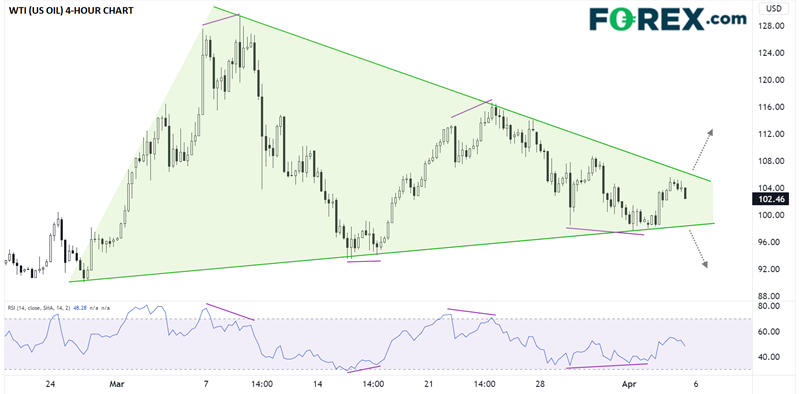
Source: TradingView, StoneX
Astute traders will also note that prices formed a bearish divergence with the 14-period RSI before reversing on all four occasions last month; accordingly, if we don’t see a similar divergence on a breakout beyond the triangle pattern, it would add even more confidence in a continuation in one direction or the other.
In terms of logical target areas, a bullish breakout would initially pave the way for a move up to the late-March high near $116, while a bearish breakdown could fall to the late February lows near $90.00 in short order.
Original Post
![]()
Trading in financial instruments and/or cryptocurrencies involves high risks including the risk of losing some, or all, of your investment amount, and may not be suitable for all investors. Prices of cryptocurrencies are extremely volatile and may be affected by external factors such as financial, regulatory or political events. Trading on margin increases the financial risks.
Before deciding to trade in financial instrument or cryptocurrencies you should be fully informed of the risks and costs associated with trading the financial markets, carefully consider your investment objectives, level of experience, and risk appetite, and seek professional advice where needed.
Fusion Media would like to remind you that the data contained in this website is not necessarily real-time nor accurate. The data and prices on the website are not necessarily provided by any market or exchange, but may be provided by market makers, and so prices may not be accurate and may differ from the actual price at any given market, meaning prices are indicative and not appropriate for trading purposes. Fusion Media and any provider of the data contained in this website will not accept liability for any loss or damage as a result of your trading, or your reliance on the information contained within this website.
It is prohibited to use, store, reproduce, display, modify, transmit or distribute the data contained in this website without the explicit prior written permission of Fusion Media and/or the data provider. All intellectual property rights are reserved by the providers and/or the exchange providing the data contained in this website.
Fusion Media may be compensated by the advertisers that appear on the website, based on your interaction with the advertisements or advertisers.