Wall Street closed with a decent retracement bounce of +1.2% on the Dow and +1.3% on the S&P 500 (to 2882). However, US futures have fallen back early today and are currently -0.4%. Asian markets have been cautious today, with the Nikkei -0.3% and Shanghai Composite +0.1%. European markets are similarly mixed, with FTSE futures around flat and DAX futures +0.2%. In forex, JPY is back as an outperformer whilst the commodity currencies are struggling. The big mover is a huge sell-off on NZD which has fallen by -1.8% on the -50bps rate cut from the RBNZ, whilst AUD is -0.7% too. In commodities, gold continues to pull higher, another +1.0% and eyeing $1500 now, whilst oil is marginally lower again.
It is another quiet day for the economic calendar, leaving the EIA oil inventories at 1530BST the only major release. Crude stocks are expected to drawdown for an eighth successive week with another -3.3m barrels (-8.5m barrels last week), with distillates expected to also be in drawdown by -0.2m barrels (-0.9m barrels last week) and gasoline stocks in drawdown by -1.2m barrels (-1.8m barrels last week).
Chart of the Day – Silver
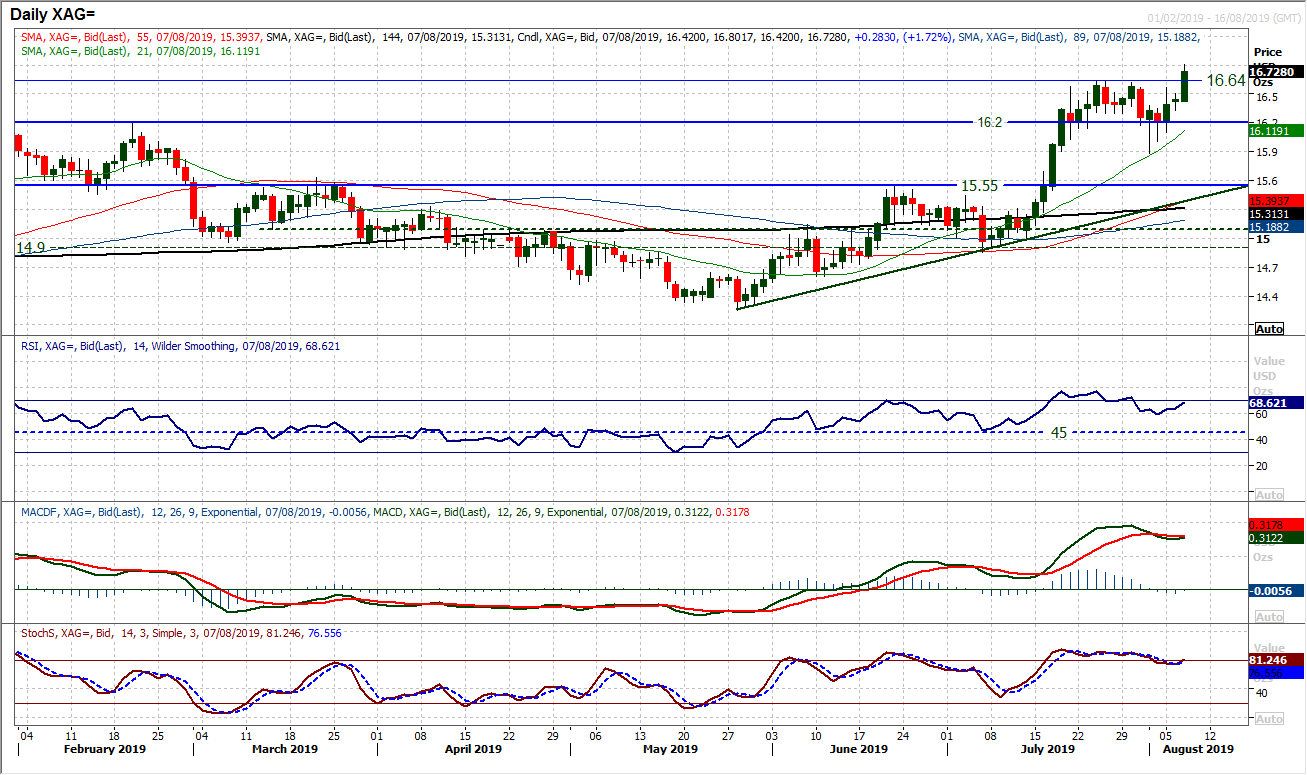
Given the huge outperformance of Silver during July, it is interesting to see more of a consolidation into August. We retain a bullish outlook on silver whilst the market continues to find buyers as the market unwinds back towards the $16.20 breakout. It is therefore interesting to see silver now beginning to follow gold in a breakout today. Gold broke to multi-year highs recently, but silver has been stuck under the mid-July high at $16.64 for the last couple of weeks. A breakout above $16.64 as now been seen this morning and will be a strong move on a closing breakout. This is the next step in the bullish outlook, having broken out above $16.20, this is now a key basis of underlying demand. A closing break of $16.64 is the next leg higher and would open upside towards the Q2 2018 highs of $17.35 in due course. Momentum indicators have unwound throughout the recent consolidation, retaining a bullish configuration and weakness as a chance to buy. A close below $16.20 would be a disappointment now, with the recent intraday lows between $15.88/$16.10 providing further support.
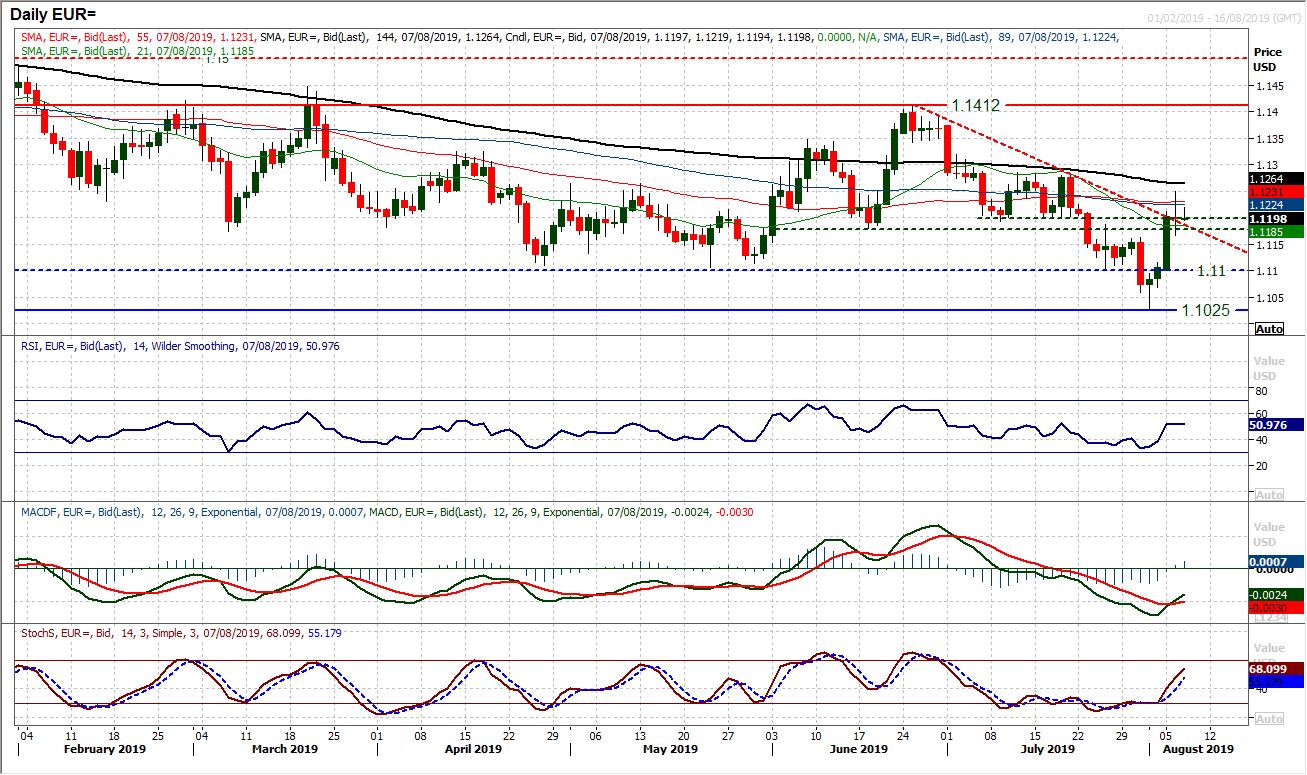
We noted previously the importance of the $1.1180/$1.1200 band which has become pivotal in recent sessions. Having broken out decisively on Tuesday, a failure below the pivot would have been a negative signal for EUR/USD. Although the outlook is still in the balance, only holding the breakout above $1.1180/$1.1200 marginally this morning. It is a positive step though. The momentum indicators are pointing towards the recovery holding, with the bull cross on MACD and Stochastics rising well. However, there is still work for the bulls to sustain the move. What we see likely is that negative outlook has been neutered by the rebound in the past week. Although we do not see the euro gaining hugely from here, equally, sustainable downside is looking less likely and the outlook far more mixed now. Resistance is at $1.1250 initially under more considerable $1.1280. Support under $1.1180 comes in at $1.1160.
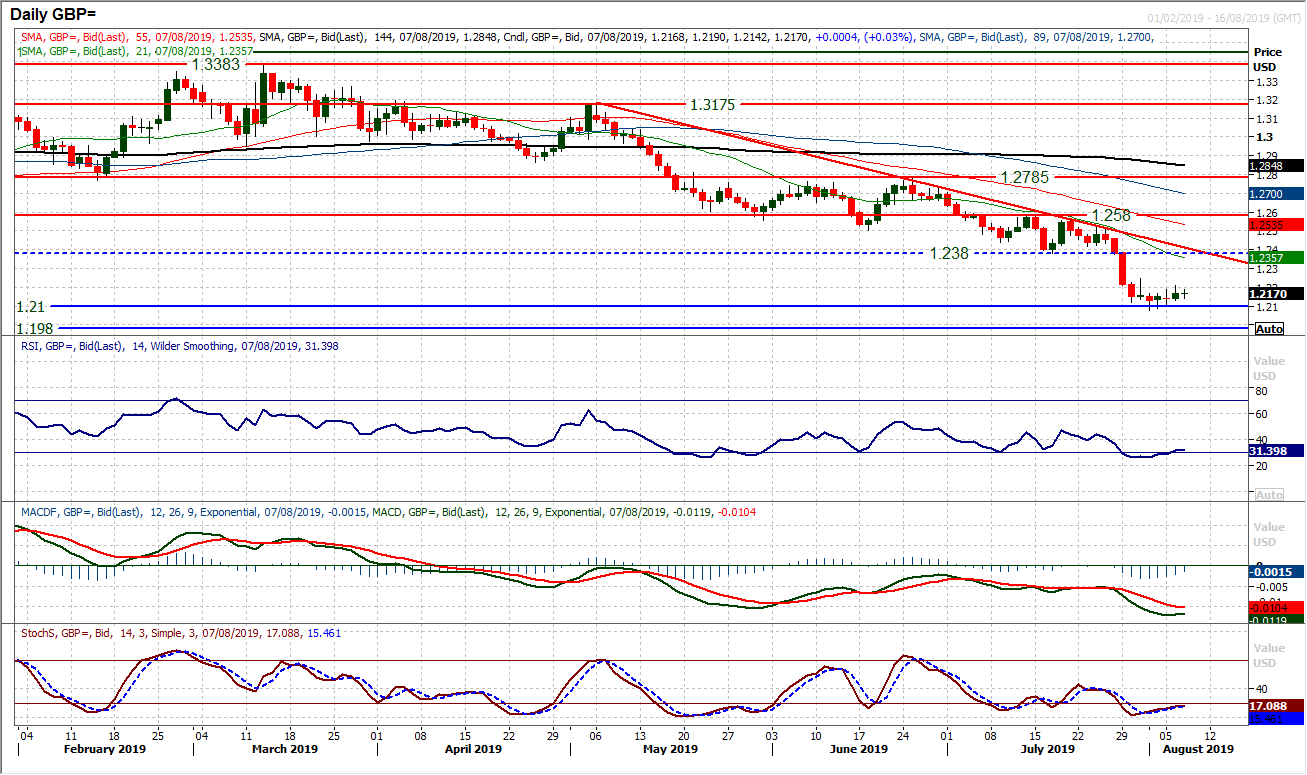
Amidst all the volatility of other forex majors, Cable has barely budged in recent sessions. In the massive dichotomy of performance versus the US dollar on the majors (safe havens versus higher risk commodity currencies) Cable has found a quiet corner to rest. Within the context of the negative medium to longer term outlook, Cable is consolidating. A shade above support at $1.2100, Cable has edged a few pips higher, but in reality this is a market going nowhere for now. There is still room for a bounce were one to start to edge higher, but resistance at $1.2250 protects the bigger $1.2380/$1.2440 resistance band. A three month downtrend comes in at $1.2415 today, whilst the 21 day moving average (a basis of resistance) is at $1.2355 today. We continue to look to use any near term rallies as a chance to sell and expect further pressure on $1.2100 in due course. A close below $1.2100 opens $1.1980.
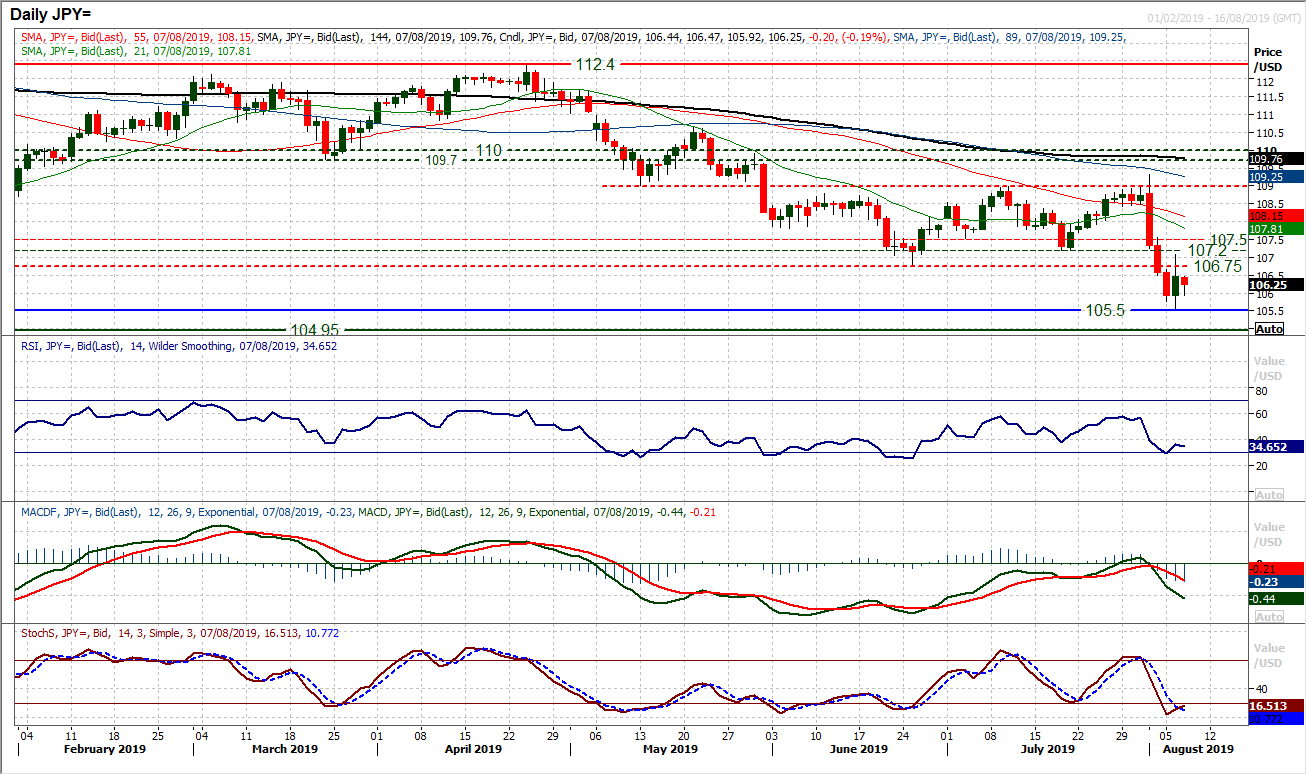
Similar to the outlook on EUR/USD we see the rebound on Dollar/Yen back around a key pivot. The old support of 106.75 is new resistance and the failure of yesterday’s rally to recover the breakdown will now be a concern for markets. With the recent breakdown, there is now a key area of overhead supply 106.75/107.50 from all the recent key lows. Yesterday’s bounce failed at 107.07 and with a renewed slip back today the prospects of recovery remain small. Momentum indicators have picked up marginally, but again, this is limited, whilst perhaps tellingly, the sensitive Stochastics are not posting any by signal for now. The hourly chart shows the bounce having rolled over and the resistance building under 106.75. Expect further pressure back on 105.50, whilst a retreat towards 104.50/105.00 long term support area looks likely still.
Gold
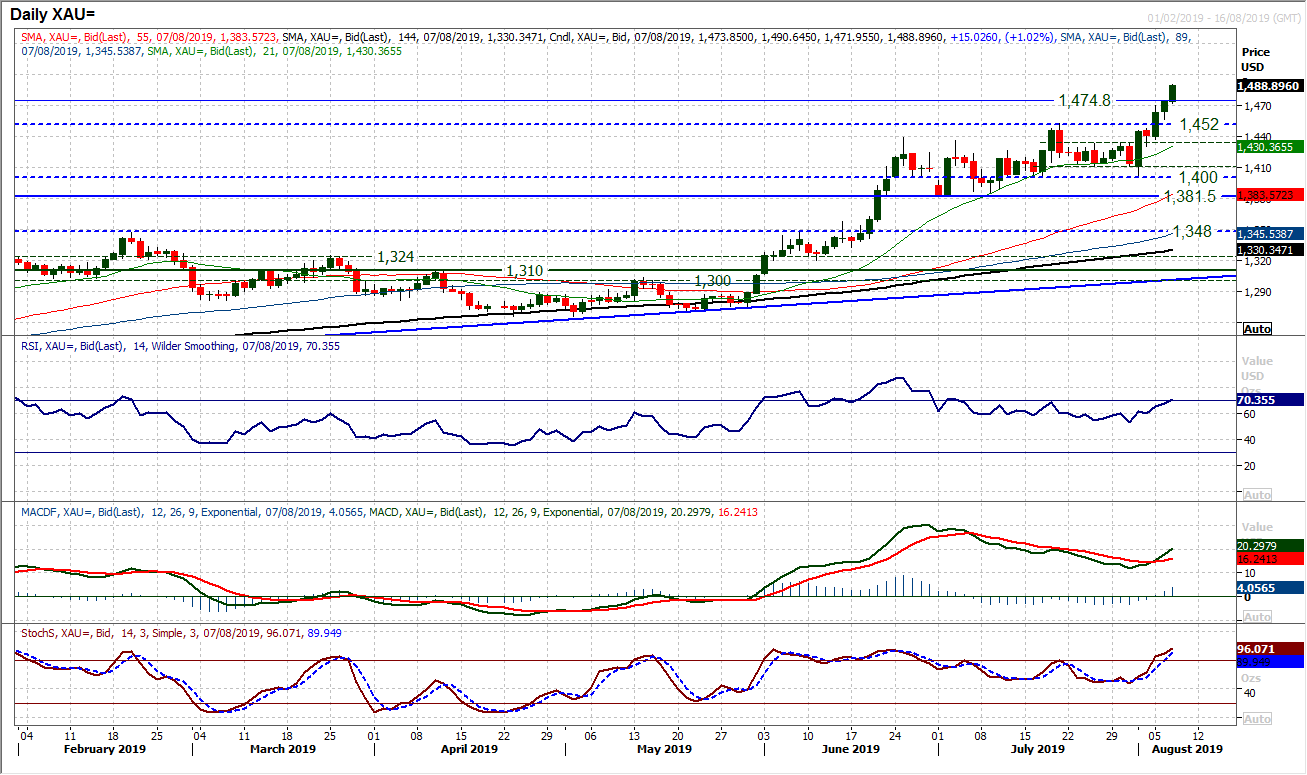
The bulls look to be on a run now and there is little by way of resistance to stop them. Gold has broken out to close at multi-year highs in the past two sessions. Two decisive bull candles and once more, early today we see the market running further higher. Momentum remains strong and the bulls remain in control of the move. The RSI into the high 60s along with the bull cross on MACD lines reflects this. However, this is a run to be careful with. We remain bullish of gold for further upside, but also are a little guarded for chasing the immediate run higher. Moves of the past couple of months show that strong bull candles are often followed by near term retracements which ultimately give better entry points for longs. Perhaps this is a little conservative of us, given the June bull run went into the mid-80s on RSI before the consolidation set in. SO we are watching the near term indicators for signs of exhaustion. There is breakout support now from yesterday’s high around $1475, also watch for potential reversal signals such as a bear cross on hourly MACD. We continue to be buyers into near term weakness and the breakout support between $1433/$1452 is an increasingly key area of underlying demand now. With gold at over 6 year highs, the next upside level of note is the psychological $1500.
WTI Oil
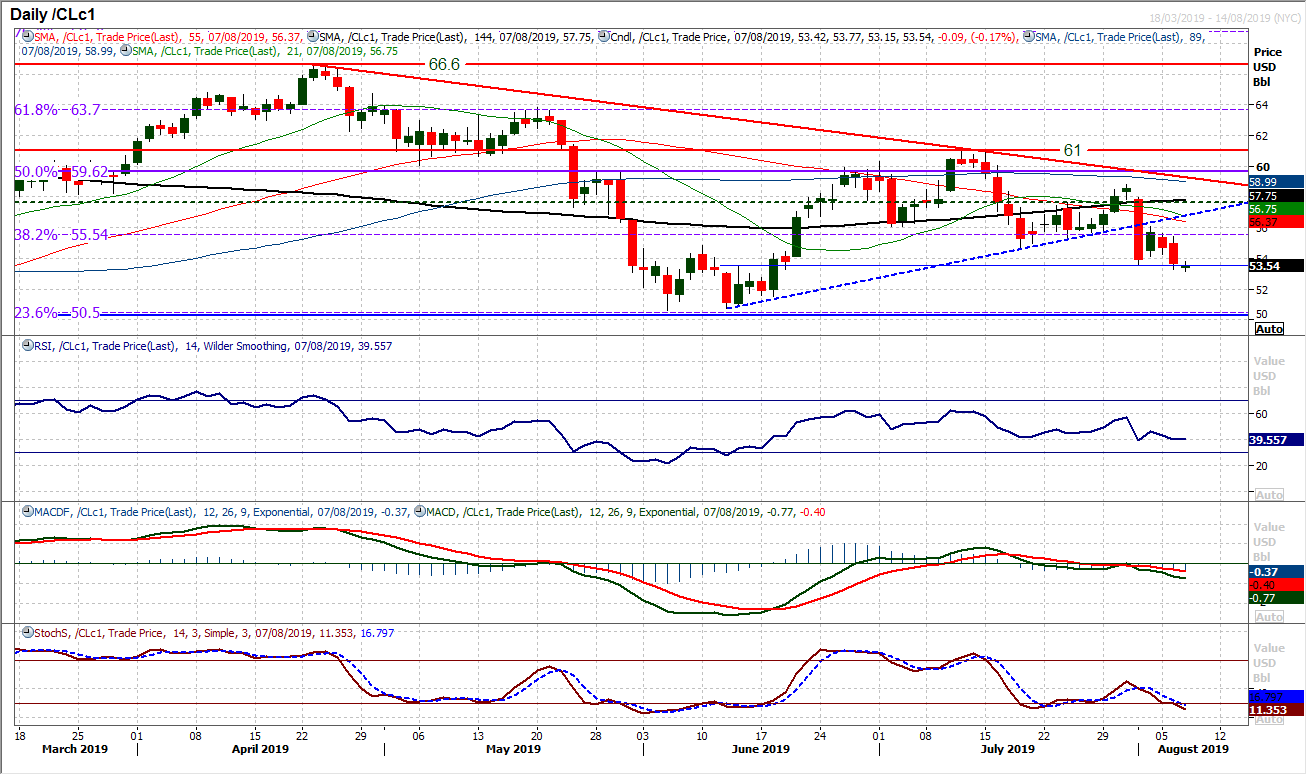
Given the outlook of broad market sentiment remains muted at best, and oil futures in backwardation (implying a market set up for shorting oil), the technicals are also in agreement for a negative outlook. In the wake of the sharp bear candle of last Thursday, the market has never managed to muster any significant recovery. The initial bounce has been used as a chance to sell and intraday rallies are struggling. Two subsequent negative candles have resulted in intraday breaches of $53.60 and a closing break would be bearish. With the momentum indicators negatively configured, and the 38.2% Fibonacci retracement a barrier to gains (at $55.55) expect further negative pressure. A close below $53.60 opens the key support around $50.50. Intraday rallies are a chance to sell.
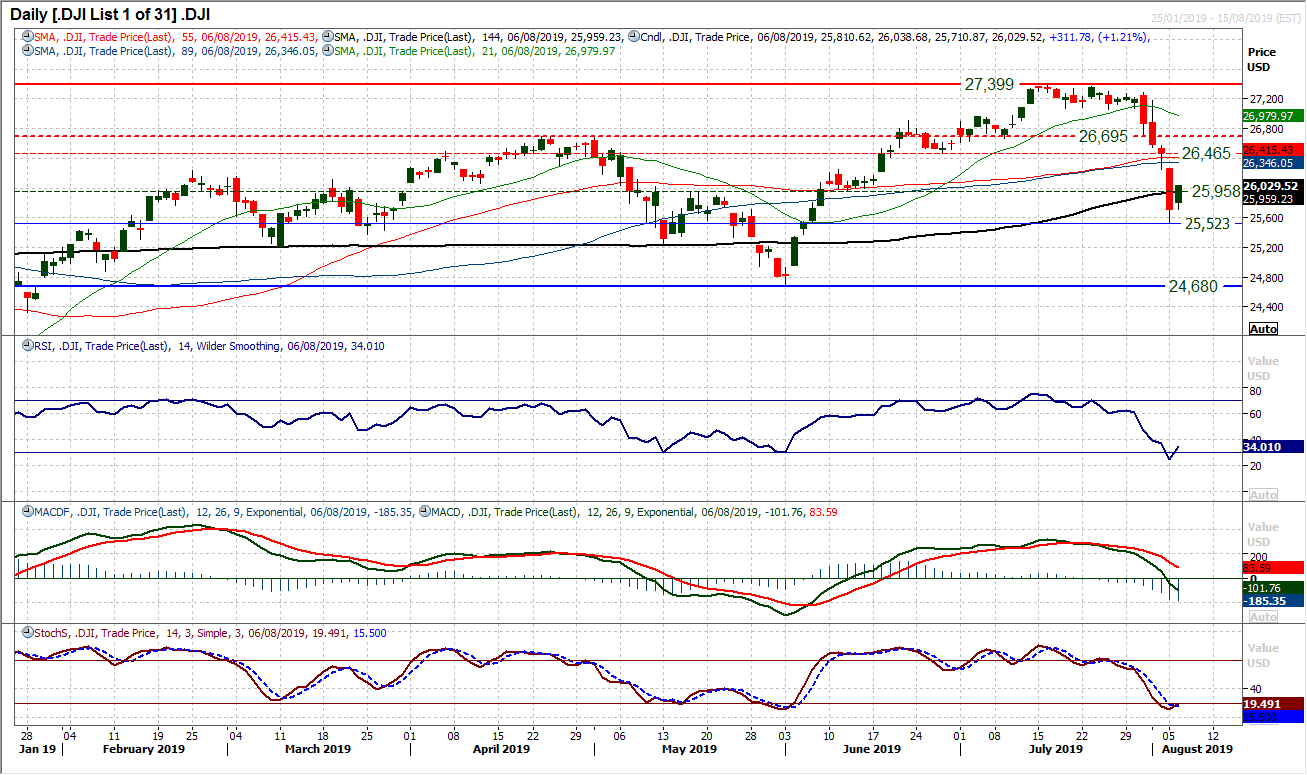
Wall Street bounced back yesterday in a move to retrace at least some of the huge losses of recent sessions. However, the Dow has a long way to go to convince that the bulls have sustainably put a floor in place. The low at 25,523 from Monday’s session has already seen a bounce of over 500 ticks, but remarkably tis still barely scratches the surface of the preceding sell-off. How the market responds today will be perhaps even more important as this could simply be a dead cat bounce. The RSI ticking back above 30 is encouraging as a basis buy signal, but the MACD lines continue to fall drastically. The Stochastics will now be a key early indicator and they have just looked to bottom, but with now conviction yet. The hourly chart shows the first real resistance at 26,255/26,260, whilst hourly RSI needs to push into the 60s to suggest the bulls are really finding traction. There is a mini higher low at 25,710. It is still too early to call this a bottom, and with futures around half a percent lower today, the higher low support could quickly be tested and the recovery scuppered even before it really gets going.
"""DISCLAIMER: This report does not constitute personal investment advice, nor does it take into account the individual financial circumstances or objectives of the clients who receive it. All information and research produced by Hantec Markets is intended to be general in nature; it does not constitute a recommendation or offer for the purchase or sale of any financial instrument, nor should it be construed as such.
All of the views or suggestions within this report are those solely and exclusively of the author, and accurately reflect his personal views about any and all of the subject instruments and are presented to the best of the author’s knowledge. Any person relying on this report to undertake trading does so entirely at his/her own risk and Hantec Markets does not accept any liability. """
Market Overview
It is certainly a rocky moment for financial markets. Suddenly it seems as though risk appetite is beholden to the outlook of the People’s Bank of China. Every day the PBoC sets the mid-point for the Dollar/Yuan rate around which the yuan can fluctuate 2%. USD/CNH (offshore yuan) breaching 7.00 was seen as a crucial watershed. The PBoC is yet to set the mid-point above 7.00 but got remarkably close to it today at 6.9996. This was worse than the previous session and seems to have stopped an attempted rally on risk that had been threatening yesterday. Once more the safe havens are strengthening, with gold pushing ever further multi-year highs, the yen gaining ground, whilst the US 10 year yield is back below 1.70% again. Add in the feeling of concern that a surprise 50 basis point rate cut from the Reserve Bank of New Zealand back to 1.00% (-25bps cut expected to +1.25%, from +1.50% in June). The Kiwi has been smashed and the Aussie is falling in sympathy. Right now, equities are only marginally lower in the European session, but this all does very little to help settle the nerves of markets rattled by the escalation of the trade dispute.
