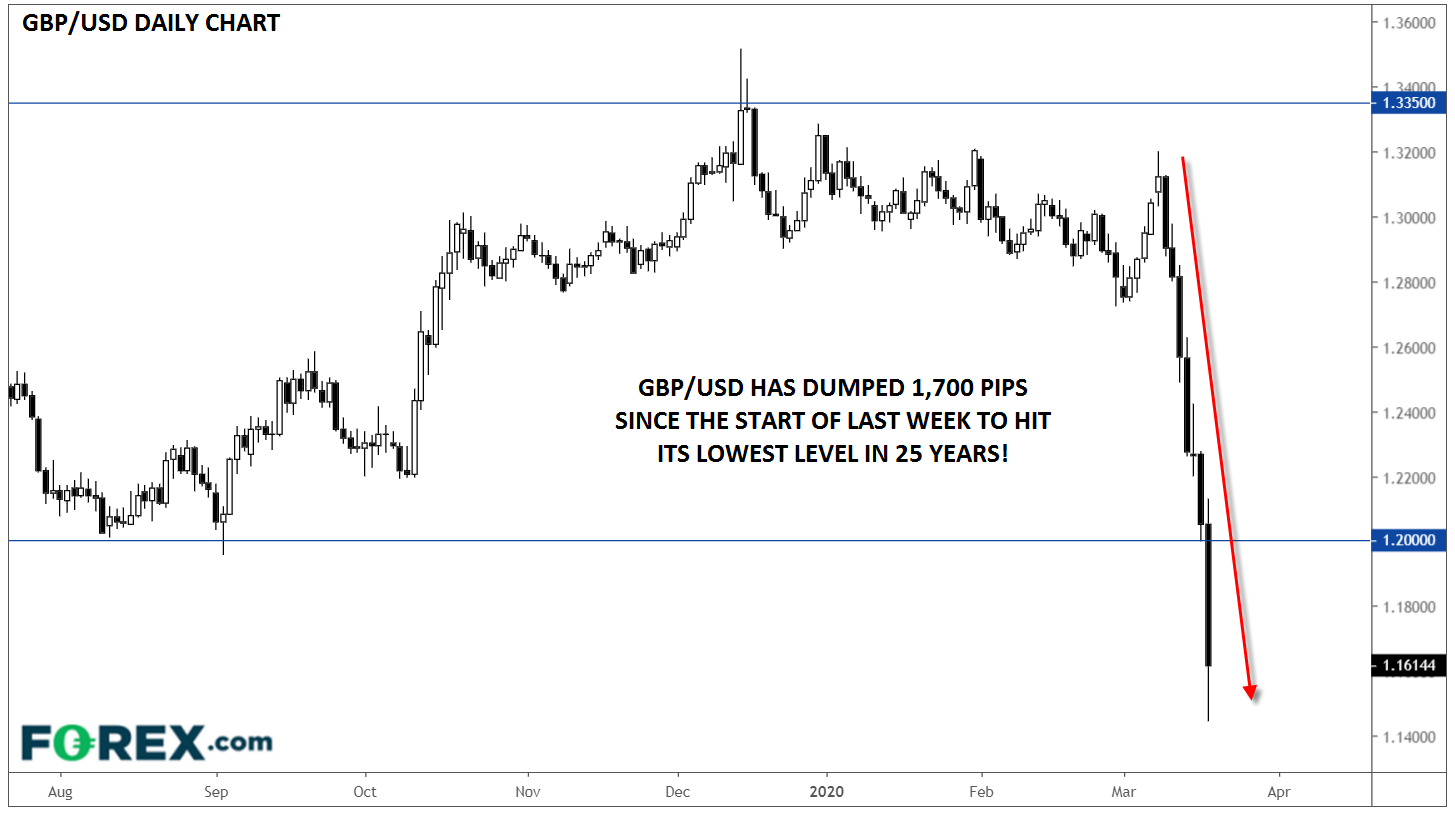
While global stock markets have melted down and global bond markets have melted up (and now back down again) over the last couple weeks, the world’s largest market had been relatively insulated from the massive volatility impacting other traders.
That ended today.
The FX market is seeing some of its biggest moves in years across a swath of different currencies, but there’s no pair more interesting right now than GBP/USD. At the start of last week (a lifetime ago in the coronavirus time), the pair was trading above 1.30, near the top of its 20-month range. Since then, rates have absolutely imploded, with the pair falling to trade below 1.1500 earlier today, the culmination (so far) of a nearly 600-pip peak-to-trough collapse today alone.
As of writing, the pair is trading at its lowest level since the mid-1980s! For the market historians following along at home, GBP/USD’s post-gold-standard low sits about 1,000 pips lower near 1.05.
The. Bottom. Dropped. Out.
So what drove cable to these historic lows, and is it likely to continue?
As always with markets, there was no single factor driving millions of traders’ in unison, but UK policymakers’ blasé “herd immunity” strategy for dealing with coronavirus certainly paid a major role, as have rumors that London will be shut down imminently to slow the outbreak of the disease. In the UK, more than 700 new cases of coronavirus have been reported in just the last 24 hours, bringing the total number of infections above 2,600; over 100 UK citizens have died.
Though those headlines are alarming, they’re not enough alone to explain cable’s incredible collapse over the last couple weeks. The move has been exacerbated by funding squeeze in the US dollar, which has been the only major asset to appreciate meaningfully through the crisis, with correlations in other major markets rising toward 1.
With regard to GBP/USD, one of the earliest lessons many traders learn is to “never catch a falling knife.” The strength of the current selling pressure is overwhelming any semblance of buying, and with no support levels from the past 35 years nearby, there’s no logical place for bulls to regroup. That said, cable is deeply oversold will form at least a near-term bottom at some point; it’s difficult to handicap a more likely area for such a reversal than usual.
At this point, readers looking to pick a bottom (or shorts planning on booking profits) may want to drill down to a smaller timeframe chart, such as the 1-hour chart, and look for candlestick reversal patterns or divergences in momentum oscillators to set up short-term trades with strong risk/reward ratios. Longer term, the bearish bias will remain intact as long as rates remain below key psychological support-turned-resistance at 1.20.
