Market Overview
There is a sense of anticipation that has built up across major markets as consolidation has crept in. The major mover right now is sterling, which is like an excitable puppy, trading with significant volatility as it jumps up and down.
The EU/UK negotiators have been working hard for several days to get some sort of text ready for the EU Council to consider, and apparently the “foundations” are there. Michel Barnier said last week, “where there’s a will, there’s a way”, so markets are on tenterhooks. However, time is running out for a deal this week and sterling is slipping this morning. Suggestions are that the unionist party in Northern Ireland, the DUP, will not support the deal when it is put to Parliament (probably on Saturday).
It is interesting to see that the euro is holding on to its recent positive performance, but it would also suffer should there be an impasse in Brussels/Parliament. Broad risk appetite has been a beneficiary too recently amid the elevated Brexit deal prospects, with yen and broadly US dollar underperformance. However, this could all turn on a sixpence though today. Although Gilt yields and Bund yields have been higher on the Brexit story, Treasury yields have been struggling recently. A worrying decline in US Retail Sales is certainly something that could now play on the minds of Treasuries traders. The US consumer has been doing the heavy lifting with US growth, and if sales start to decline consistently, then this could usher the Fed into more of a dovish cycle.
Wall Street had a bit of a quiet session yesterday, with a mild decline on the S&P 500 by -0.2% to 2990. US futures are again a little cautious today -0.1%. Asian markets were mixed overnight, with both Nikkei and Shanghai Composite almost dead flat. In Europe, there is a slip back for DAX futures (-0.4%), whilst FTSE futures (+0.2%) are being supported by an early decline on sterling.
In forex, the GBP decline is the big move, but it is interesting to see AUD stronger after the Australian Unemployment numbers showed the headline rate a shade lower than expected at 5.2%. In commodities, gold and silver are fluctuating around the flat line, whilst oil is stumbling to give back yesterday’s rebound gain.
The economic calendar for the European session is focused on the final of this week’s major UK data. UK Retail Sales (ex-fuel) is at 09:30 BST and is expected to fall by -0.1% in the month of September (having fallen by -0.3% in August) but this would mean the year on year data would improve to +2.8% (from +2.2% in August). The US data begins with the Philly Fed Business index at 1330BST which is expected to slip back to a still positive +8 in October (from +12 in August).
There is also US Building Permits at 1330BST which are expected to drop back to 1.32m in September (from 1.42m in August) and Housing Starts expected to drop back to 1.32 (from 1.36 in August). Weekly Jobless Claims are expected to remain around recent levels, with 215,000 (a shade higher from 210,000 last week).
The EIA Oil Inventories are a day delayed this week and are at 1600BST, with crude stocks expected to again be building by +2.7m barrels (2.9m barrels last week), with distillates in drawdown by -2.2m barrels (from -3.9m barrels last week) and gasoline stocks in drawdown by -1.4m barrels (-1.2m barrels last week).
There are more Fed speakers today, with Michelle Bowman (voter, leans hawk) at 1900BST, whilst Charles Evans (voter, leans dove) at 1900BST and John Williams (NYSE:WMB) (voter, centrist) at 2120BST.
Chart of the Day – EUR/JPY
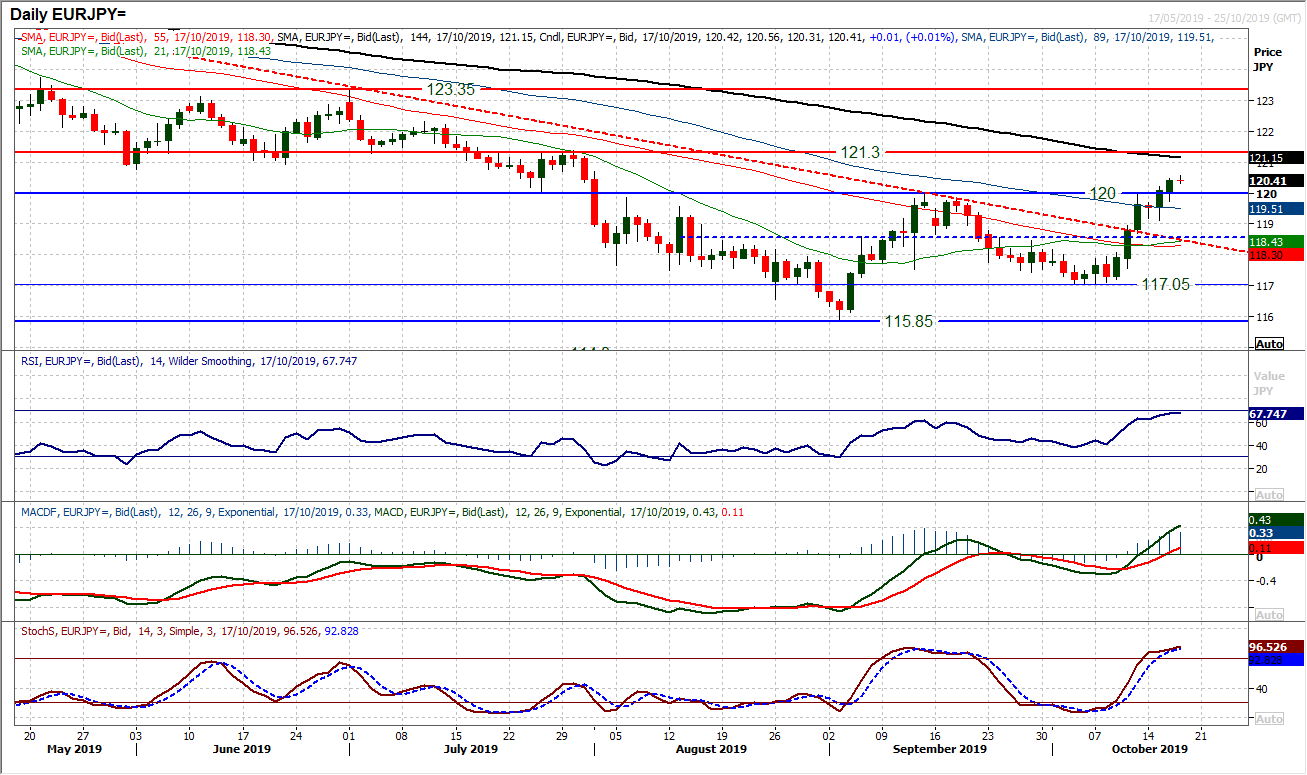
A risk positive market makes for a weaker yen but positive signs for a Brexit deal are benefitting the euro too. Subsequently the outlook for EUR/JPY has improved significantly recently. Resistance at 120.00 has been a key pivot and a barrier for the past few months. However, yesterday’s latest strong bull candle was a second (confirmatory) closing breakout, taking the pair to an 11 week high. The multi-month downtrend was broken last week and now clearing 120.00 on a decisive basis means that the bulls are finally building some traction in a new positive trend. This has been a crossroads moment that the euro bulls are now pushing through. Momentum indicators are positively configured with RSI in the mid-60s, whilst MACD lines accelerate above neutral for the first real time since April and Stochastics are strong. This points to buying into weakness now. There is a burgeoning run of seven successive higher daily lows now, meaning the support at 119.75 is a key near term gauge and 119.75/120.00 is a near term buy zone. The hourly chart shows 119.10 as the first real higher low and key support. A consistent close above 120.00 opens further recovery to 121.30.
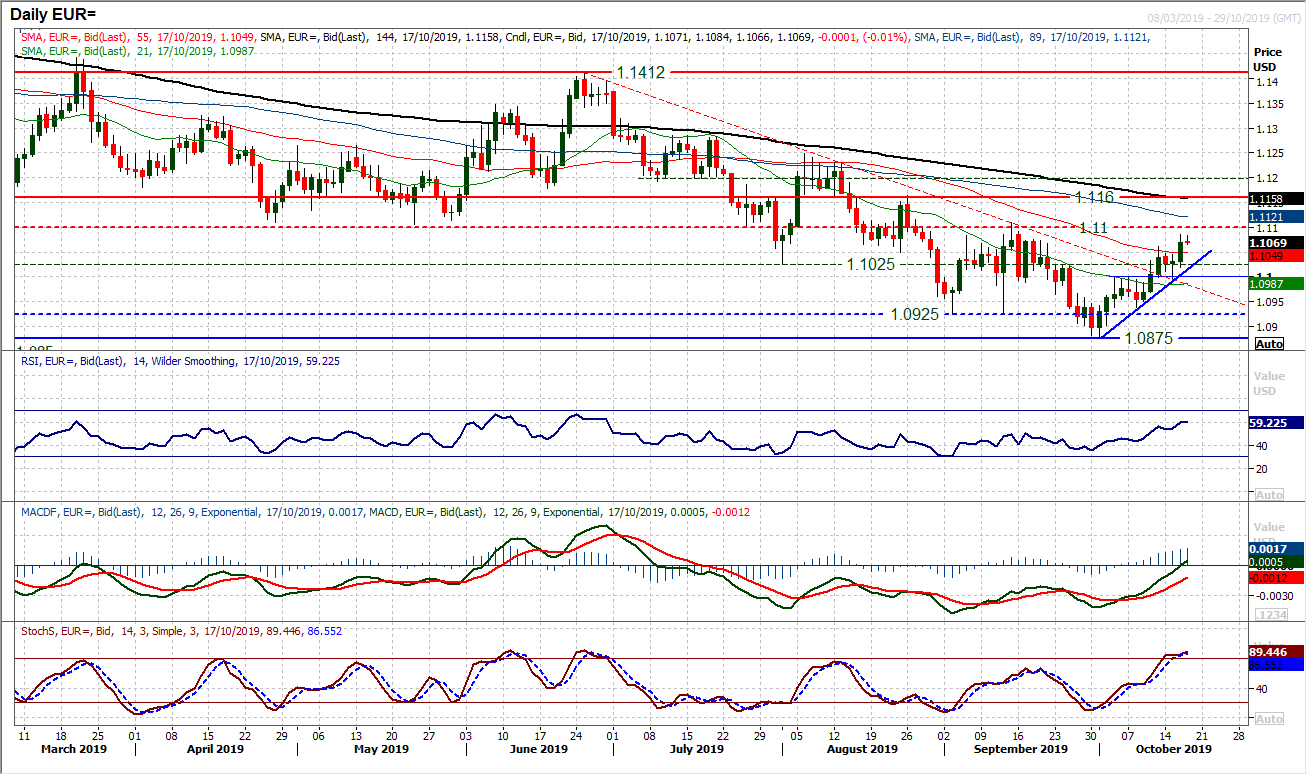
The euro had been stuttering in recent sessions, but has taken another shot in the arm with progress in the Brexit process. Technically this has bolstered the developing two week uptrend, but yesterday’s decisive bull candle has now taken the market clear of the $1.1000/$1.1025 range which had become a sticking point. Breaking above $1.1060 (last week’s high) also now opens the real test, the resistance at $1.1100. This old low from April/May became key resistance throughout September and would be a signal for a crucial shift in euro sentiment. It is the first key lower high and a breach would confirm that a new positive medium term trend would be developing. This improvement is reflected in the momentum indicators, with RSI into the 60s and multi-month highs. MACD lines are accelerating higher towards neutral and Stochastics are above 80. Intraday weakness is now a chance to buy, with the hourly chart showing support between $1.1020/$1.1060 and within that underlying demand at $1.1040. There is a key higher low within the recovery at $1.0990 now. A decisive close above $1.1100 opens $1.1160 and more importantly $1.1250.
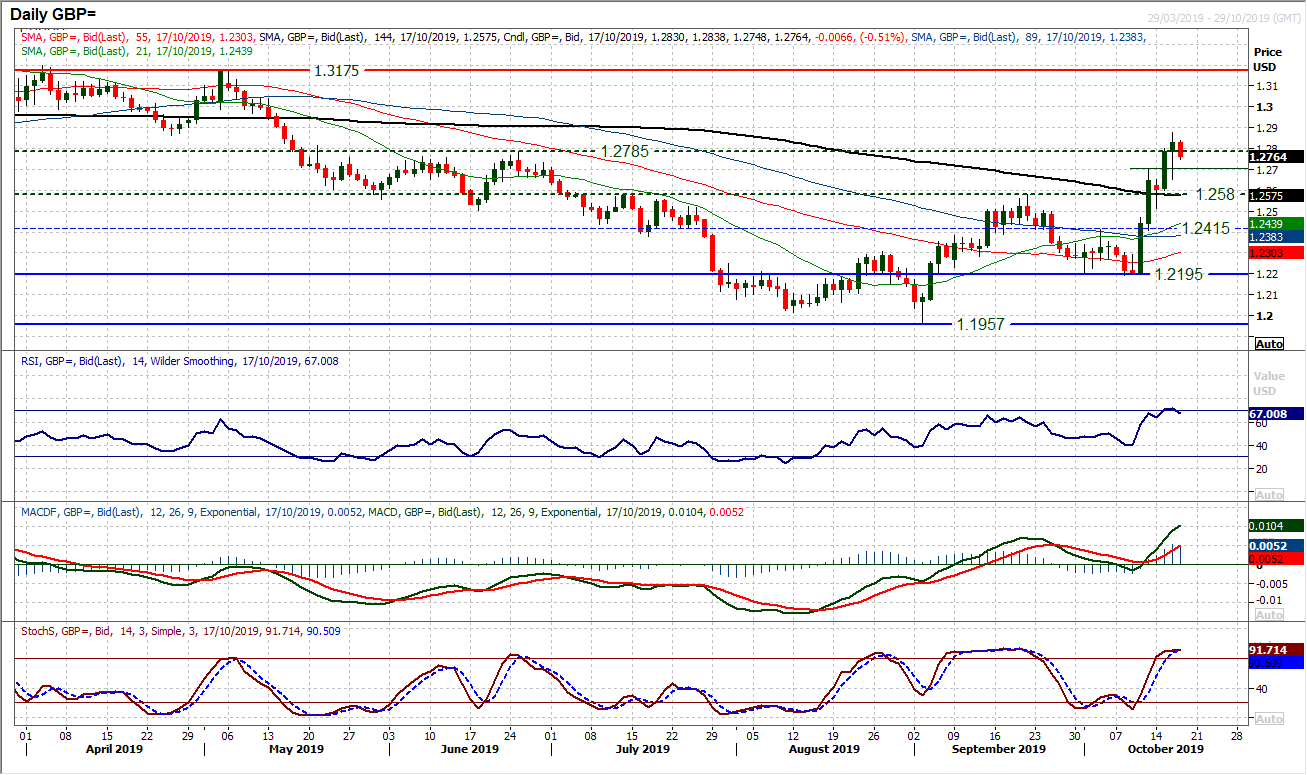
Another session of significant volatility on sterling left Cable on a wild ride of a 220 pip rebound from the day low to close with a further 45 pips up of the day. Closing through $1.2780/$1.2800 resistance area now opens moves towards the $1.30s. There is an old basis of support around $1.3000 from March with the next key reaction high at $1.3175 meaning a band of resistance $1.3000/$1.3175. However the move is fuelled by the politics of Brexit right now. This could easily come crashing down this morning if the EU Council do not get to discuss a new Brexit deal proposal. Weakness has been bought into repeatedly in recent sessions, with the hourly chart showing the rising 55 hour moving average (this morning at $1.2745) repeatedly capturing intraday corrections for the past three sessions. Resistance initially at $1.2875 from yesterday’s high, but as we have been discussing throughout this week, if the politics change again, then technical levels will not matter one jot. Yesterday’s low at $1.2645 is the latest higher low.
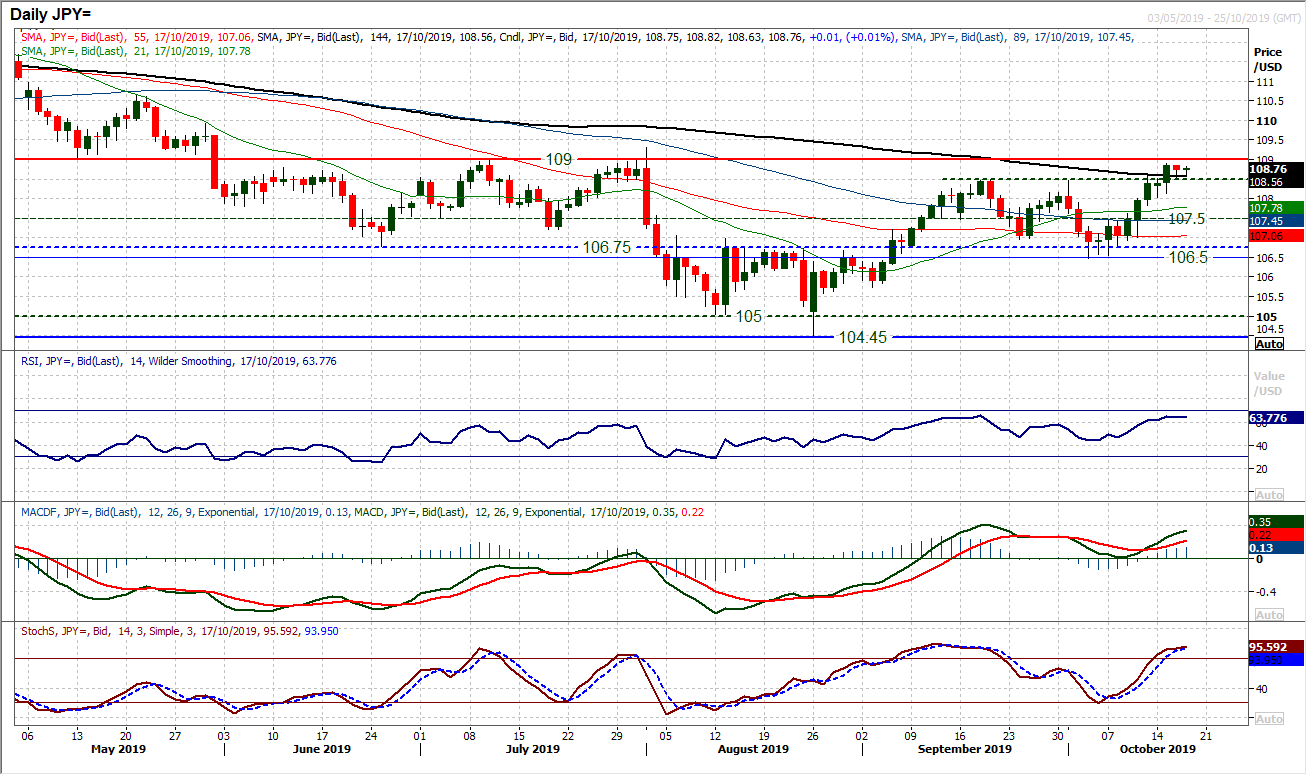
Having broken out above 108.50 a move to test the key medium term pivot level at 109.00 is on. Yesterday’s mild negative candle has done little to change the outlook on this, so far. Momentum indicators remain strongly configured (although not as strong as they have been), with the RSI into the mid-60s, whilst MACD lines track higher above neutral and Stochastics hold above 80. Near term weakness is now a chance to buy. The hourly chart shows a band 108.40/108.60 around the108.50 old September highs from the daily chart. The bulls would remain in control whilst the support at 108.00 remains intact. Pressure is still building towards testing 109.00 and a breakout would be the real confirmation of a change in medium to longer term outlook. The one question though, is with the dollar struggling elsewhere, would a breakout above 109.00 be a step too far?
Gold
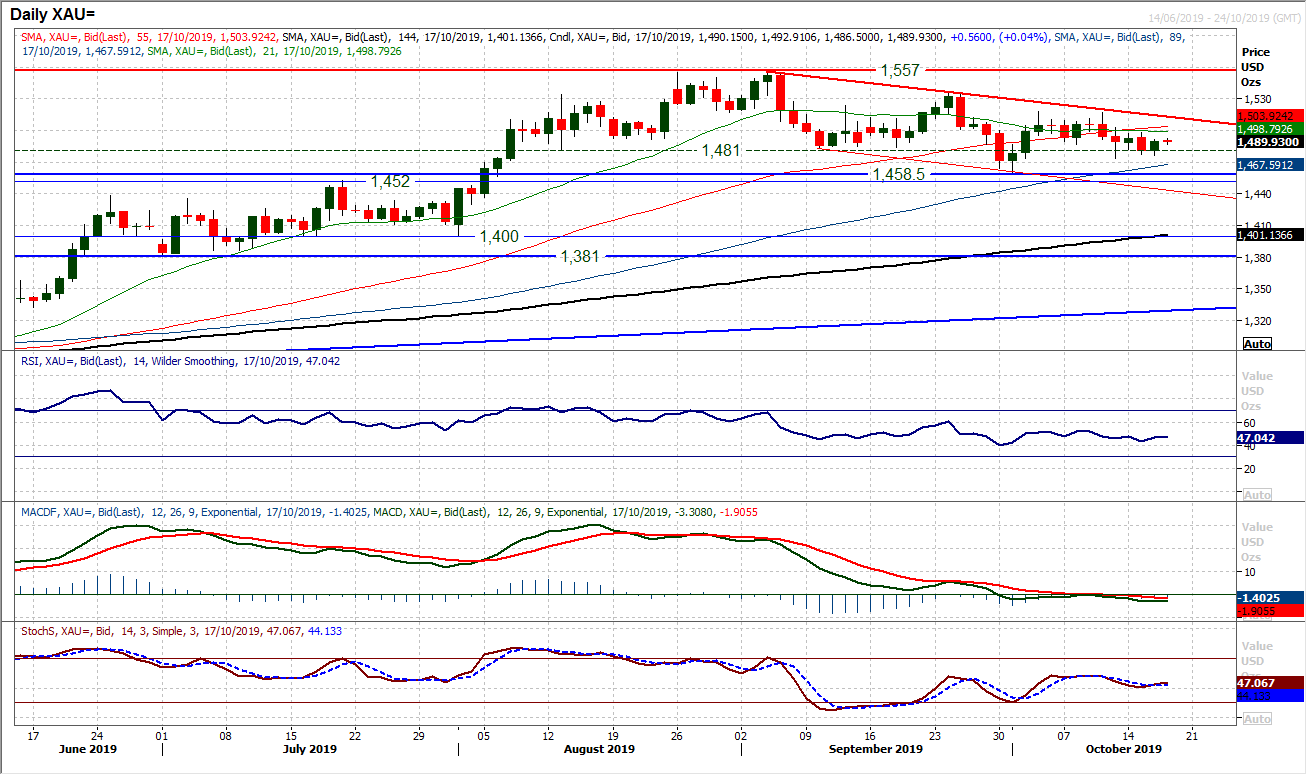
The uncertain outlook for the US dollar (heightened since the disappointing retail sales data) helped to support gold. The outlook for the yellow metal subsequently remains rather clouded within the medium term range. However, there continues to be a mild negative bias that is holding within the range as gold is now consistently trading under $1500. Despite this though, there remains an appetite for the bulls to defend the old support around $1481 even in the midst of this apparent negative drift. Momentum indicators are reflective of all of this, with the RSI a shade under 50 and MACD lines a shade under neutral, but they all lack any conviction. The key resistance remains the highs of the past couple of weeks at $1518.50 but the longer that the market sits under $1500 there will be growing negative pressure. A close under $1481 would open the $1458.50 key September low.
WTI Oil
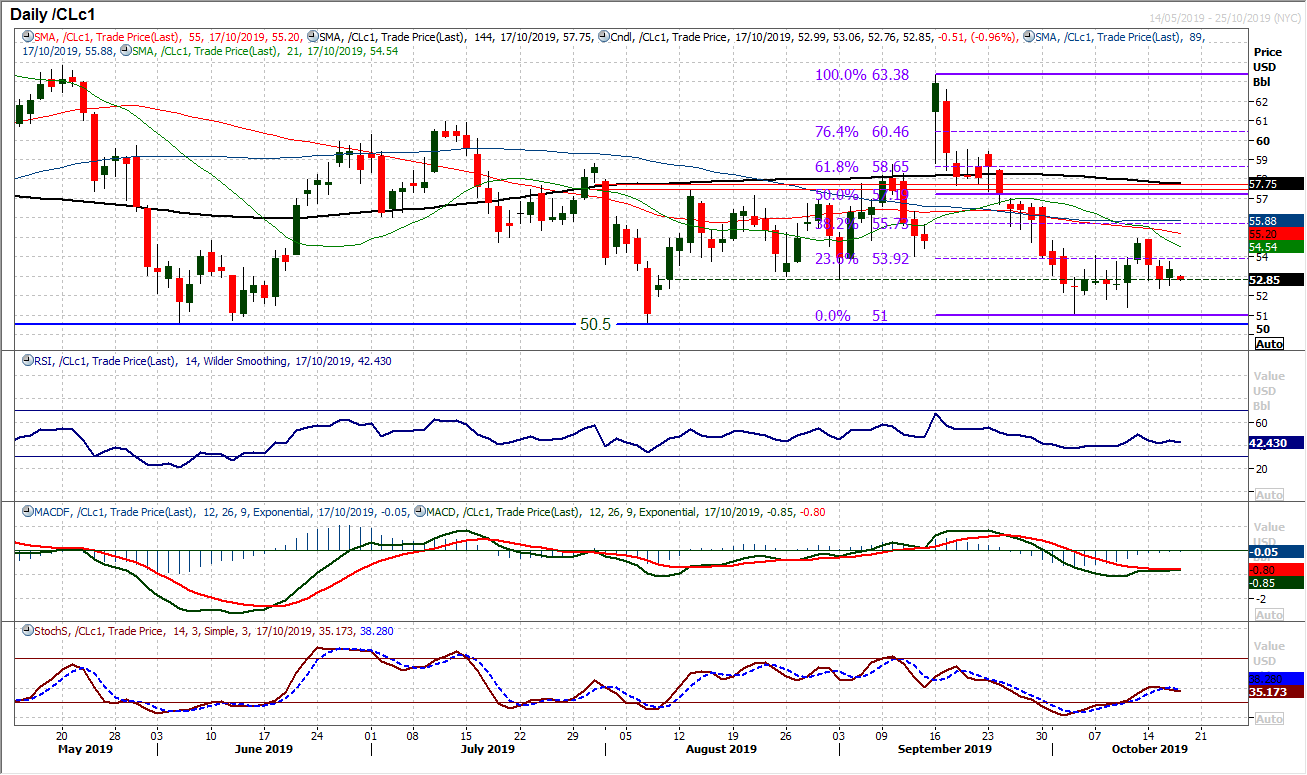
The renewed selling pressure has just eased in the past 24 hours or so, with the daily chart showing a small positive candle. This sees the market again forming a consolidation around the old August/September lows at $52.85. For about a week earlier in October the market seemed to gravitate around $52.85 and again this seems to be a consolidation area. Momentum indicators on the daily chart are holding ground now rather than showing any real sense of direction. This is similar to the hourly chart where neutral configuration has formed. It seems to be that WTI is a market waiting for a catalyst now. A mini range has come between $52.50/$53.75in the past few sessions and hourly momentum has been lacking conviction. A close either side of this mini band could provide some idea of direction. Key support remains $50.50/$51.00, with the bull failure at $54.90 a key resistance now.
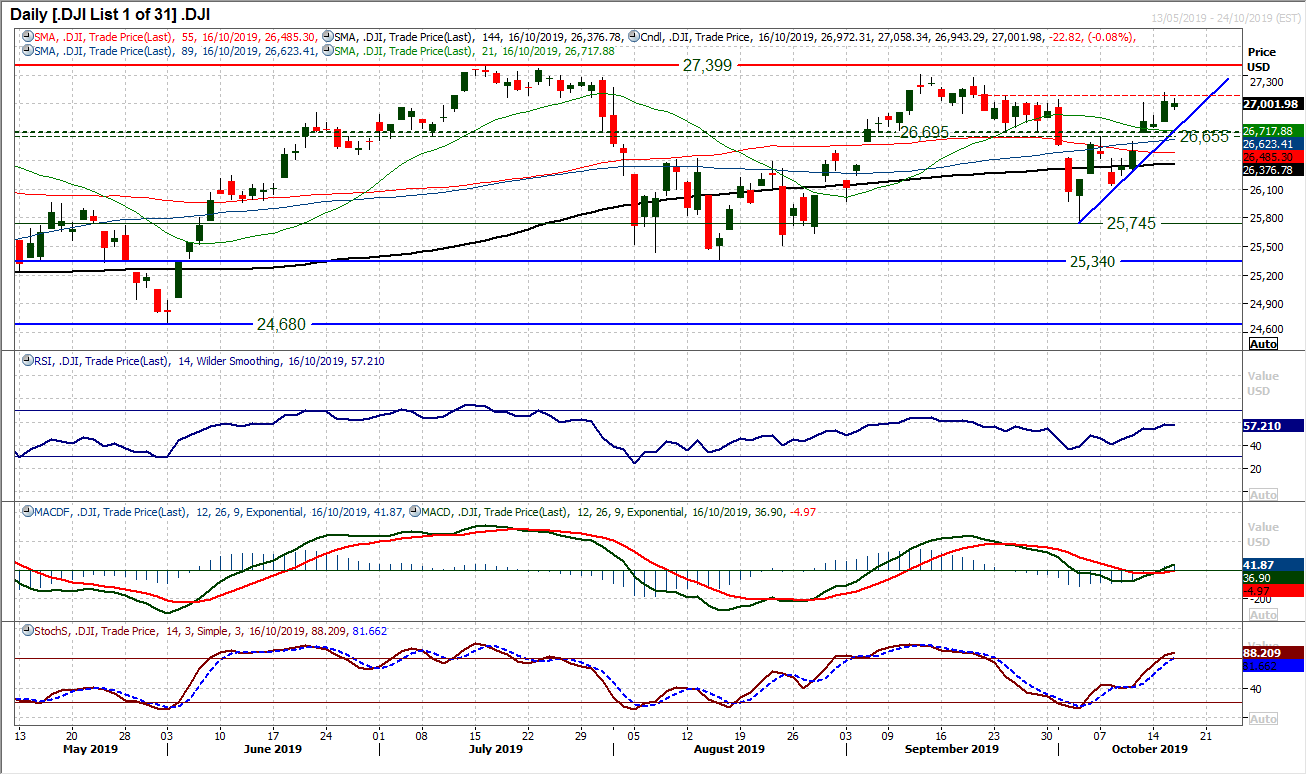
A slight pause for thought for the bulls as the Dow closed marginally lower last night. However, this has done little to change the current positive outlook. The uptrend of the past two weeks is holding firm and is now rising today at 26,835 which is safely above the 26,655/26,695 medium term pivot band support. There is a continued improving configuration for momentum, with RSI in the high 60s, MACD lines beginning to edge above neutral and Stochastics edging above 80. The only minor caveat is that the old late September highs (27,045/27,080 remain a basis of resistance. With the intraday failure at 27,120 on Tuesday, this means a band of resistance 27,045/27,120 now. This needs to be cleared on a closing basis to open the all-time highs again, at 27.399. We still look to buy into weakness for what is likely to be a test of the highs.
"""DISCLAIMER: This report does not constitute personal investment advice, nor does it take into account the individual financial circumstances or objectives of the clients who receive it. All information and research produced by Hantec Markets is intended to be general in nature; it does not constitute a recommendation or offer for the purchase or sale of any financial instrument, nor should it be construed as such.
All of the views or suggestions within this report are those solely and exclusively of the author, and accurately reflect his personal views about any and all of the subject instruments and are presented to the best of the author’s knowledge. Any person relying on this report to undertake trading does so entirely at his/her own risk and Hantec Markets does not accept any liability. """
