Market Overview
The spread of the Coronavirus will continue for days/weeks to come. The death toll has gone above a hundred in China and the economic impact on the world’s second largest economy is difficult to predict right now. It is interesting though that the World Health Organisation (the WHO) continues to refrain from declaring the Coronavirus as a global health emergency.Financial markets are often quick to price in events, and there are signs of stability starting to creep back in this morning.The United States 10-Year Treasury yield held up above 1.600% yesterday and has ticked slightly higher this morning. The flow into safe haven assets such as the yen and gold has also threatened to dry up. Equity indices which felt significant selling pressure yesterday are seeing futures edging back higher today. However, there is a caveat in that markets looked to stabilise early last week before a significant bout of selling kicked in. This suggests caution is still required.The Federal Reserve kick off its two day FOMC meeting today and this could also begin to play into the consolidation.Wall Street closed sharply lower yesterday with the S&P 500 -1.5% at 3243. However, with US futures rebounding by +0.6% today this is helping to steady the selling early today. The Nikkei 225 was -0.6% lower early today whilst in Europe the outlook is looking brighter with FTSE 100 Futures +0.4% and DAX Futures +0.5% higher.In forex there is something of a mixed mood. Selling through AUD and NZD is far less pronounced whilst CAD is up and the safe haven JPY is giving up some of its gains. In commodities, in keeping with the more encouraging risk environment, gold is back lower by -$4, whilst oil has rebounded from early losses and is now around flat on the day.There is a big US focus to the economic calendar today. We start with US Durable Goods Orders at 1330GMT which are expected to see the adjusted ex-Transport number to grow by +0.1% in December (after a decline of -0.1% in November). The S&P Case-Shiller House Price Index is expected to increase to +2.4% for November (from +2.2% in October).The big data focus for today is the Conference Board’s Consumer Confidence for January at 15:00 GMT which is expected to improve once more to 128.0 (from 126.5 in December) after having been a little sluggish in recent months. The Richmond Fed Business Index is expected to improve slightly to -3 in January (from -5 in December).Chart of the Day – EUR/JPY
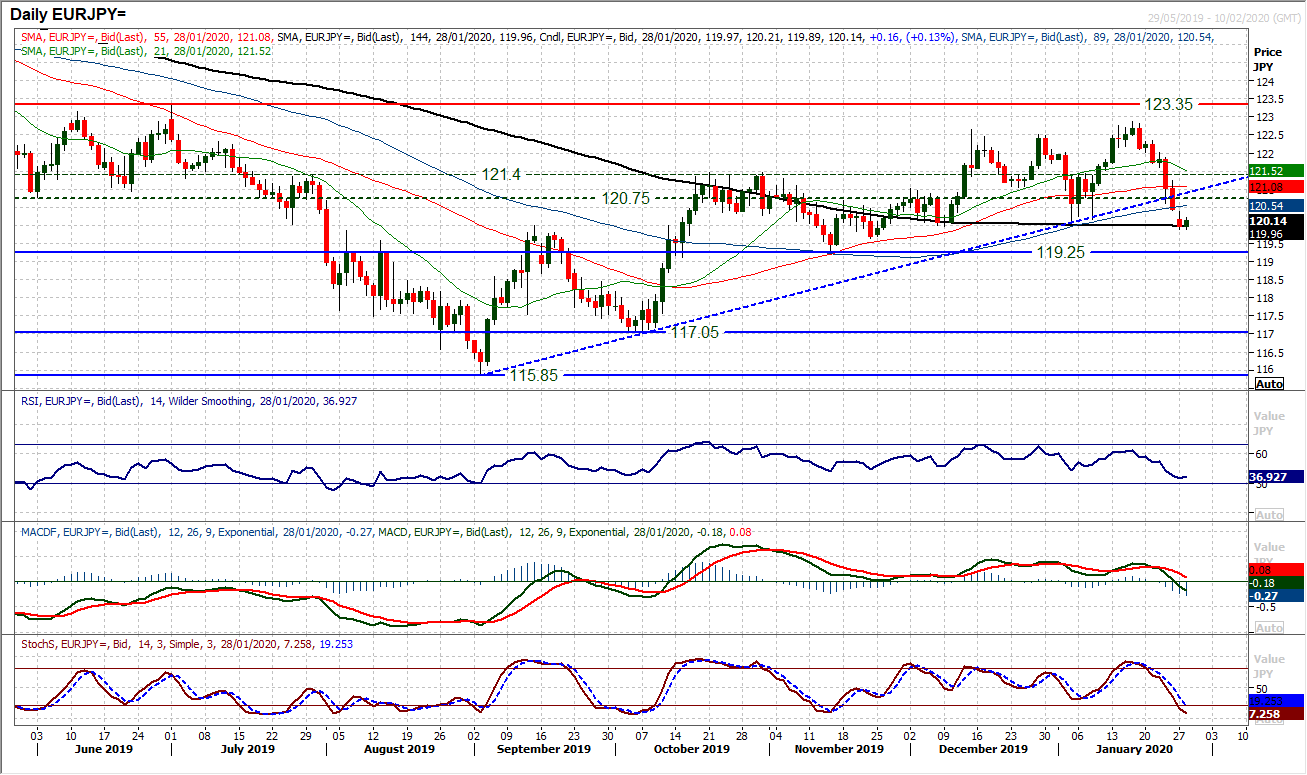
The flight to safety has come just as the euro has been hit by a dovish ECB. Flow into the yen has come as the euro has been pressured. Subsequently, the net impact on EUR/JPY has been for an accelerated sell-off. The move is now breaking some key technical levels in outlook changing moves. There has been a huge deterioration in outlook in just the past seven sessions, with hugely bearish candles. Breaking the support of a near five month uptrend on Friday, the market continued to decline and has now confirmed a breach of the first key higher low of the bull run. Coming with the RSI below 40 at a five month low, and acceleration lower on Stochastics, there is a new negative outlook taking hold. Rallies now look to be a chance to sell. There is a pivot band 120.75/121.40 but it was interesting to see yesterday’s gap down being bearishly filled at 120.40. Further weakness towards 119.25 is likely now.
EUR/USD
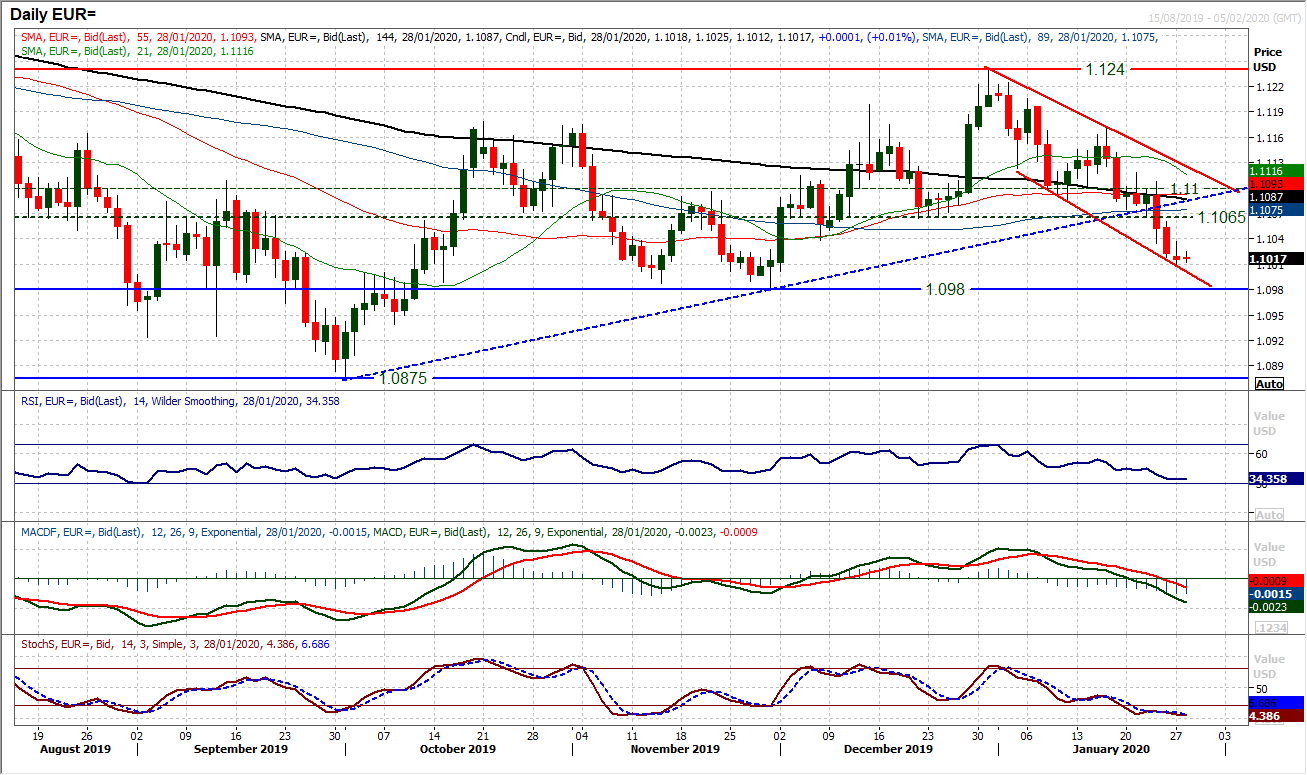
The outlook for EUR/USD has turned increasingly corrective in recent sessions. A run of negative candles where intraday rallies are sold into has taken the market to eight week lows. Negative momentum configuration is in place with the RSI mid-30s, MACD line falling below neutral and Stochastics stuck in bearish territory. There is an element of settling down early today and it may be that another near term low is forming. However, there is sizeable resistance of overhead supply $1.1065/$1.1100 to limit any real recovery and would be a source of a likely next selling opportunity within the four week downtrend channel. Pressure on $1.0980/$1.1000 looks set to be a feature of the coming days/weeks.GBP/USD
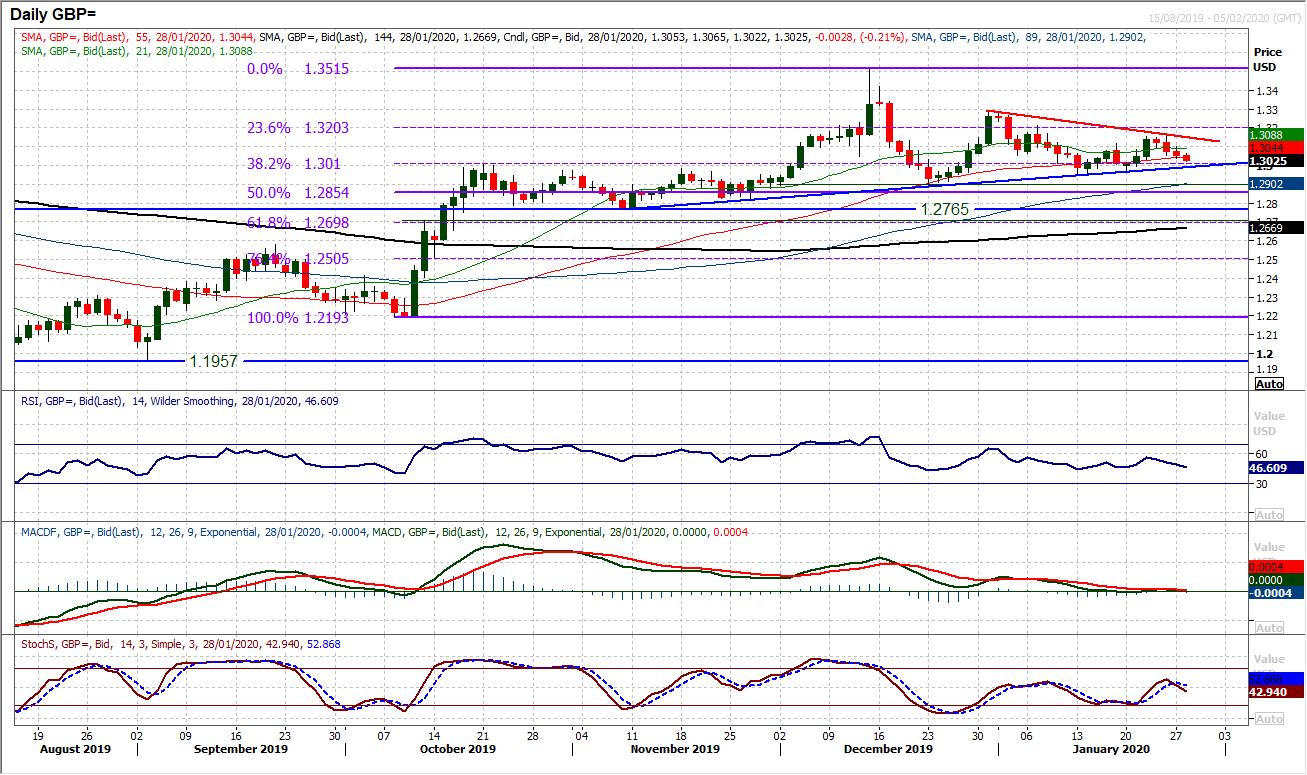
The rolling over on Cable has again seen another retreat which is again eyeing the support band $1.2900/$1.3000 that has been a consistent basis of a floor in the past eight weeks. Three negative candles in a row have added a near term negative bias but as yet, the outlook has not turned too negative, yet. Essentially, Cable has a mild bear bias within a medium term holding pattern. The lows and support come in between $1.2900/$1.3000, but the bull moves are failing (at lower levels) between $1.3170/$1.3285. Momentum indicators are broadly neutrally configured, with a slight bear skew, with the RSI still hovering between 40/55 whilst MACD lines hover around neutral. The near term bias is lower and would grow below $1.3030 and then open $1.2950/$1.2960. Resistance initially at $1.3100. This holding pattern could easily continue in front of the Bank of England on Thursday.
USD/JPY
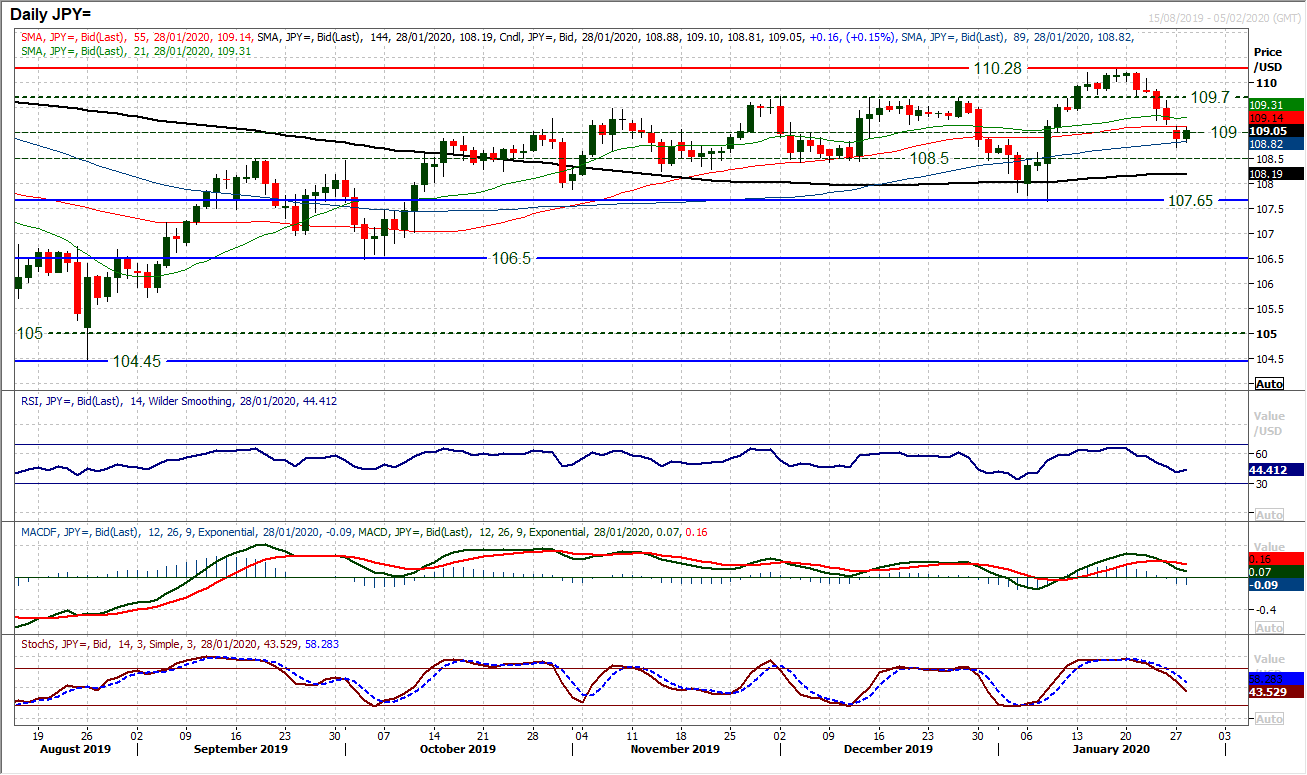
After a week of decisive selling pressure, are there signs of stability starting to form? A mild rebound during the Asian session brings the Europeans to the table looking at a small positive candle this morning. The market is still corrective and momentum indicators continue to slide but the hourly chart shows that since support formed at 108.70 more than 24 hours ago, there is more of a holding pattern developing. Given the degree of selling pressure throughout the past week where the market continued to decline, how the market now closes today could be an important turning point. There is resistance at 109.15/109.20 which is a near term gauge to watch. An old pivot and still an open gap from yesterday, a close above this resistance today would be a positive near term signal. Hourly indicators need to be watched too. The Hourly RSI pulling decisively above 60, whilst MACD lines decisively above neutral would be a real improvement. The has been support forming 108.70/108.80 now and if this can hold then the bulls have an argument at a recovery. 109.65/109.70 is then the next resistance.Gold
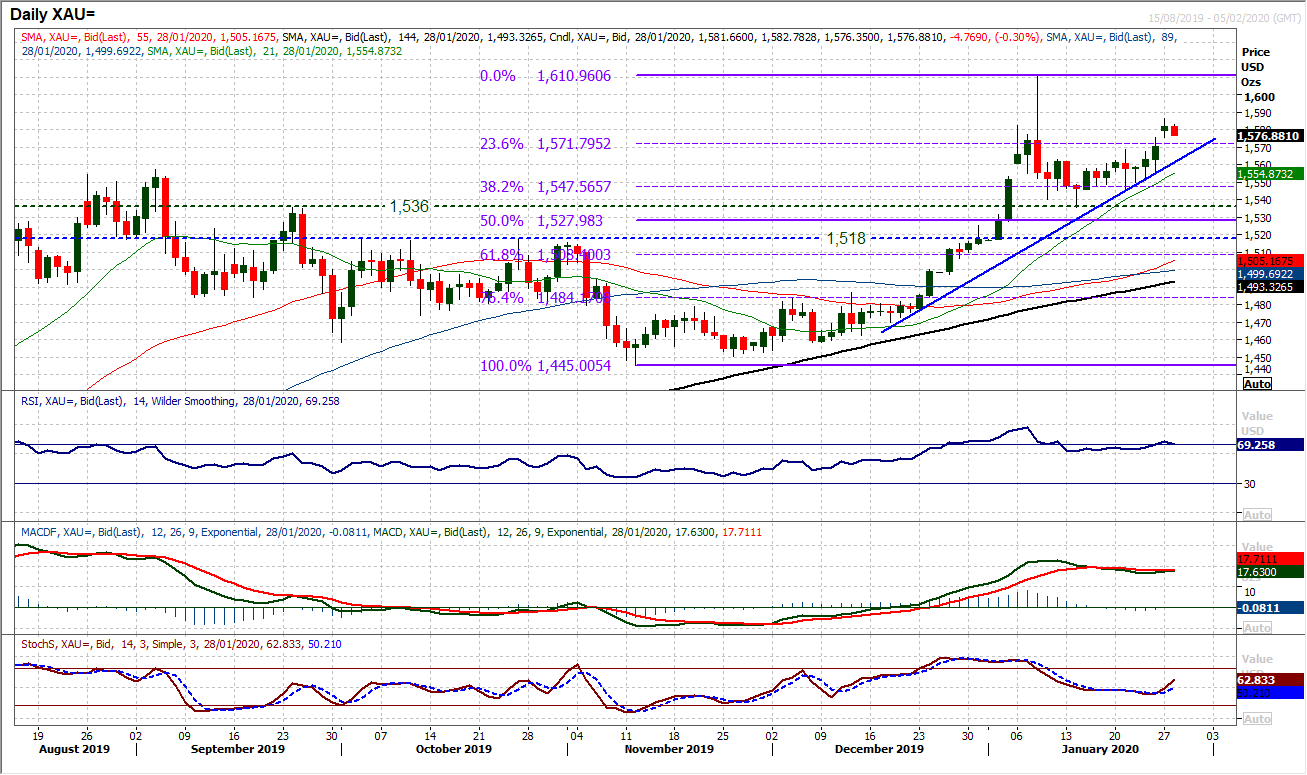
The breakout on gold is consolidating. Having closed above resistance at $1568 on Friday, yesterday’s gap higher was bullishly filled to continue to see gold close at its highest level since 2013. However, the immediate upside impetus I beginning to stall slightly. The move that has been running up the support of a now six week uptrend (which comes in at $1558 today) so there is room to buy into weakness. With momentum indicators now beginning to find traction in moves higher, this is a market finally finding its legs. The RSI is into the 70s again (having reached the mid-80s in early January) and even the sluggish Stochastics finally picking up. The hourly chart has just got a marginal unwind to take hold, but there is an ongoing positive momentum configuration. A near term buy zone comes in at $1568/$1575 now. A move above $1586 would re-open the multi-year high from early January at $1611 again.
WTI Oil
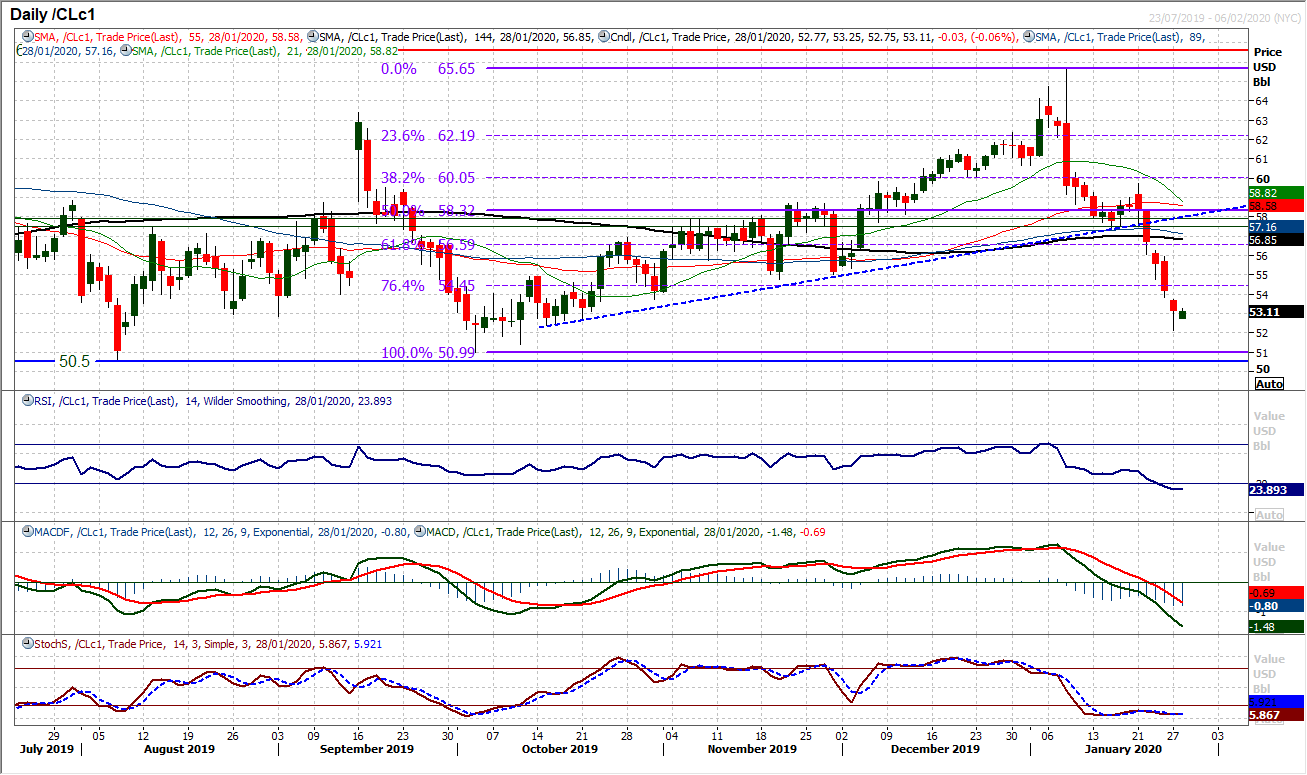
After such a mammoth sell-off in such a short space of time, there is likely to be some kick-back from the bulls at some stage. So how they respond to this morning’s mild rebound will be interesting. If the course of the past week there has been very little, even on an intraday basis, for the bulls to believe could be a recovery. With the daily RSI in the mid-20s (7 month lows), there is a degree of support forming in a stretched market. The hourly chart shows how the bulls have defended $52.15 over the past 24 hours, but now they need to start breaking resistance. Initially, this means $53.90/$54.75 is a barrier to overcome. However, closing with a bull candle today would also help. It is very early days, but for the first time in a week, there could be light at the end of the tunnel for the bulls. Crucial long term support on WTI comes in at $50.50/$51.00.Dow Jones Industrial Average
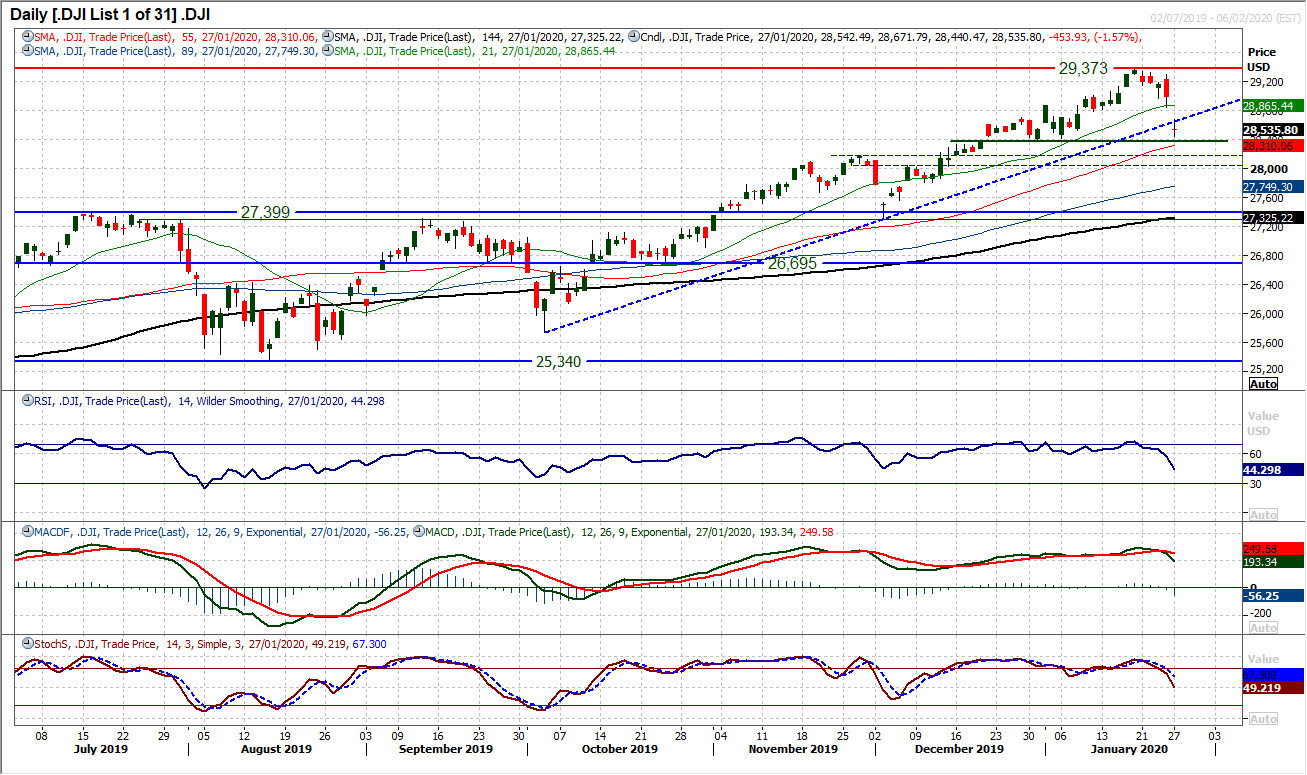
With the elevated fears of the Coronavirus, Wall Street had a lurch to the downside yesterday. A huge gap lower and a close at three week lows. The move has broken a three and a half month uptrend too. The question is now whether this is a move that begins a deeper correction. The important fact for the bulls is that the support of the first key higher low within the old trend higher remains intact. Support at 28,376 will be watched. Also, the Dow occasionally has these little blowouts. Very quick snap sell-offs which last two r three sessions before recovering. This happened early October and early December, and each time the bulls regathered themselves to go again. There is a gap open at 28,843 and how the market reacts to this gap now could be key. If it is left open then it could be a breakaway gap for the beginning of a correction. A doji candle in yesterday’s session suggests a degree of indecision too. A close below 28,376 would also suggest a bigger move lower.
DISCLAIMER: This report does not constitute personal investment advice, nor does it take into account the individual financial circumstances or objectives of the clients who receive it. All information and research produced by Hantec Markets is intended to be general in nature; it does not constitute a recommendation or offer for the purchase or sale of any financial instrument, nor should it be construed as such.
All of the views or suggestions within this report are those solely and exclusively of the author, and accurately reflect his personal views about any and all of the subject instruments and are presented to the best of the author’s knowledge. Any person relying on this report to undertake trading does so entirely at his/her own risk and Hantec Markets does not accept any liability.
