Market Overview
The Coronavirus continues to spread as the official cases topped 7700 yesterday with a death toll over 170. Markets are still not ready to price in the bottom. After some respite in the past couple of sessions (perhaps Fed related consolidation), once more the selling pressure is building again. Yields are falling and traders are moving into the safety of the Japanese yen, the US dollar and gold. Despite initially being supported by the slightest of dovish leans from the Fed (noting caution with the impact of the Coronavirus), equities are slipping back again today.China is still on its week-long Lunar New Year public holiday, but the yuan is sliding again. The Dollar/Yuan rate is again edging towards the 7.00 mark. With the commodity currencies (especially Aussie and Kiwi) under associated pressure, the expected 2020 risk rally has been set back.There will be a focus on the Bank of England today with markets undecided over the prospect of a rate cut. With wage growth holding up well, whilst employment and PMIs picking up this month, the data has at least not markedly deteriorated enough to explicitly warrant a rate cut. It is Mark Carney’s final meeting as BoE Governor, whilst fiscal support is expected in the Treasury’s Spring Statement and the Brexit log-jam has recently been released. Although interest rate swaps markets are pricing 50/50 chances of a rate cut, we believe the BoE will hold fire, at least for now. However, with the market on a knife-edge, whichever way the decision goes, someone will be disappointed and this means volatility will be elevated on sterling.Wall Street closed mixed last night with the S&P 500 losing earlier gains to close -0.1% lower at 3273. US futures have taken a leg lower today, currently around -0.9% lower. This has hit Asian markets with the Nikkei -1.7% lower, whilst also into the European session. FTSE 100 Futures are -0.9% and DAX Futures -1.1% to suggest it could be a rocky session for the bulls.In forex, risk aversion is back in play, with JPY outperformance, whilst AUD and NZD are key underperformers. GBP has slipped back to $1.3000 again on Cable ahead of the BoE.In commodities there is support for gold, rallying around +$5, whilst selling pressure is again hitting oil with around -1.5%.The Bank of England and US GDP are key for the economic calendar today. The Eurozone Unemployment rate is at 10:00 GMT and is expected to again be at 7.5% (7.5% in November). There is also a host of January sentiment gauges for the Eurozone at 10:00 GMT, with the Eurozone Economic Sentiment expected to increase slightly to 101.8 (from 101.5 in December), whilst Eurozone Industrial Sentiment is expected to improve slightly to -8.7 (from -9.3 in November) and Eurozone Services Sentiment expected to slip a touch to +11.2 (from +11.4).The Bank of England monetary policy decision is at 12:00 GMT. A rate cut is in the balance, but consensus is not expecting a move from +0.75% again. In Governor Carney’s last meeting it is expected to be a 6-3 split in favour of no change.The first look at Q4 growth comes with US Advance GDP at 13:30 GMT, which is expected to again be at +2.1% (+2.1% Final Q3 GDP).The US weekly jobless claims at 13:30 GMT are expected to be at 215,000 (slightly higher than the 211,000 last week).Chart of the Day – German DAX
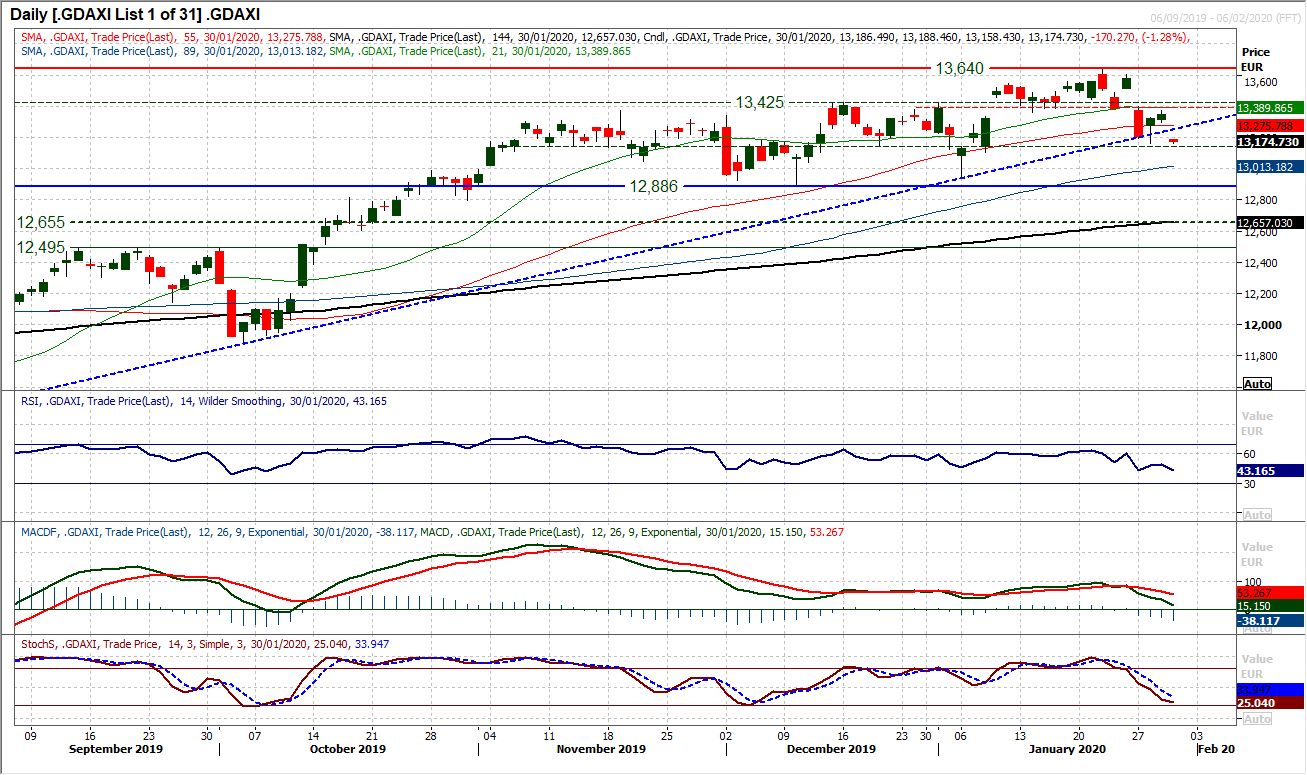
The bullish outlook for the DAX has taken a hit in the past week, and the medium to longer term trends are now under pressure. The corrective move back from what is now an all-time high of 13,640 had looked to stabilise in recent days but is once more seeing the sellers re-emerging this morning. A couple of positive candles have left initial support at 13,163 around what is now a five month uptrend is being breached. This early slide back this morning is another test for the strength of the bulls. The support of Tuesday’s low also marked around an old pivot level in the middle of the previous range 12,886/13,425 (around 13,140). A close below the uptrend c. 13,250 would be negative, but the bulls need to now build support above the pivot at 13,140 to maintain a degree of control. Losing the support of the pivot at 13,140 would open the 12,886 key low. Momentum indicators look mixed, with the RSI having unwound back toward the 40/45 level where the corrections of the past four months have all picked up. MACD lines are settling slightly above the neutral point suggest this could still be a buying opportunity once the bulls stabilise. The main caveat is that the Stochastics are still falling, so momentum is still near term looking corrective. Below 13,140 means the bull arguments begin to look increasingly dubious.
EUR/USD
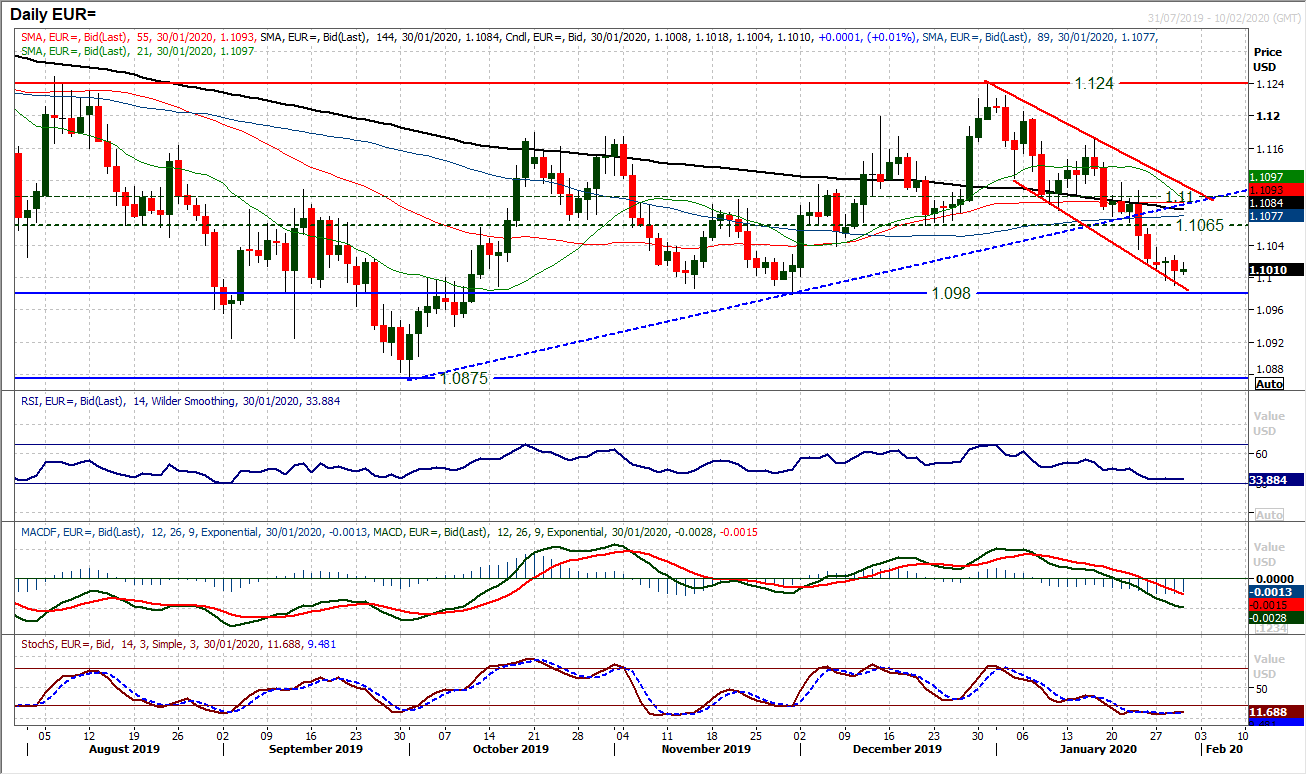
There continues to be pressure on the multi-month support around $1.0980/$1.1000, however, the selling pressure does look to be easing slightly. The FOMC meeting has passed with little fanfare and although the outlook on EUR/USD remains corrective, are there also encouraging signs for the bulls? It is still too early to say, as with RSI hovering in the low 30s, Stochastics in bear configuration and MACD lines falling, there is still little sign of buying pressure. Despite this though, the importance of $1.0980/$1.1000 will grow the longer it remains as a basis of support. There is still a downtrend channel and overhead supply in the area $1.1040/$1.1065. We also see rallies as a chance to sell (until the market can close decisively above the old pivot $1.1100). However, another early consolidation today suggests that the time for another rebound could be near.GBP/USD
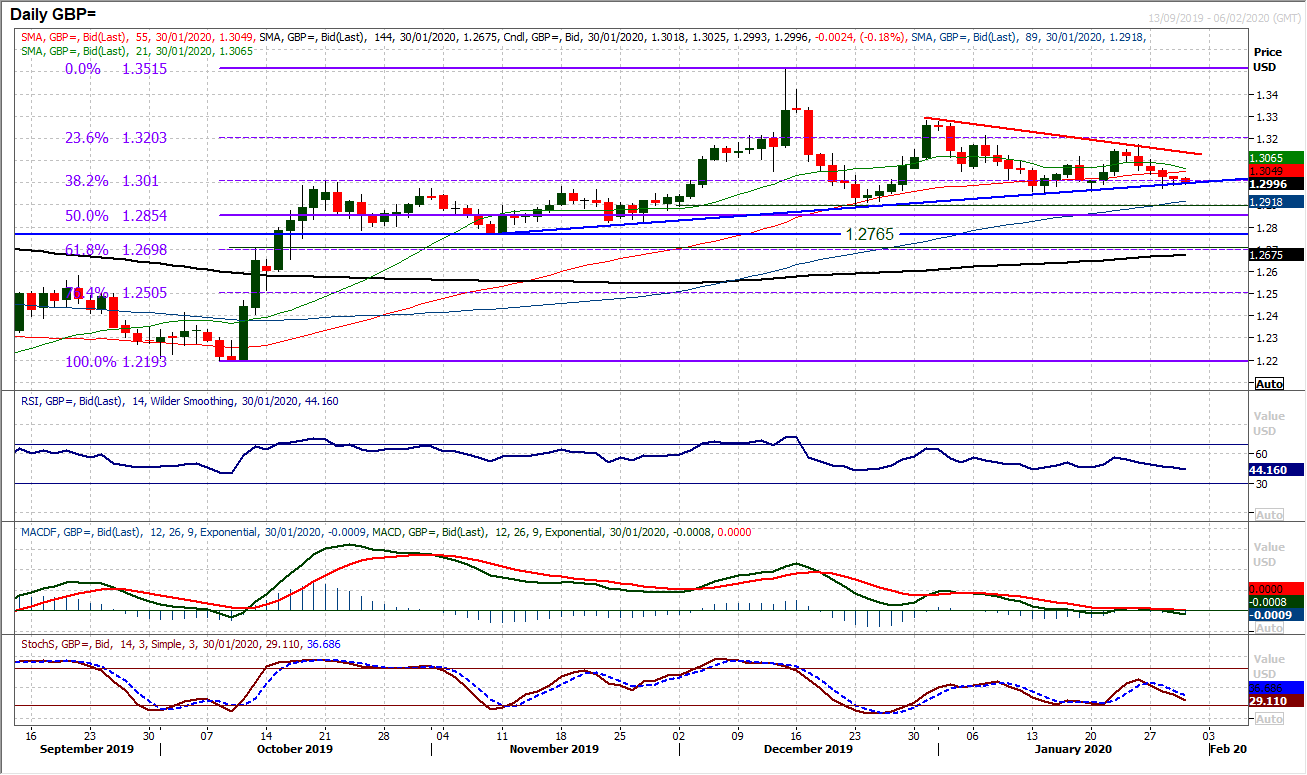
Cable closed lower again for a fifth straight negative candle. However, it is noticeable that as the market has retreated towards the old $1.2900/$1.3000 support band, the bulls have been happy to buy once more. The small bodies of the candles suggest that there is uncertainty. That uncertainty comes ahead of the Bank of England rate decision today (at 1200GMT). With the decision in the balance, there is likely to be volatility (and market direction) either way the BoE decides to go. Key levels to watch are with support at $1.2950 which has been January’s low, something that would be broken on a rate cut (which would still be unexpected). Below $1.29000 on a closing basis would be a key move. The BoE on hold and we look higher, with resistance at $1.3100, the $1.3170 key reaction high would be a key breach. Technically, Cable sits in neutral momentum configuration but with a slight negative bias (the US dollar has strengthened in recent days). This could be a key day for direction on Cable.
USD/JPY
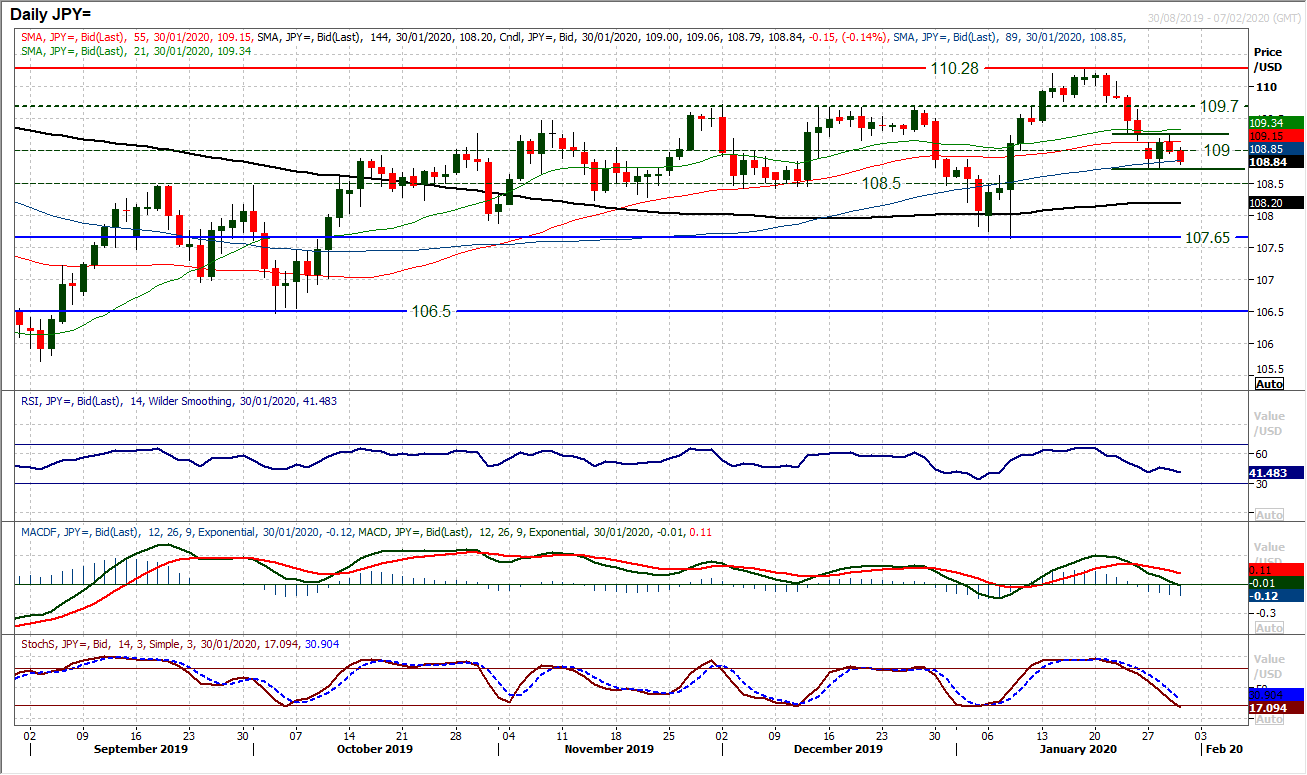
The settling of risk appetite along with broad US dollar improvement has helped Dollar/Yen to build support and a mini trading range. In the past few sessions, the market has held above 108.70 but been unable to move on above 109.25, to hover again around the old 109.00 pivot. It seems that this is a holding pattern for now and a closing breakout (either above or below) could become a key and directional move. It had looked on the Fed decision that the market was ready to finally “close” the 109.15 gap. However, another bear fill gives the market a slight negative bias this morning. Momentum indicators are gradually settling down following their recent lurch lower, but again, more in a holding pattern, (especially on RSI and MACD), where this could become a halfway house for a renewed sell off. A close below 108.70 opens 107.65. The bulls need a close above 109.25 to build recovery momentum.Gold
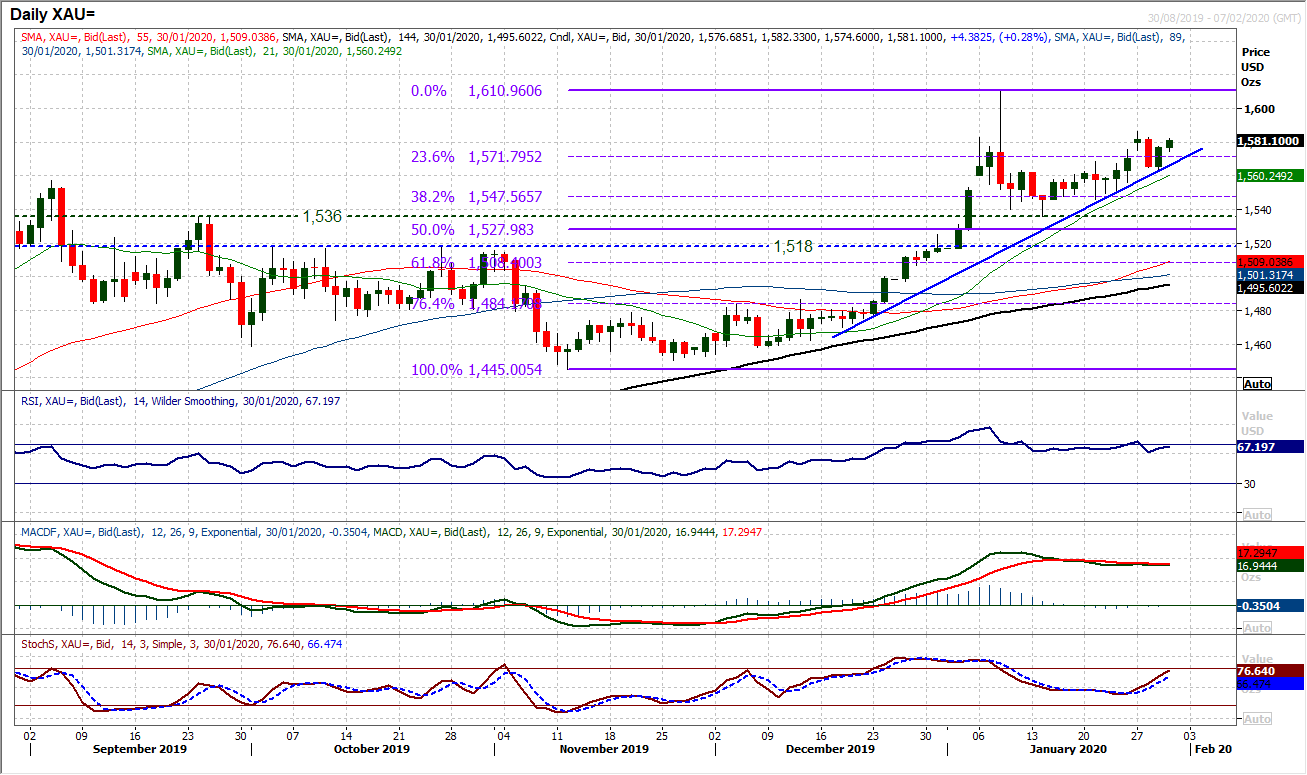
Tuesday’s sharp corrective candle looks to have been that buying opportunity. The outlook for gold has been positive since mid-December and we continue to look towards weakness to be bought into. A six week uptrend is again the basis of support with yesterday’s solid bull candle re-asserting the outlook. The importance of a confluence of support with the $1562/$1568 breakouts along with the six week uptrend at $1566 today is adding to this. A move back above the 23.6% Fibonacci retracement (of $1445/$1611) at $1572 is also a positive sign. As long as there is support of $1548 from the 38.2% Fibonacci retracement (of $1445/$1611) intact then the bulls will remain confident. Momentum indicators remain positively configured to buy into weakness still. A close above $1586 re-opens the high of $1611.
WTI Oil
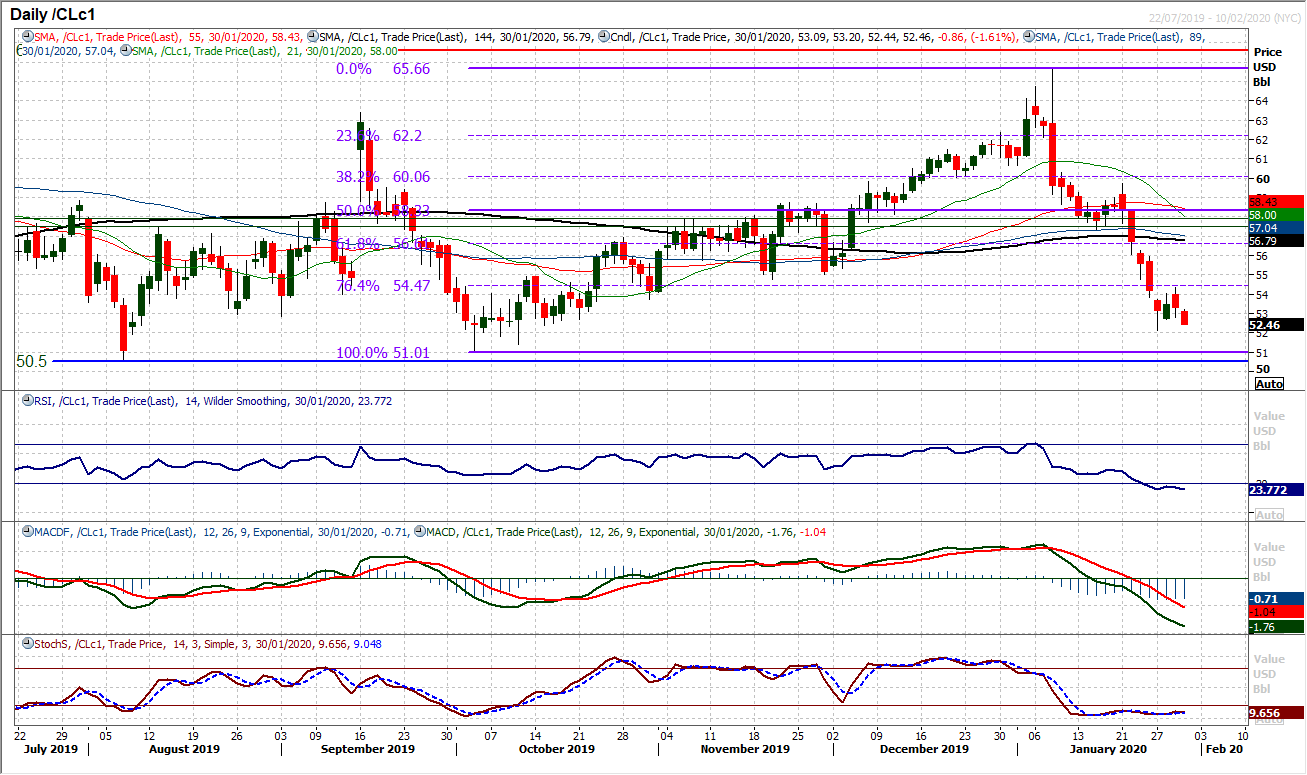
With oil under pressure already from the Coronavirus, it really did not need a surprise EIA crude inventory build yesterday. A resulting bear candle and further weakness today suggests the outlook remains negative. Momentum indicators remain bearishly configured to suggest continuing to sell into strength. The fact that in the month of January, there have only been 4 positive candlesticks (out of 19) say that even intraday rallies are an opportunity. The rebound failing at the 23.6% Fibonacci retracement (of $51.00/$65.65) at $54.45 plays into this too and suggests ongoing pressure on $52.15 and the key lows $50.50/$51.00.Dow Jones Industrial Average
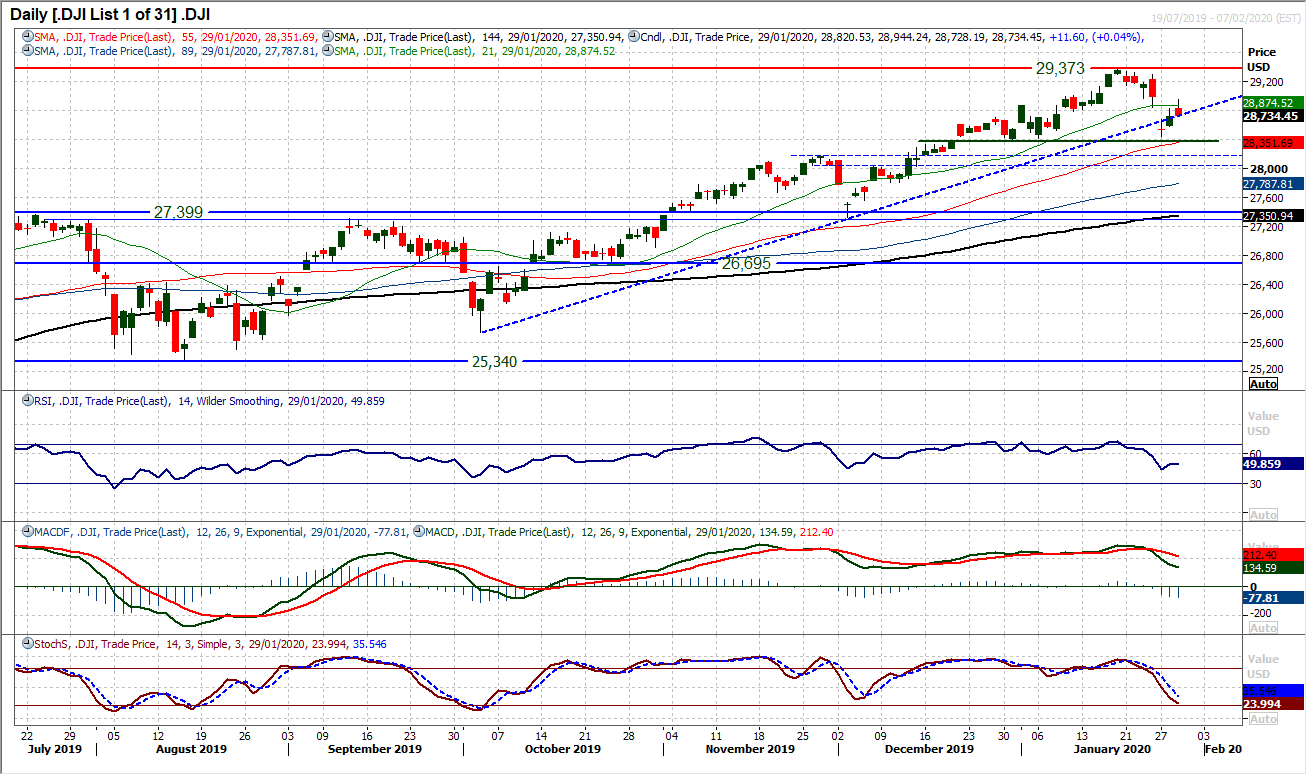
The impact of the Coronavirus continues to have a wavering impact on market sentiment. However, what is noticeable is that the bulls are o longer in control on equities. The Dow topped out at 29,373 a couple of weeks ago and there is now a corrective outlook. This outlook is now being bolstered by the move to bear fill Monday’s gap (at 28,843) as the market dropped back into the close last night. With futures pointing lower again today, this opens the prospect of a multi-week head and shoulders top pattern now. The support around 28,375 is key to this. Having held the initial test on Monday a failed rally (to form a right hand shoulder) as the three and a half month uptrend has broken will be a concern for the bulls. Looking at momentum indicators also struggling, a closing breach of 28,375 would be a key breakdown. Resistance at 28,945 (yesterday’s high) is now increasingly important as a potential lower high. The hourly chart shows a corrective configuration with hourly MACD setting to fail around neutral and RSI around 50. The corrective forces are growing.
"""DISCLAIMER: This report does not constitute personal investment advice, nor does it take into account the individual financial circumstances or objectives of the clients who receive it. All information and research produced by Hantec Markets is intended to be general in nature; it does not constitute a recommendation or offer for the purchase or sale of any financial instrument, nor should it be construed as such.
All of the views or suggestions within this report are those solely and exclusively of the author, and accurately reflect his personal views about any and all of the subject instruments and are presented to the best of the author’s knowledge. Any person relying on this report to undertake trading does so entirely at his/her own risk and Hantec Markets does not accept any liability. """
