Market Overview
The market response to the impact of the Coronavirus is maturing. It seems as though the authorities on the Chinese mainland have started to gain a degree of control, as new cases and daily increase in deaths are stabilising. However, markets are looking past this apparent good news now. The outbreak fears are increasingly international, with Korea, Iran and even Italy requiring a significant response as they struggle to contain the spread. Financial markets are taking real concern for implications of economic growth and safe haven plays such as bonds and gold are benefitting. Monetary policy response is being factored in as dovish, but longer term growth expectations are also being hit. Subsequently, we see yield curves flattening. The US 3 month/10 year spread is now -13 basis points, whilst the 2s/10s spread is at four and a half month lows. Forex markets are also beginning to differentiate far more between countries most acutely impacted. Whilst the commodity currencies such as Aussie and Kiwi are being hit due to their economic ties with China, it is the sell-off on the Japanese yen which is the starkest mover. There is a tendency for markets to over-react, so volatility will be the big winner here. The sharp rally on gold is also a key factor, with this morning’s gap higher coming with another bout of worrying COVID-19 headlines over the weekend. Equities are also increasingly threatened. The longer-term concerns are yet to be ascertained, but markets are making their move.
Wall Street closed with significant losses on Friday with the S&P 500 -1.1% at 3337, however, US futures are once more surging lower today by -1.5%. Asian markets have been broadly hit this morning (Nikkei closed for a Japanese public holiday) even though the Shanghai Composite was just -0.3% lower. In Europe, the outlook seems to be very negative with DAX Futures -2.0% and FTSE Futures -1.5%. In forex, there is a renewed strength and outperformance of USD, with JPY actually holding ground today. The commodity currencies are under the most pressure with AUD and NZD half a percent lower against the dollar. In Commodities, gold continues to soar higher, up around +1.8% (+$28), whilst oil is being hit hard, -2.5% lower.
Sluggish German growth and the impact on the Eurozone has been a key feature in recent weeks and this comes into focus on the economic calendar again today. The German Ifo Business Climate is at 0900GMT and is expected to slip back to 95.3 in February (from 95.9 in January). This move is expected to be driven by deteriorations on both components, with the Ifo Current Conditions to drop back to 98.6 (from 99.1 in January) and Ifo Current Conditions to fall to 92.2 (from 92.9 in January).
Chart of the Day – EUR/JPY
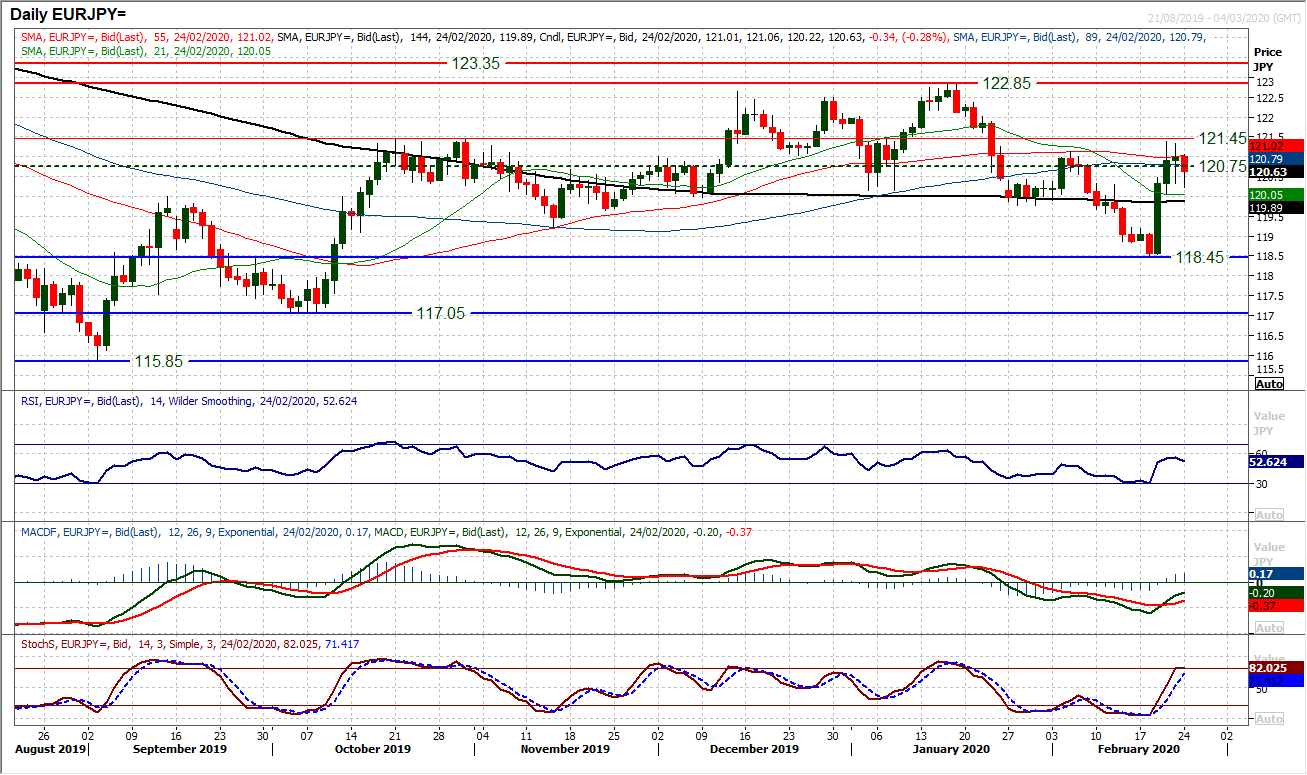
The yen has come under considerable corrective pressure in recent sessions. Coinciding with a rebound on the euro means that EUR/JPY has bounced considerably from its four-month low of 118.45. The move has now recovered back to around a key pivot resistance band between 120.75/121.45. This has been a turning area for the market on numerous occasions over the past 8 months. Is this again set to be a failure point for a rally? The strength of the recovery has really improved the outlook on momentum signals. The rise on Stochastics, RSI above 50 and bull cross on MACD lines suggest a key shift in market sentiment is building. However, already we can see the 120.75/121.45 band is a ceiling. Friday’s small-bodied uncertainty is turning back lower again today. Near term, momentum is faltering amidst hints of negative divergences on the hourly chart. So the bulls need to step up today. There is a support band 120.00/120.60 which will now signal the recovery is faltering is breached. This is a key test of the recovery now and the bulls need to prevent the renewed formation of bearish candles again. Trading back below 120.00 would be negative again. A decisive closing breach of 121.45 would suggest continued recovery towards the January high of 122.85.
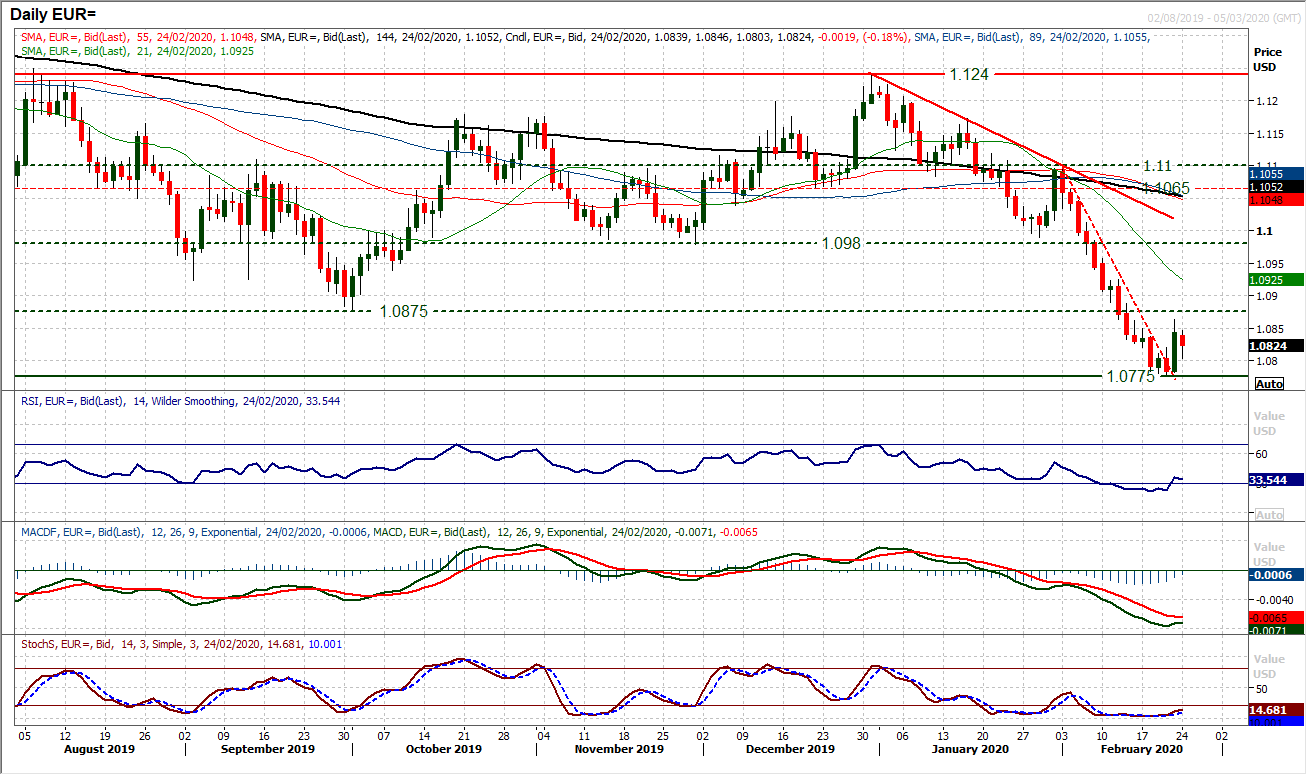
We have been looking for a euro technical rally for several sessions and finally, there was some kind of pressure release for the oversold position on EUR/USD. A strong positive candle added +60 pips and broke the sequence of selling pressure. Is this the buy signal we have been waiting for? It is too early to say. A two and a half week downtrend may have been broken, but aside from RSI above 30 (the most basic of buy signals on momentum), there is little confirmation yet. There need to be bull crosses confirmed on MACD and Stochastics, which is not the case so far. Today’s corrective slip back now needs to build support this morning, for a higher low (ideally above $1.0800) to help develop the support at $1.0775. The hourly chart shows how the resistance of an old low was a barrier on Friday at $1.0865, and this will now become a key resistance in the coming days if a rally is to take hold. Trading back above $1.0825 (the original resistance for a recovery) will improve again, whilst $1.0840 (overnight high) is also a level to watch. EUR/USD looks as though it could be a market in transition, but far more needs to seen first. Above $1.0865/$1.0875 opens $1.0980.
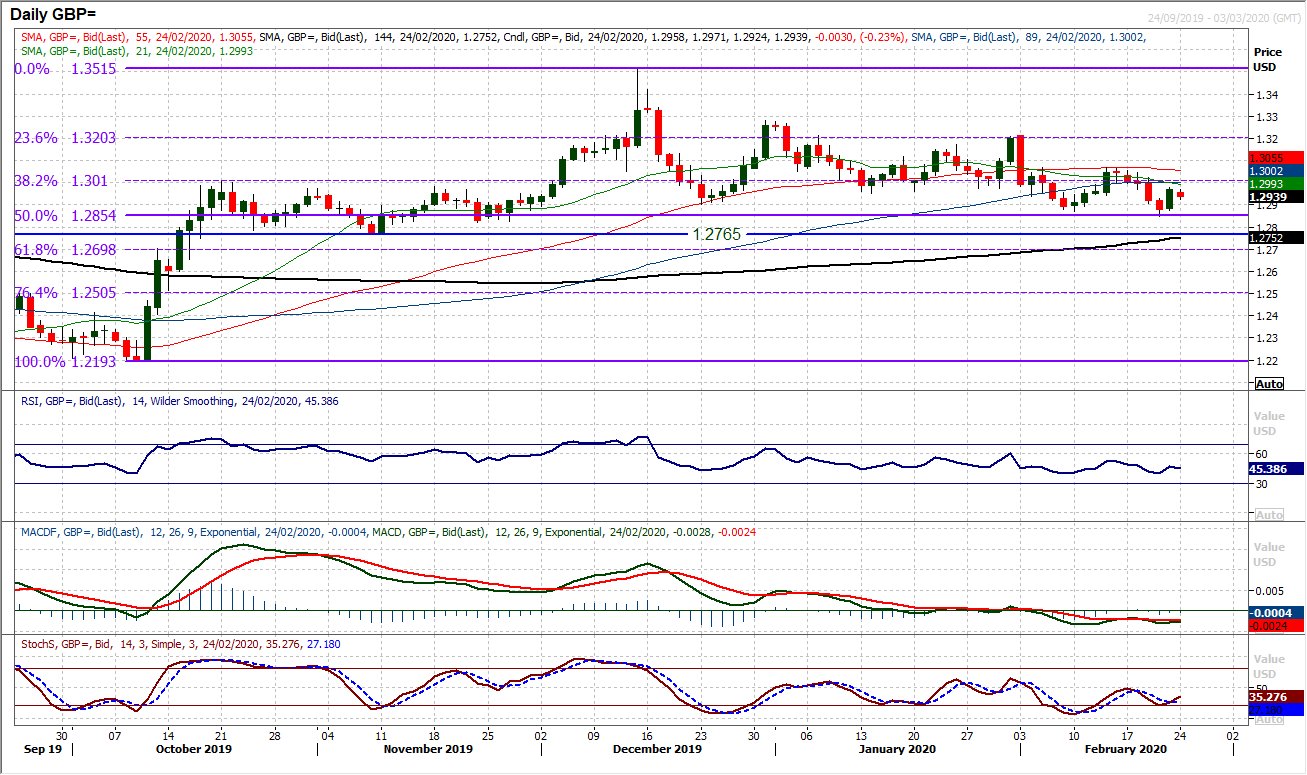
There is an increasingly negative skew to the outlook on Cable. Once more we saw a run of around a handful of sessions in one direction before a retracement move. This time, a bear run has ended with Friday’s decisive bull candle which added +90 pips. However, in the past few weeks, what had previously been a floor of support around $1.2940/$1.2960 is now consistently being breached and Thursday’s lower low at $1.2845 is the lowest level since late November. Lower highs (at $1.3070 in mid-February) and increasingly lower lows are now being formed. The market comes into the new week under short to medium term moving averages that are rolling lower (suggests growing deterioration) and momentum indicators increasingly struggling in corrective configuration. With an initial slip back this morning, Friday’s high of $1.2980 is initial resistance, now under the psychological $1.3000 and the 38.2% Fibonacci retracement (at $1.3010). And another failed rally under $1.3070 would put pressure back on $1.2845 again.
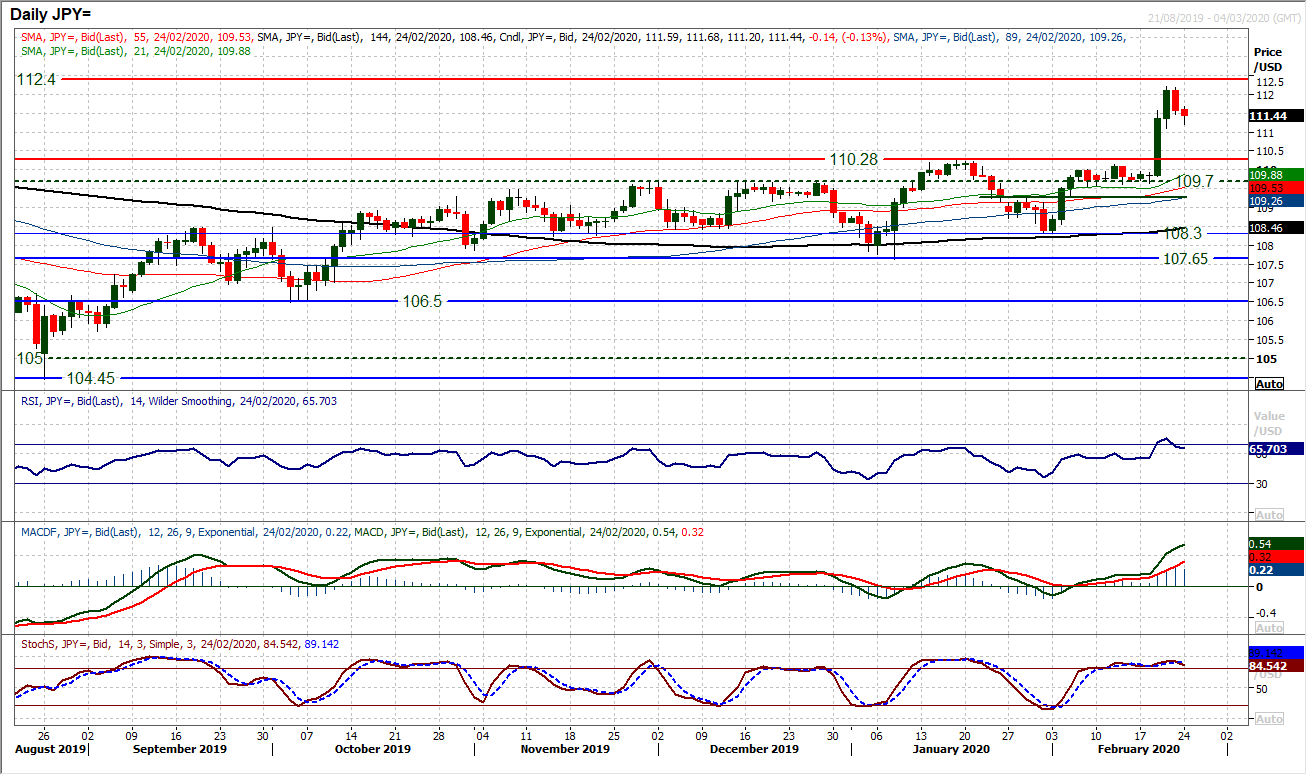
After months of false dawns and stunted bull runs, an incredible breakout on Dollar/Yen took the market soaring to a ten month high last week. Suddenly, we are seeing several days of two to three times the Average True Range (which is today at 54 pips). However, Friday’s retracement back of over -50 pips has left resistance at 112.20 in a move that has added strength to the long term key resistance at 112.40. The market is now threatening to unwind. The immediate question is over the support at 111.10/111.20 holding. If this is breached then the correction back could be quickly unwinding the market towards the 110.30 breakout. However, there is a battle for control now and coming into the European session, the bulls have fought back. There is still near term volatility to play out here but another negative candle today following such a strong move, could quickly tempt the profit-takers to move. An uncertain near term outlook.
Gold
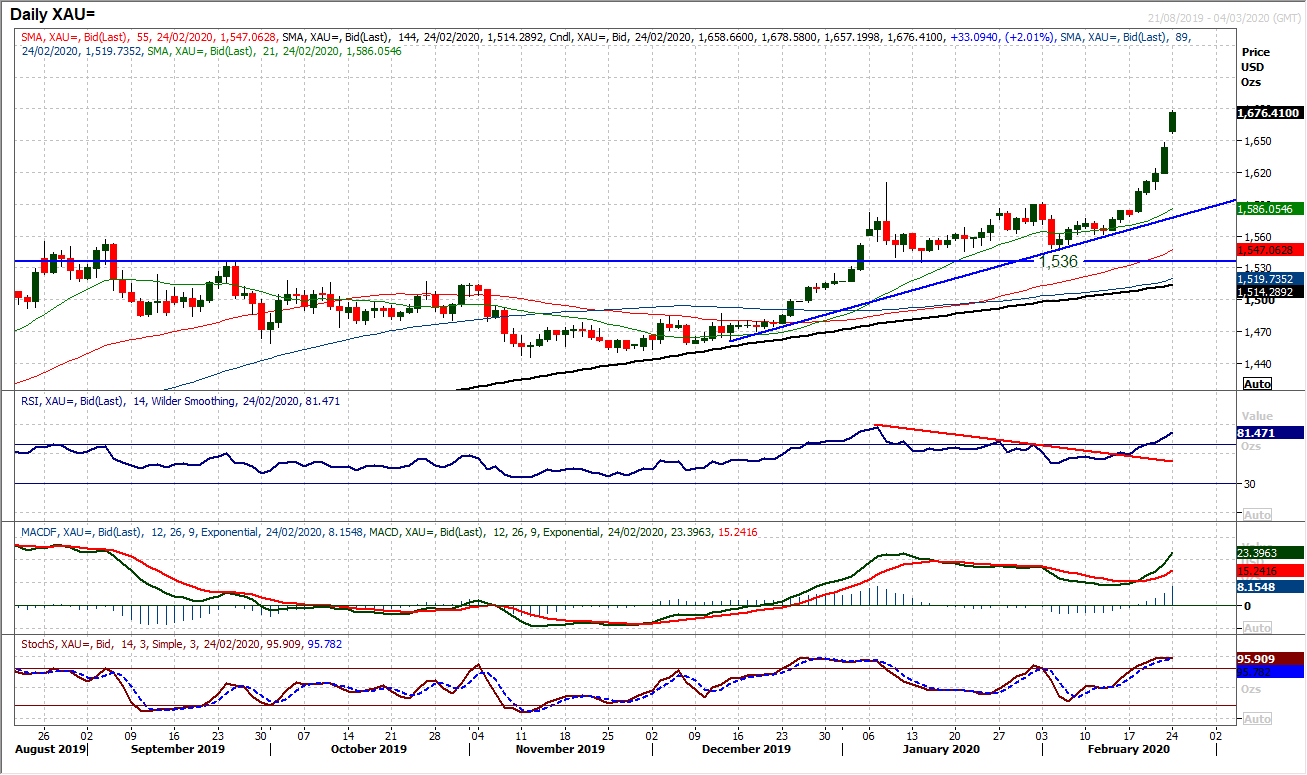
Gold has been accelerating higher in recent sessions in a move that has taken the yellow metal to levels not seen since 2013. Strong bull candles have burst the market through the $1611 previous resistance means that the January 2013 high of $1695 is the next resistance of any real note, before $1754. With the momentum of this move still strong, this is a run higher that has little to stop it right now. Momentum is very strong. The RSI is rising towards 80 now, but the January bull run saw the RSI above 90 (intraday), so this shows that once the bulls go, there is a real stampede. So, in any bull run we need to be careful of exhaustion signals. There is a gap this morning from $1649 (Friday’s high) which will need to be watched. The January bull run to $1611 culminated in an intraday spike higher before a retracement of -$75. The reaction to the gap at $1648 could be key today. For now, the hourly chart shows strong momentum and the bulls are still happy to support at the traded low today at $1657. If this begins to falter it could be an early signal to watch. For now we are happy to ride this bull move higher, but in extreme moves, there can often be counter moves to be wary of.
WTI Oil
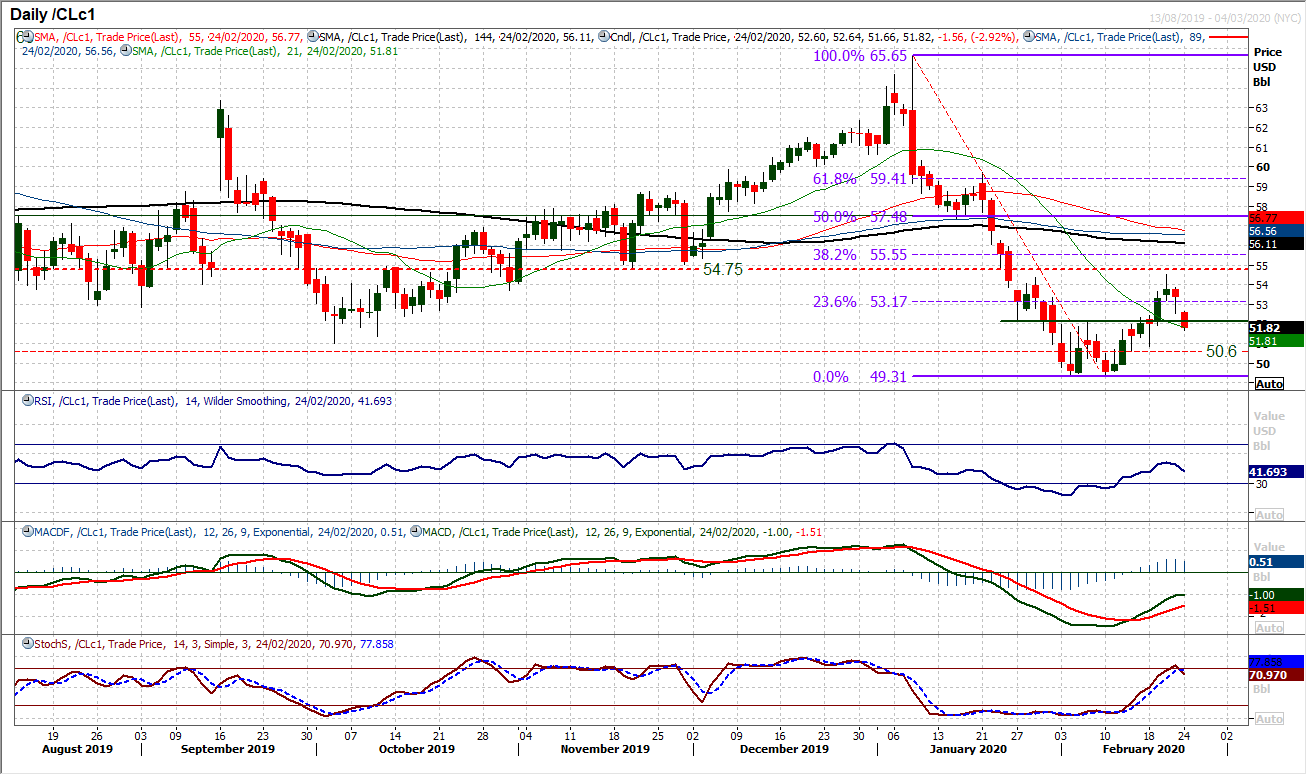
The recovery on WTI has lost its way in the past session or so. A base pattern implied target of around $55.00 saw the market coming up just short at $54.50 before posting a negative candle on Friday and another today. This is a concern as bear market rallies will often undershoot their recovery targets when the bigger picture outlook remains negative. With a retreat back towards the neckline of the breakout around $52.20, how the market responds this morning will be key. Already we see Stochastics bear crossing over, whilst RSI has turned back around 50. A close on RSI below 40 would be a real concern for the near to medium term recovery prospects now. The hourly chart shows the bulls now need to step up this morning, to prevent a quick retracement back. Hourly momentum is on the brink of turning negative again. Support in the band $50.60/$50.80 is key, so the bulls would be looking to forge support as a higher low above there. Initial resistance at $52.65 this morning needs to be seen with a closing breach for the bulls to post a positive daily candle and regain some confidence again.
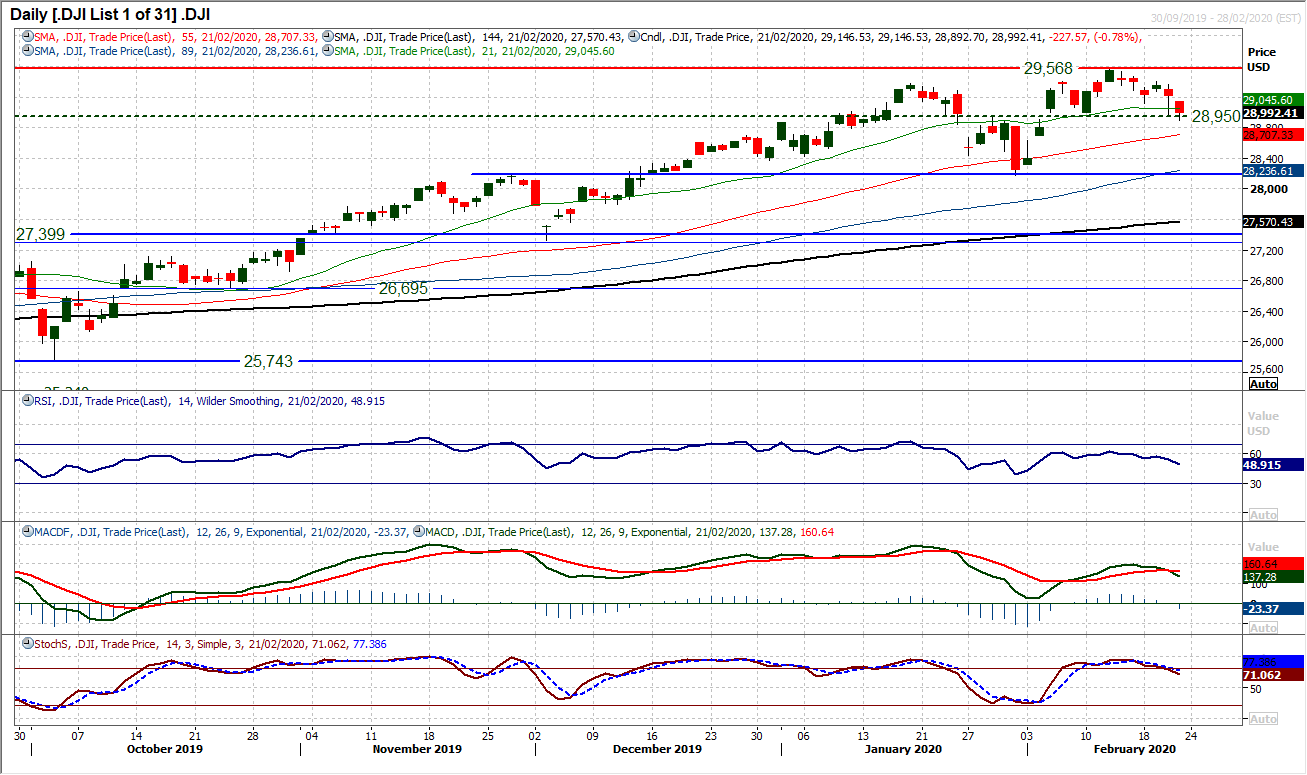
The Dow comes into the new week increasingly corrective. The mild slide over the past week or so began to accelerate back on Friday. A decisive negative candle cutting around -0.8% off the Dow (-227 ticks) means the old key pivot around 28,950 is under pressure. With futures pointing sharply lower this support will be broken today. The hourly chart shows that this pivot marks the neckline around a top pattern. A closing breach (highly likely) of 28,950 would confirm the growing corrective move and imply around -600 ticks of downside target. Already we see momentum indicators weighing and leading the market lower, with RSI falling below 50 at three week lows, MACD bear cross and Stochastics also deteriorating. Initial support below 28,950 is at 28,795 but a retreat towards the January low at 28,170 is threatening. There is resistance initially at 29,070.
"""DISCLAIMER: This report does not constitute personal investment advice, nor does it take into account the individual financial circumstances or objectives of the clients who receive it. All information and research produced by Hantec Markets is intended to be general in nature; it does not constitute a recommendation or offer for the purchase or sale of any financial instrument, nor should it be construed as such.
All of the views or suggestions within this report are those solely and exclusively of the author, and accurately reflect his personal views about any and all of the subject instruments and are presented to the best of the author’s knowledge. Any person relying on this report to undertake trading does so entirely at his/her own risk and Hantec Markets does not accept any liability. """
