Market Overview
The decks are being cleared for the signing of “phase one” of a trade agreement between the US and China. With translations done, both sides are ready for the signing in Washington tomorrow. The US has even sweetened the deal by removing China from its “currency manipulator” list (which it was put on back in August). This was an easy win for both sides as no reasonable assessment of the yuan would suggest that the PBoC has been manipulating it (if anything the opposite). So for the US to magnanimously remove this status is simply good optics in front of the deal which helps relations, but effectively achieves little other than improve relations between the two.
Market sentiment has taken a leap forward early this week, but there is a risk that it could become a “buy on rumour, sell on fact” moment. There is much to question about how much extra of US agricultural products that China can buy to make a difference. The most important part of the agreement is over forced technology transfers, however, something that again will be difficult to immediately measure. On market moves, the yen is under pressure at seven month lows against the dollar. However, this move is something of a disconnect to yield differentials and needs to be watched. Gold also remains under pressure. Once the dust settles on “phase one” and the difficulties of subsequent phases come out, will markets be so ebullient.
Adding to today’s risk appetite is that China’s trade data showed signs of positivity as the surplus increased in December to +$46.8bn (from +$37.9bn in November). Although this was not as much as the $48.0bn expected, China did see exports increasing by +7.6% and imports increasing by +16.3%, both of which were better than forecast.
Wall Street closed solidly higher once more with the S&P 500 +0.7% at 3288 for another all-time high. Although US futures are a shade lighter this morning (-0.1%) Asian markets have been broadly positive (Nikkei +0.7%, Shanghai Composite -0.3%). In Europe, there is a mildly positive open in prospect with FTSE futures and DAX futures +0.1% higher.
In forex, there is limited real direction across the majors, although recent weakness for both JPY and GBP continues.
In commodities, gold and silver have continued lower early today, whilst oil is all but flat.
It is a quiet European morning on the economic calendar until US inflation into the afternoon. The US CPI for December is at 13:30 GMT and is expected to show headline CPI increasing by +0.3% on the month to +2.3% YoY (from +2.1% in November). Core US CPI is expected to grow by +0.2% and leave YoY at +2.3% (+2.3% in November).
Also be on the lookout for Fed speaker John Williams (NYSE:WMB) (voter, centrist) who gives a speech at 1400GMT.
Chart of the Day – Silver
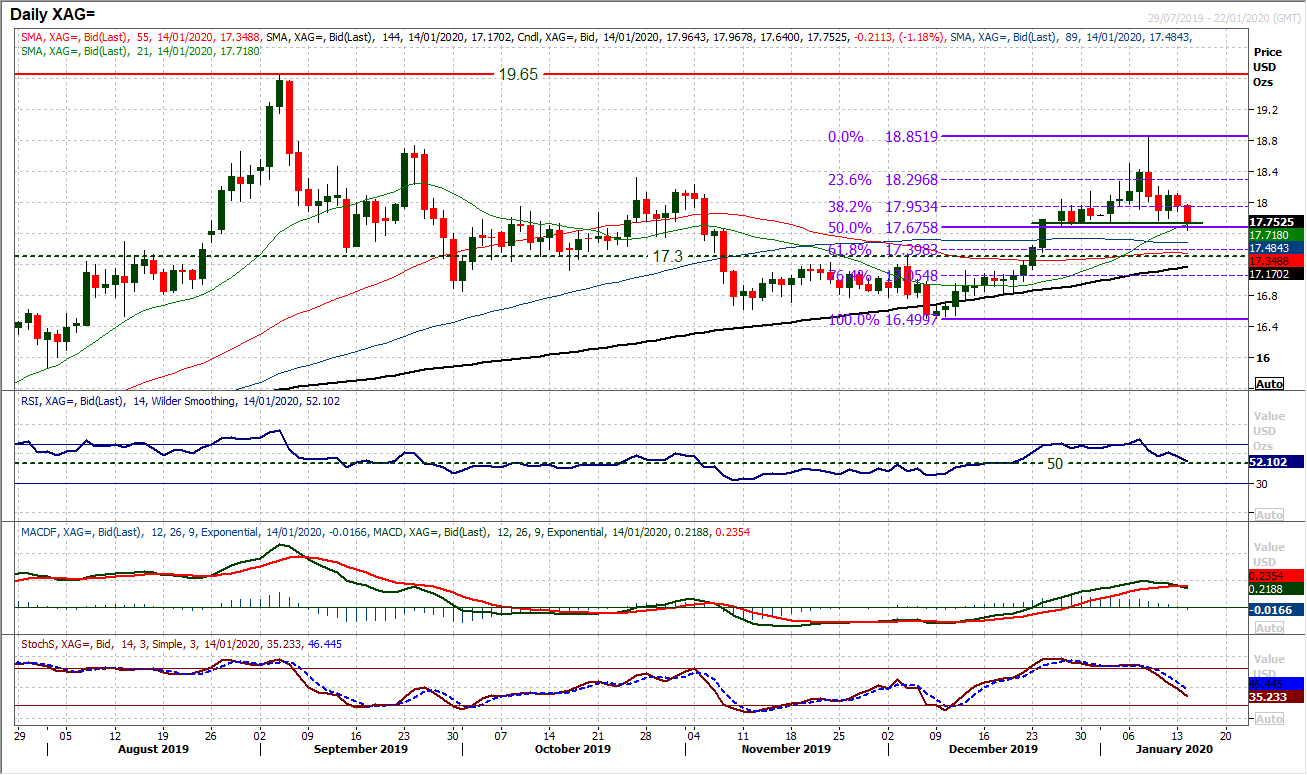
The accelerated rise of silver has come under decisive retracement pressure in the past week, but could the move go further? The pullback from a four month high of $18.85 has already unwound to the 50% Fibonacci retracement (of $16.50/$18.85) at $17.68. What is interesting is that this basis of support is also around what is now a neckline of a head and shoulders top at $17.75. With renewed corrective pressure from yesterday continuing today, the pattern is close to completion. Momentum indicators have been unwinding in the past week, with the Stochastics and RSI falling around their neutral points. However, this comes as the MACD lines are now posting a bear cross. The near term outlook is still very uncertain but the $17.75 neckline support will now be seen as an important near term gauge. If this is breached on a closing basis whilst being confirmed by RSI below 50, it would be a key breakdown which would also imply a much deeper corrective move. The next pivot support is $17.20/$17.30 area as an initial target, with 61.8% Fib at $17.40. Resistance is at $17.95 (38.2% Fib) and the key lower high at $18.15.
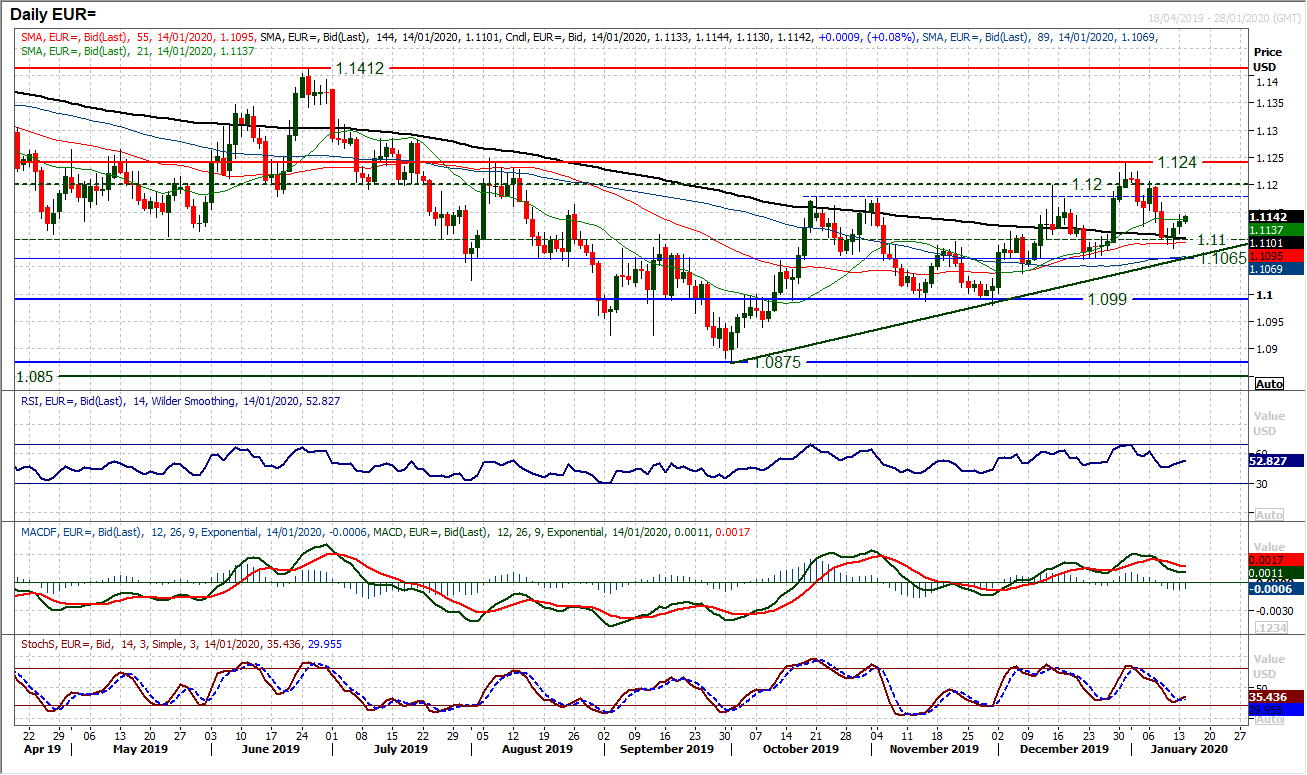
On a day where the dollar bulls were celebrating across the forex majors, the euro stood impressively firm yesterday. A drop back towards the old $1.1100 pivot has seen the buyers tempted back in again. With two mildly positive candles in the past two sessions, the move has continued to build early today. Taking a step back, this latest move reflects the difficulty to find sustained traction in either direction right now. Again, after a week or so of moving in one direction (decline at the beginning of January), once more the euro bulls are on the bounce back to retrace the move. However, there is certainly a mild euro positive bias still in the medium term outlook. The higher low at $1.1065 is intact and the RSI has again turned higher around the 50 mark, whilst Stochastics are crossing higher above 20. The hourly chart shows that pulling clear of $1.1130 initially puts the bulls into an upswing once more. However, they now need to drive through $1.1150/$1.1170 to clear a sustainably more positive near term rebound. Initial support at $1.1110 and then $1.1085.
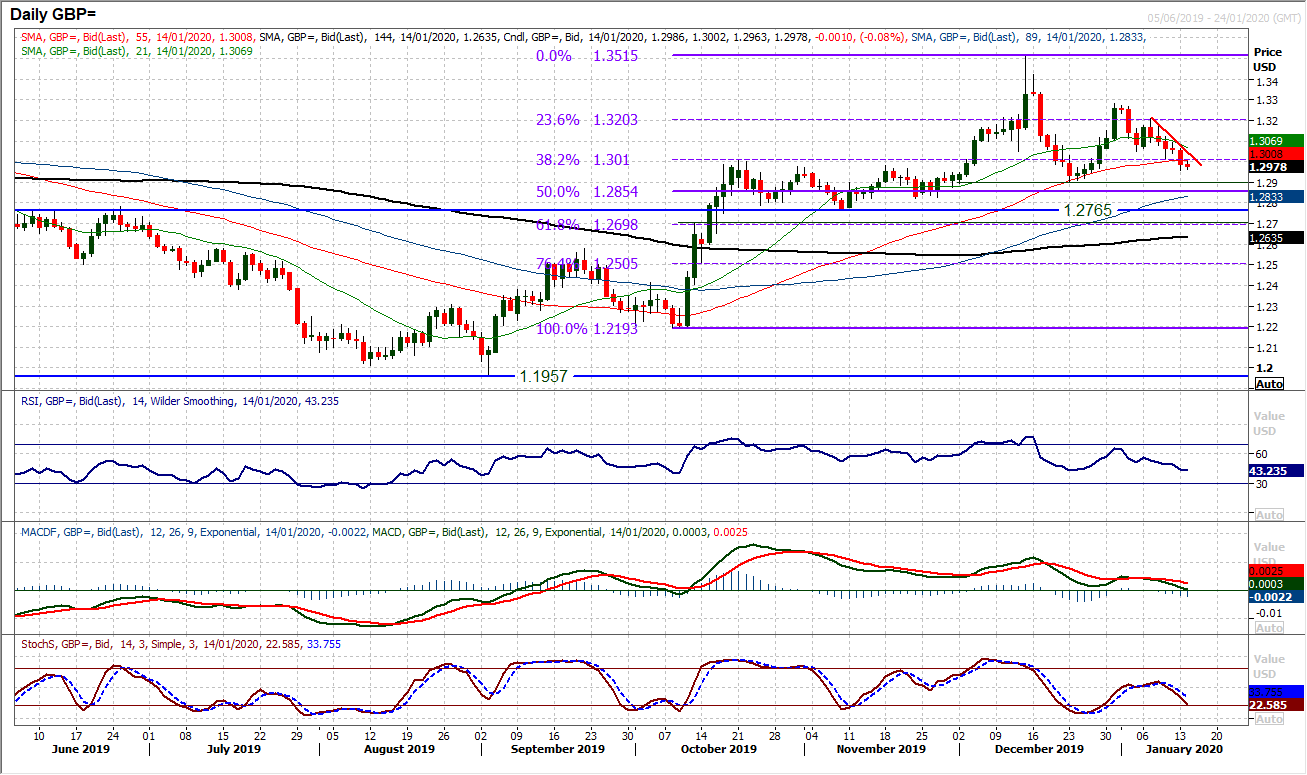
The medium term positive outlook on Cable is coming under pressure. After yesterday’s decisive negative candle took the market back below $1.3000 the outlook is under pressure again. Could sterling be topping out again? The move lower has come on the back of a succession of dovish comments from Bank of England members, which now means that technically, Cable is retreating to a key crossroads. The December correction found support at $1.2900 as the move was seen as another correction within a bull market. The RSI holding above 40 will be key to this, whilst MACD lines moving below neutral would be a big warning sign. Ultimately, on a fundamental basis, we see sterling as performing well in the coming months (stable government, a clearing of the Brexit log jam, and consumer confidence picking up), so weakness is likely to be seen as a chance for the bulls. This case is though made harder if the December low at $1.2900 is broken. Subsequent support at $1.2825 and $1.2765. The hourly chart shows resistance in the band $1.3020/$1.3050 now needs to be cleared to develop upside momentum again.
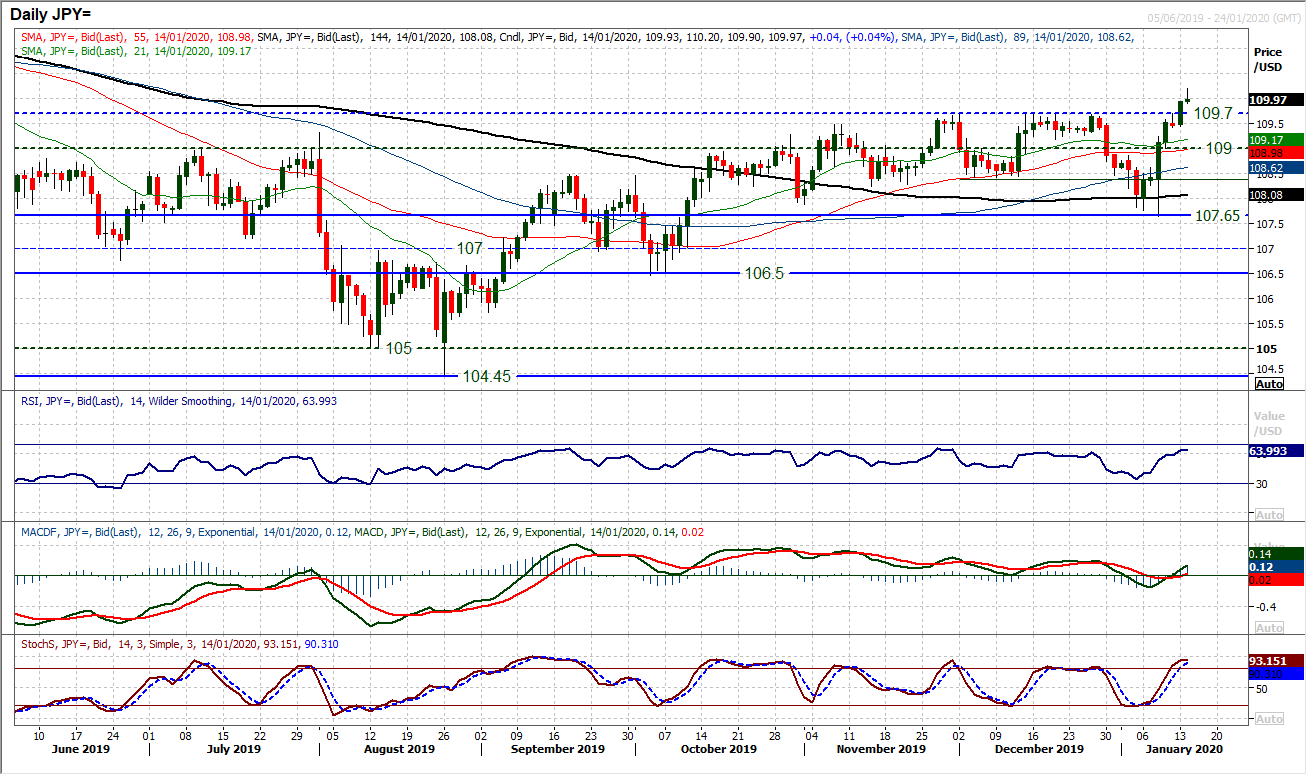
The key bull run of the past week has now broken out above resistance at 109.70. The move through resistance, that proved to be a ceiling throughout December, has taken the pair to a new seven month high and once more opens the upside. The key question for traders is whether to chase this breakout. Looking at the RSI suggests caution. Through Q4 2019, time and again the pair looking to be breaking out, only to struggle and subsequently retrace. The RSI is again into the 60/65 area where the breakouts failed throughout Q4 last year. The bulls need to see the RSI closing in the high 60s (or ideally above 70) to really suggest breakout is gathering pace and confirming. The Stochastics are strong but are also back around levels where the breakouts failed. The bulls will be looking to hold a move above the psychological 110.00 with the next key resistance at 110.65. Having broken out above 109.70, a close back below here would now begin to question the breakout. This now becomes a crucial crossroads moment for Dollar/Yen.
Gold
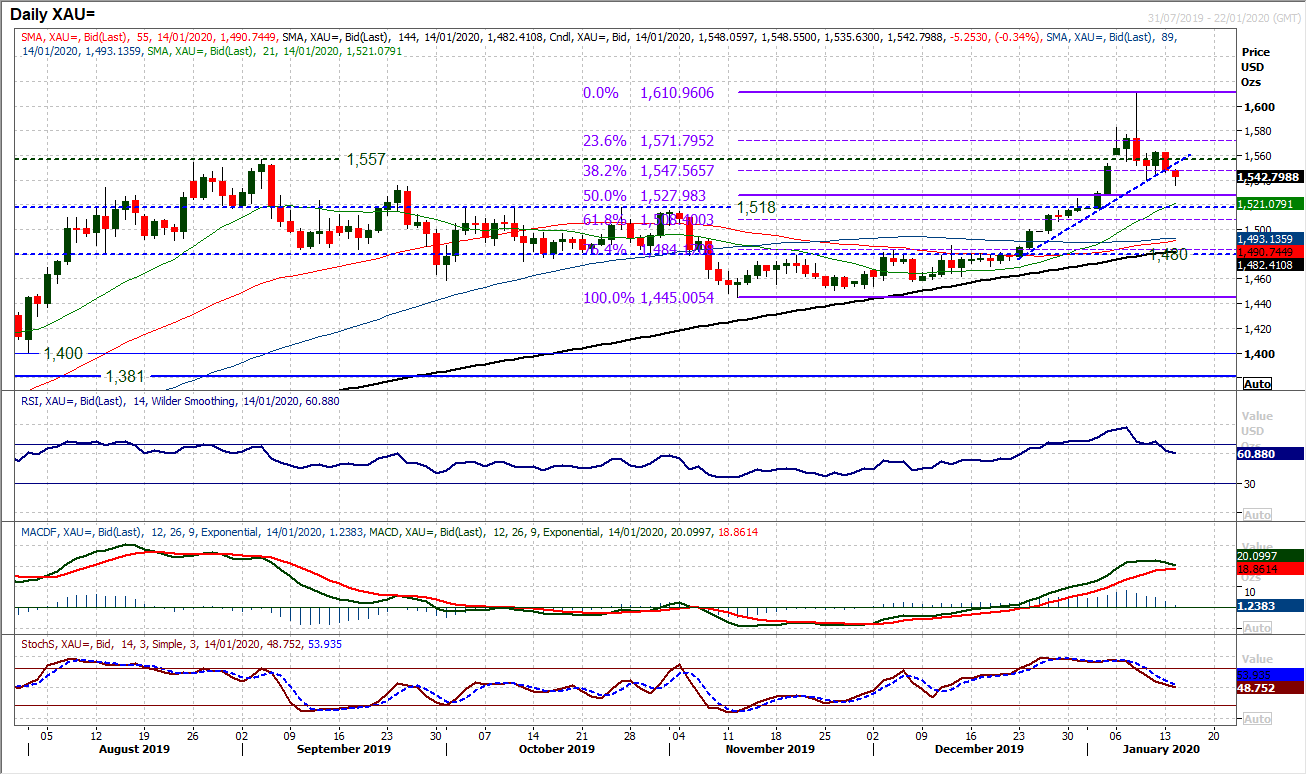
As the US and China prepare to sign the first phase of their trade agreement, risk appetite has been positive. This drove gold lower yesterday and maintains the negative pressure today. It also means that the retracement of the big bull run continues. The move in the past 24 hours has now broken a three week uptrend and momentum indicators are reflective of a market in correction mode. A break of the support at $1540 (last week’s low) today now means that a new near term downtrend (with lower high at $1563, and a lower low) is forming. The RSI is back under 60 now, whilst MACD lines are closing in on a bear cross. Finding the 38.2% Fibonacci retracement (of $1445/$1610) at $1548 as a pivot resistance the market is open for 50% Fib at $1528 as an initial target now. We still see that gold is just unwinding the excess of the December into January bull run and believe that the medium term outlook is still positive. There is support in the range of the old breakouts $1518/$1536 which we see will likely be an area to bring the next significant higher low. For now though, the correction is on.
WTI Oil
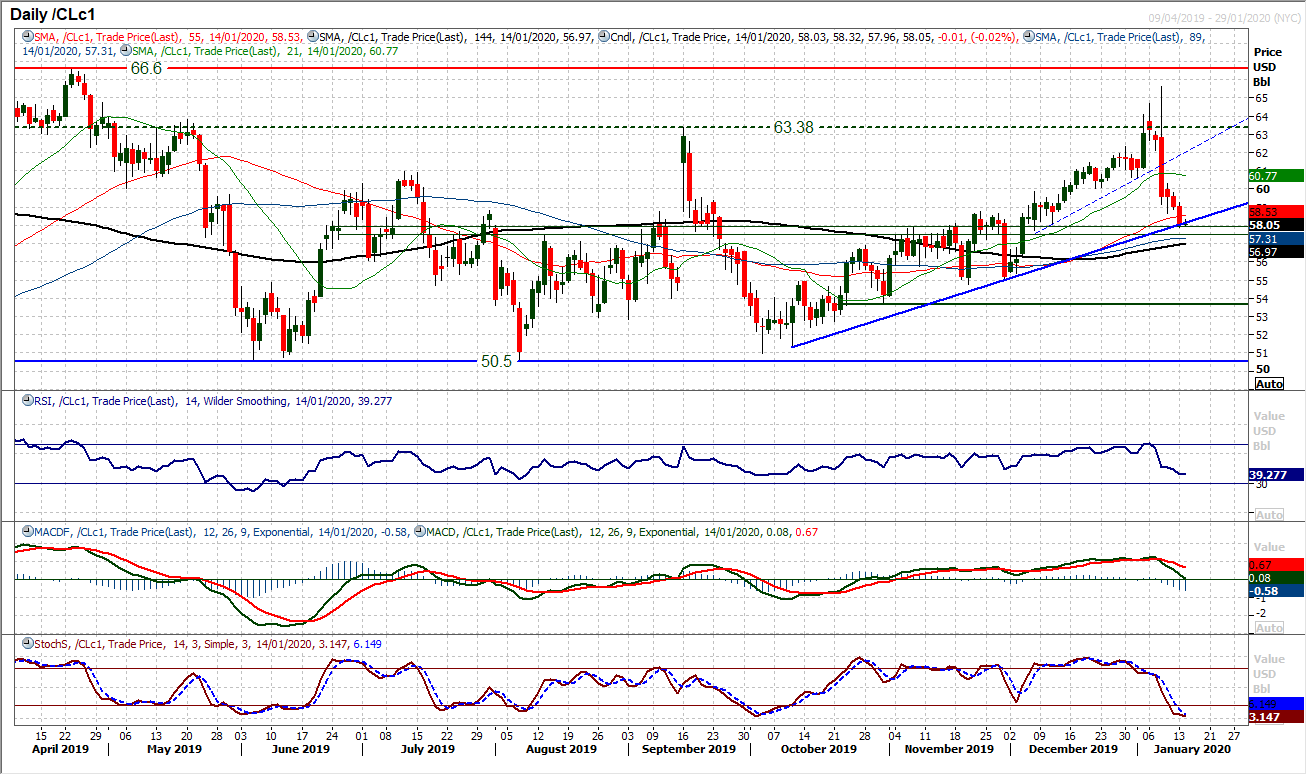
The calming of immediate tensions between the US and Iran has allowed the excesses of the January spike higher to retrace. This has continued over the past week and again found key selling through yesterday’s session. This morning we see the market right back to a key confluence area of support. A three month uptrend comes in at $58.15 today, whilst an old key pivot band $57.50/$57.85 is also in proximity. The RSI is back around 40 (around where rallies have kicked in over recent months) and this looks to be a key moment for the bulls. Below $56.95 would breach all the moving averages we look at too (where the 144 day ma is). The hourly chart shows $58.60/$59.80 is a resistance band to be breached to allow the bulls back in control.
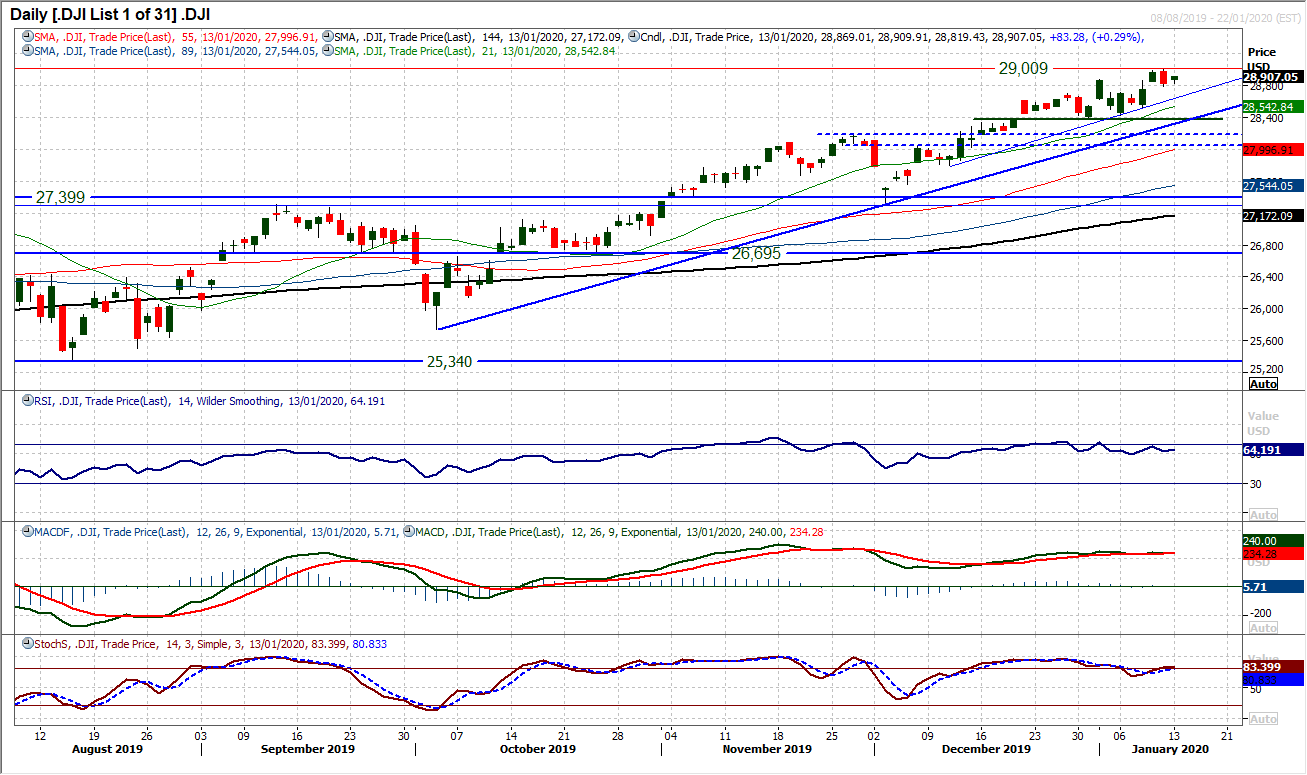
A bearish engulfing candlestick on Friday has just pushed the pause button on the latest move to all-time highs on the Dow. This pause is being reflected through momentum indicators which have just eased mildly out of very strong configurations. However, there is little to suggest an imminent end to the bull run will be seen. We can draw in several uptrends to reflect that this is simply a consolidation, as the market posted a mildly positive candle yesterday. A five week uptrend comes in to support at 28,700 today and this is still well above all the rising moving averages. Any near term weakness should still be seen as a chance to buy. The main initial higher low support is back at 28,376, whilst anything back around the 28,700 area will be seen as another opportunity for the bulls coming into earnings season. Resistance is at the all-time high at 29,009.
"""DISCLAIMER: This report does not constitute personal investment advice, nor does it take into account the individual financial circumstances or objectives of the clients who receive it. All information and research produced by Hantec Markets is intended to be general in nature; it does not constitute a recommendation or offer for the purchase or sale of any financial instrument, nor should it be construed as such.
All of the views or suggestions within this report are those solely and exclusively of the author, and accurately reflect his personal views about any and all of the subject instruments and are presented to the best of the author’s knowledge. Any person relying on this report to undertake trading does so entirely at his/her own risk and Hantec Markets does not accept any liability. """
