Market Overview
There has been a degree of caution across major markets in recent days as the implications of US legislation on Hong Kong have shackled positive sentiment. Last night, President Trump signed into law two bills concerning Hong Kong that could really put a stumbling block squarely in the way of moves towards “phase one” of a trade agreement with China.
The first, is the most contentious, writing into law the requirement for annual certification that Hong Kong retains autonomy to be treated as a special US trading consideration. China and the Hong Kong authorities see this as a direct foreign influence. The official response from Beijing talks about the “sinister intentions” of the US, but mentions nothing on the trade talks. So given the recent positive signals surrounding “phase one” will this now derail the negotiations? The reaction across markets has been fairly muted so far (although this could be Thanksgiving related) and suggests the situation could be managed. If there was a material concern of any breakdown in relations, you would expect a spike in gold and the yen, whilst yields also coming sharply lower. This has not been seen, with only marginal moves into safe haven having been seen.
Other news overnight comes out of the UK general election, whereby a poll that accurately predicted the 2017 election result, has suggested the Conservatives will gain a sizable majority. Sterling is stronger, but the key would be a sustainable break of $1.3000 against the dollar. In the absence of this, it suggests the market remains cautious.
On Wall Street, there were further gains into all-time highs yesterday, with the S&P 500 closing +0.4% higher at 3153, whilst US futures are hinting -0.3% lower (albeit with markets closed today for Thanksgiving). Asian markets are cautious and have edged lower overnight with the Nikkei -0.1% and Shanghai Composite -0.5%. It is a similar look to European markets in early moves with the FTSE 100 Futures and DAX Futures both -0.2%.
In forex, there is a continuation of the GBP bounce, whilst a mild USD bias is also laying out. In commodities, this dollar slip is reflected in gold edging slightly higher, whilst oil is around -0.5% lower.
It is rather a quiet day for the economic calendar with the US public holiday for Thanksgiving, however, there are also a number of interesting Eurozone data points to keep an eye out for. Given the continued concerns of Eurozone stagnation, any data that help to paint a picture of an industrial slowdown leaking into the services sector will be impactful.
The Eurozone Economic Sentiment for November at 10:00 GMT is expected to improve slightly to 101.0 (from 100.8 in October), whilst Eurozone Industrial Sentiment is expected to improve marginally to -9.1 (from -9.5), but Eurozone Services Sentiment is expected to dip to +8.8 (from +9.0). The prelim reading of German inflation for November at 13:00 GMT with the German HICP expected to pick up to +1.2% (from +0.9% in October).
Chart of the Day – EUR/CAD
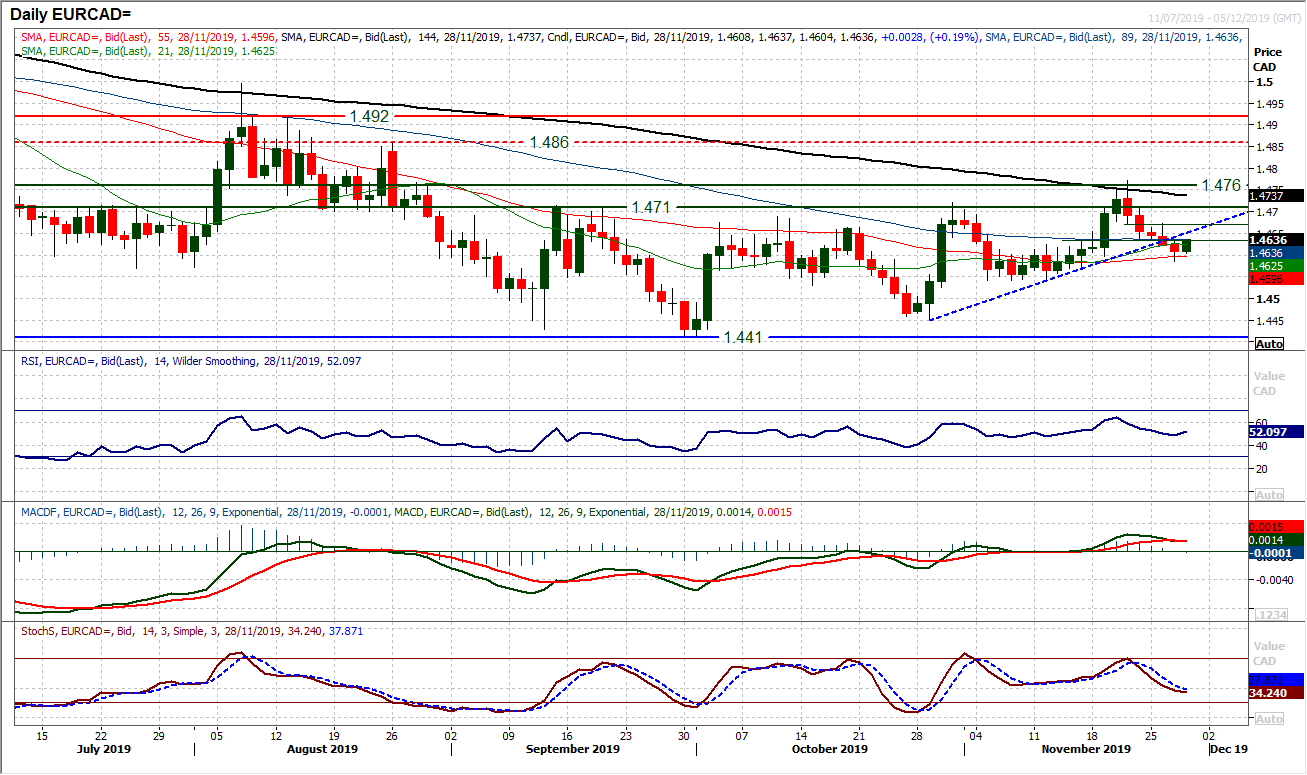
In the past week the euro has been under pressure through a number of the forex crosses. EUR/USD is on the brink of a key breakdown, whilst EUR/NZD continues to deteriorate. Having turned lower from the old pivot band at 1.4710/1.476 we also see EUR/CAD beginning to deteriorate. A breach of the four week uptrend suggests the recovery has turned sour and the bulls have lost control. Although the market has ticked higher initially today, it will be interesting to see how the bulls respond. The RSI has fallen to around 50, whilst MACD lines bear the cross and the Stochastics have fallen to four week lows. It suggests the market is on the brink of turning decisively corrective. The hourly chart already shows a corrective configuration with RSI failing around 60 and MACD lines struggling around neutral. There is a resistance band 1.4640/1.4675 which is now a near term sell-zone. A failure of this morning’s rally would put pressure back on 1.4585 and open a test of the 1.4540 support.
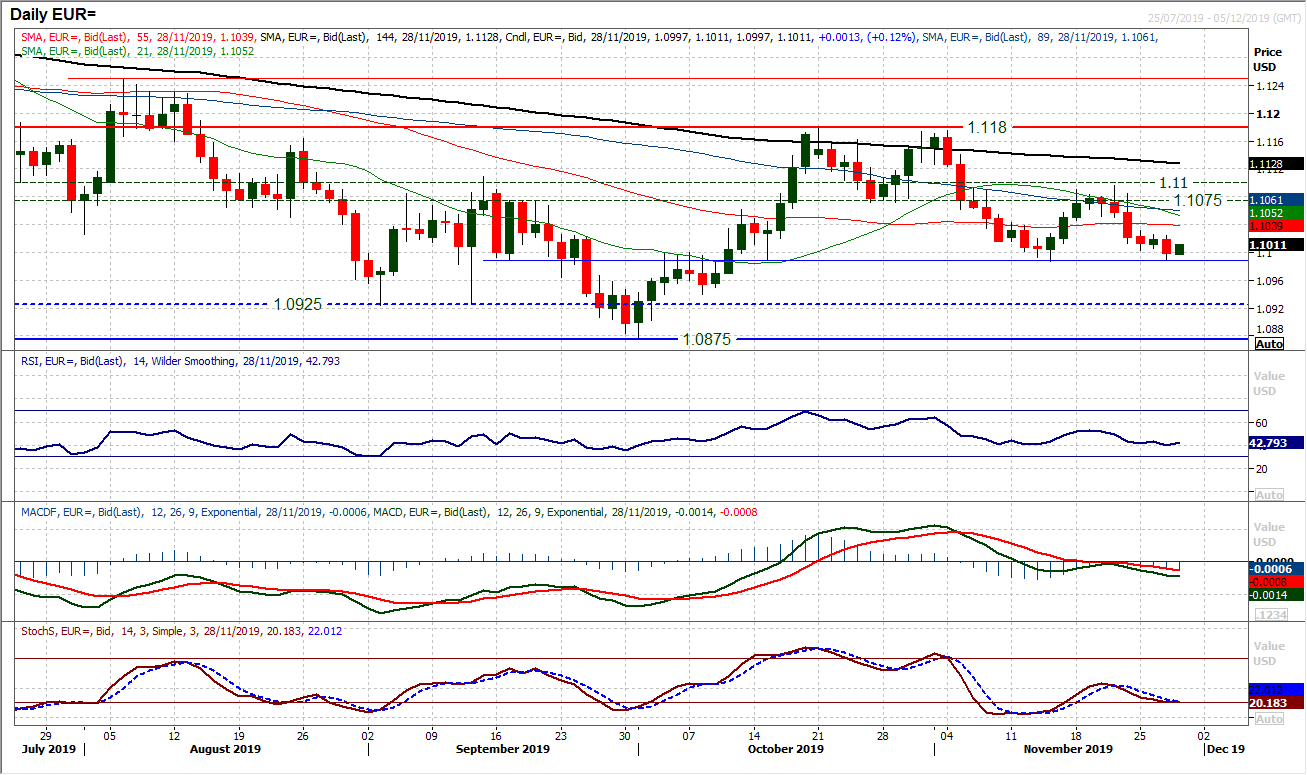
Despite an early tick higher this morning, the euro remains under pressure. Another failed rally during yesterday’s session has again looked at the key pivot support at $1.0990. Although the support has held, the sellers are testing the water. Momentum indicators remain negatively configured and suggest that rallies will struggle for traction. We are watching the RSI which has used the 40 level as an area where support forms in recent weeks and if this begins to be breached it would suggest $1.0990 being broken. The hourly chart shows negative momentum, with rallies failing around 60 on hourly RSI and around neutral on MACD. There is growing resistance around $1.1025/$1.1030 under near term overhead supply at $1.1050. The near term barriers to recovery are mounting. A breach of the $1.0990 support opens $1.0875/$1.0925.
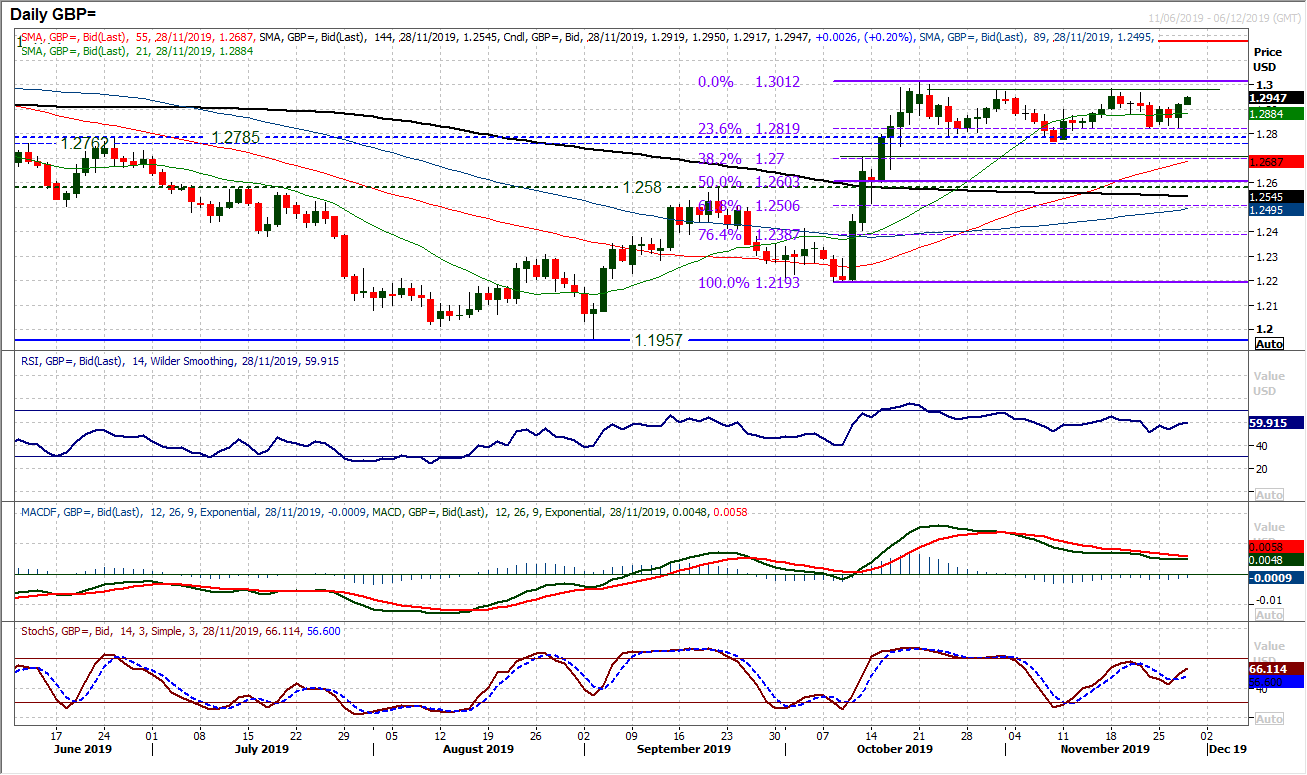
Another turnaround within the multi-week consolidation range sees the bulls just looking to gain control again. Once more the support of the 23.6% Fibonacci retracement (of $1.2193/$1.3012) has come into play at $1.2820 and acted as a springboard for a decisive positive candle yesterday and another gain today. The UK election swings of sentiment have had a part to play here after a torrid 24 hours for the opposition Labour Party. This re-opens the top of the range again $1.2975/$1.3010. However, we still see it unlikely that Cable will be able to breakout above this resistance. We see this as a range in place likely until the election polling day of 12th December. Opinion polls will be key and a YouGov poll puts the Conservatives with a clear majority. But will sterling traders take this with a pinch of salt? No breakout yet would suggest caution. Initial support at $1.2910.
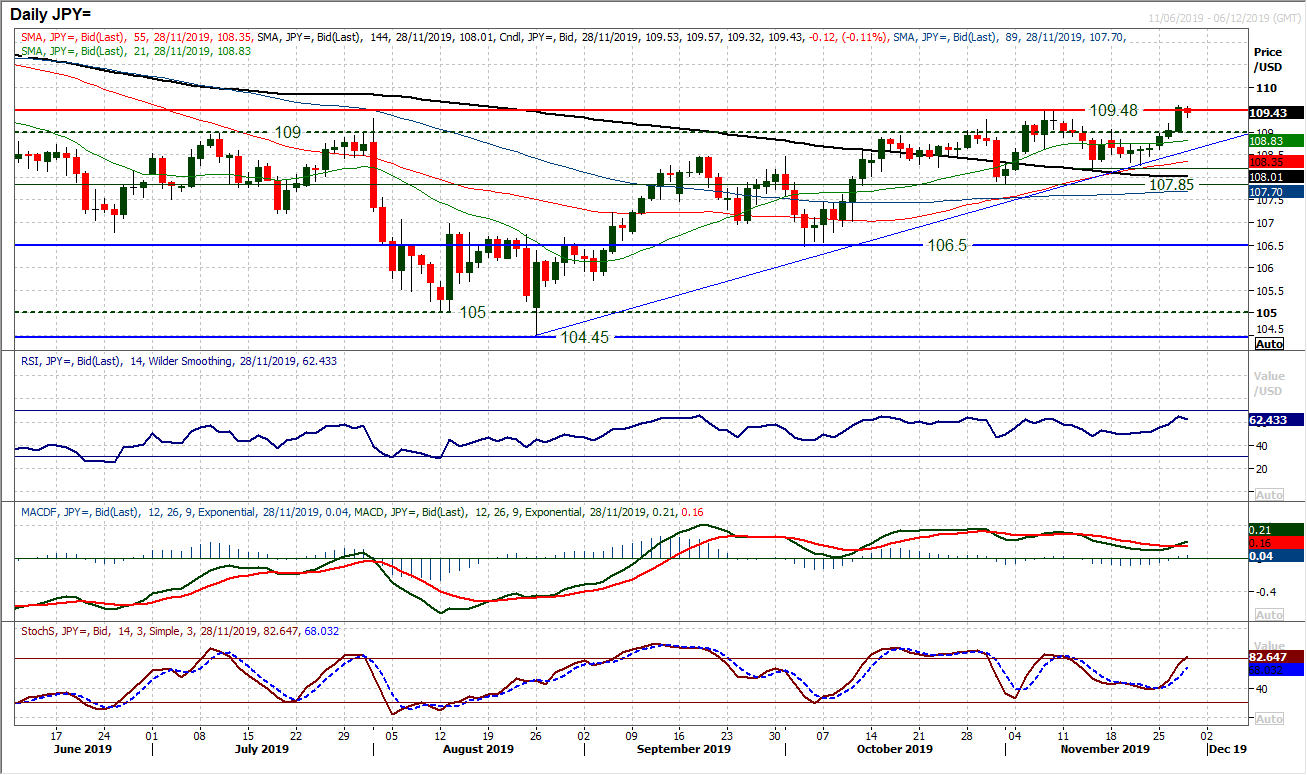
An acceleration higher on the dollar has driven USD/JPY to close above 109.50. Is this the breakout moment that has been so elusive for so long? There is a notable improvement in momentum throughout this week, with the bull candles becoming successively stronger. The initial reaction this morning is caution (what with it being Thanksgiving and also the potential bump in the road of the trade dispute). However, if there is no instant rejection of a breakout, it could easily be a driver of the pair to confirm multi-month highs. Holding the 109.00 breakout is a key step too and there is a strength to the hourly momentum which suggests an underlying support forming. With the market fluctuating and unwinding slightly today the bulls will look for support above 109.20 near term breakout. Ultimately, holding above 109.50 opens 109.90 as next resistance with the key May high at 110.65 as next real resistance.
Gold
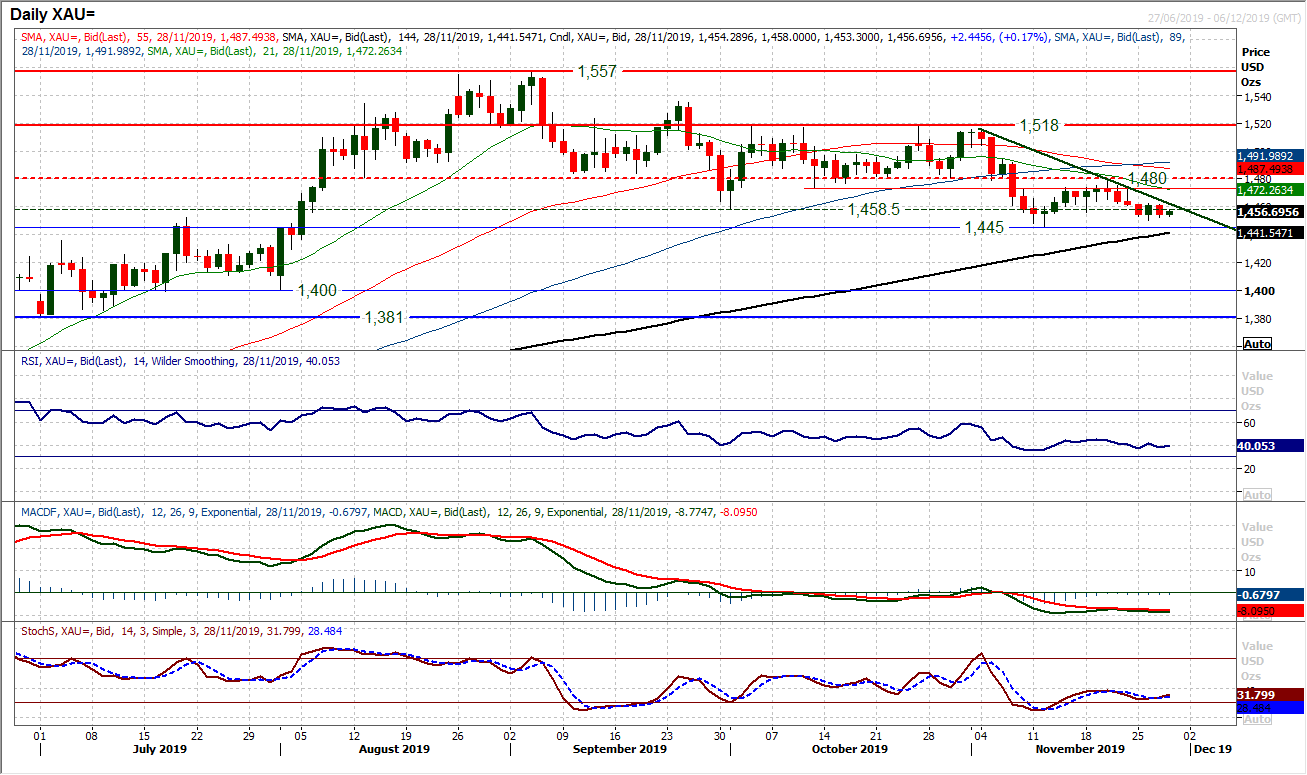
We continue to see rallies fading on gold as the ongoing corrective outlook weighs. The recent failure of a recovery around $1480 has been followed by a renewed negative slide in the price. A test of the latest key low at $1445 is increasingly likely. With momentum indicators negatively configured, the downside pressure is mounting. A failure of the RSI around 45 and move back under 40, along with the ongoing slide on MACD and Stochastics reflects the negative outlook. A three week downtrend comes in at $1462 today. The hourly chart shows a near term pivot at $1462 whilst a move below $1450 opens $1445 today. Whilst there has been an uncertain reaction following Trump’s signing of the Hong Kong bills, we continue to expect a medium term retreat on gold, potentially to test the $1380/$1400 support band.
WTI Oil
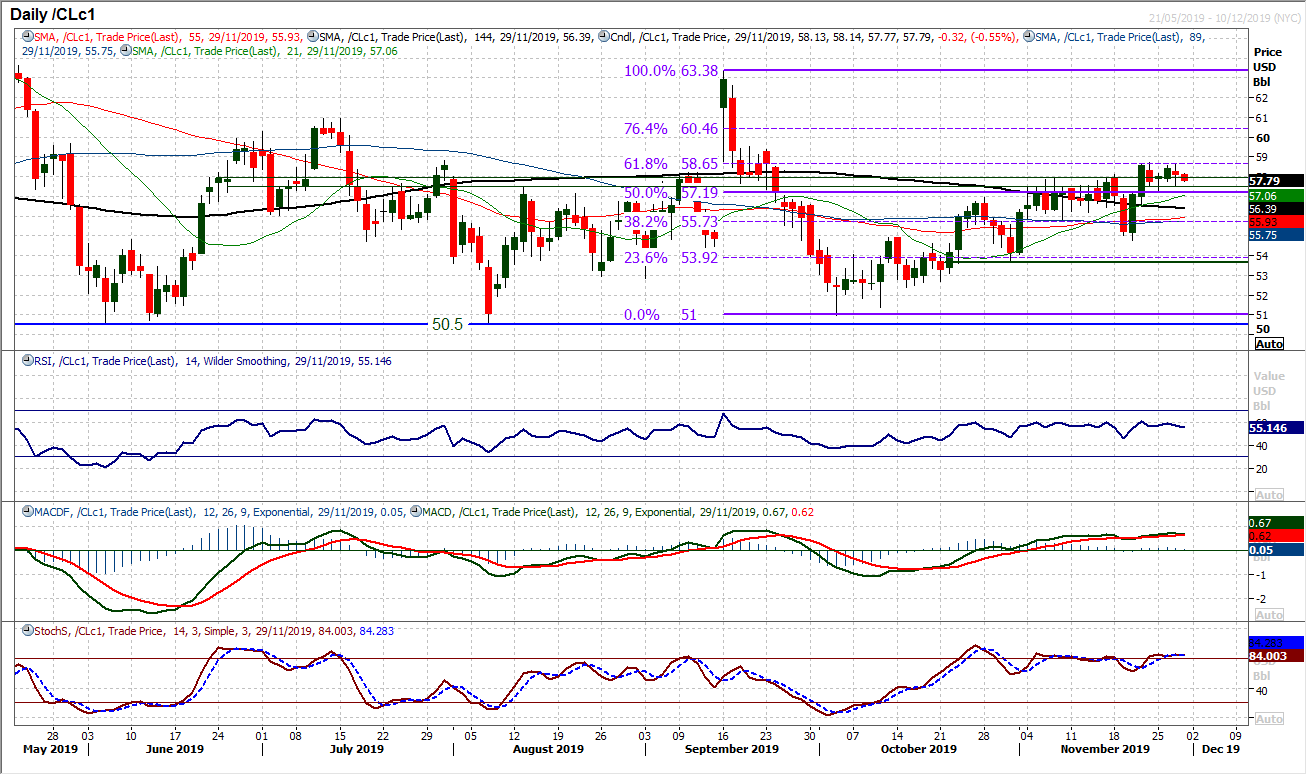
The bulls are consolidating the recent upside break as the support for the breakout looks to solidify. We continue to see the market supported in the old resistance band between the 50% Fibonacci retracement (of $63.40/$51.00) at $57.20 and the old November highs at $57.85. Near term corrections are seen as a chance to buy. However, it is also notable that the near term importance of the 61.8% Fib level grows at $58.65. In four of the past five sessions, intraday rallies have failed around this resistance and the bulls have been unable to continue their run. Despite this though, with a run of higher lows and positive bias to momentum, we are looking for resistance to be tested and breached in due course.
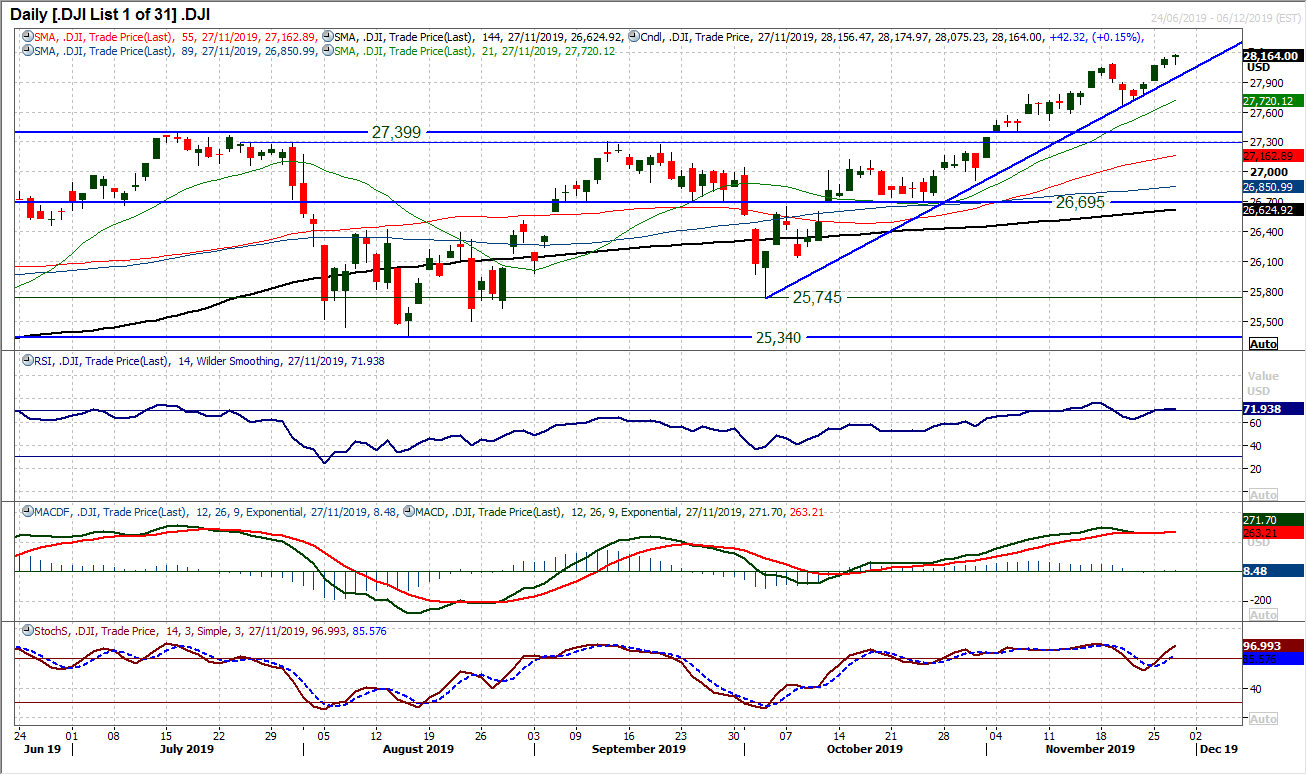
Wall Street is closed for Thanksgiving today, however, the Dow finished another session in all-time high territory last night to leave the market in a strong position moving into the public holiday. Technically this is a strong outlook with the (slightly redrawn) eight week uptrend intact and momentum indicators positively configured. There is a small fly in the ointment, with US futures reacting mildly lower to Trump signing the Hong Kong bills. So watching the uptrend (at 27,990) will be the first test. There is key support of a higher low now at 27,675. We see weakness as a chance to buy, but would be looking for confirmed support to do so.
DISCLAIMER: This report does not constitute personal investment advice, nor does it take into account the individual financial circumstances or objectives of the clients who receive it. All information and research produced by Hantec Markets is intended to be general in nature; it does not constitute a recommendation or offer for the purchase or sale of any financial instrument, nor should it be construed as such.
All of the views or suggestions within this report are those solely and exclusively of the author, and accurately reflect his personal views about any and all of the subject instruments and are presented to the best of the author’s knowledge. Any person relying on this report to undertake trading does so entirely at his/her own risk and Hantec Markets does not accept any liability.
