Market Overview
An improvement in market sentiment is tentatively holding as several key markets teeter on the brink once more. In recent sessions we have seen a push back against the tide of falling bond yields and this has helped risk appetite. A key element in this has been the suggestion that Germany would finally be willing to end its balanced budget policy in order to counter the prospect of recession. Fiscal expansion in Germany would be a major shift in policy (and something that would make ECB President Mario Draghi a very happy man). This along with China announcing new lending rates would be slightly lower has helped to stoke appetite for risk again. The question is one of how long this may last for. We see gold having slipped back below $1500 and the yen also weakening. However, these moves are consolidating this morning. Also consolidating are equity markets which have jumped decisively in the past could of sessions. Donald Trump tweeting about QE being restarted could begin to weigh on Treasury yields once more and begin to restrict the dollar gains. However, this would also be equities positive and we are only seeing mild follow through for now.
Wall Street closed decisively higher again with the S&P 500 +1.2% at 2924, with US futures showing mild gains today +0.1%. Asian markets were more mixed overnight though, with the Nikkei +0.6% but the Shanghai Composite -0.1%. European markets have a cautiously positive look to them (following US futures) with the FTSE futures +0.2% and DAX futures +0.1%. In forex, there is a mixed outlook to the majors, with JPY just paring some of its recent losses. EUR is looking a little more steady this morning despite sterling weakness. The main outperformer is AUD in the wake of the RBA minutes which suggested data dependence for rates if subdued growth and inflation requires, but no explicit cuts. In commodities, gold is beginning to find a degree of support today after two sessions of declines, whilst oil is holding on to yesterday’s gains.
It is very quiet on the economic calendar today, with no major economic announcements. However, as market look toward the next FOMC meeting and a likely rate cut, the comments of the FOMC’s Randall Quarles (permanent voter, centrist) late tonight at 2300BST will certainly be of interest.
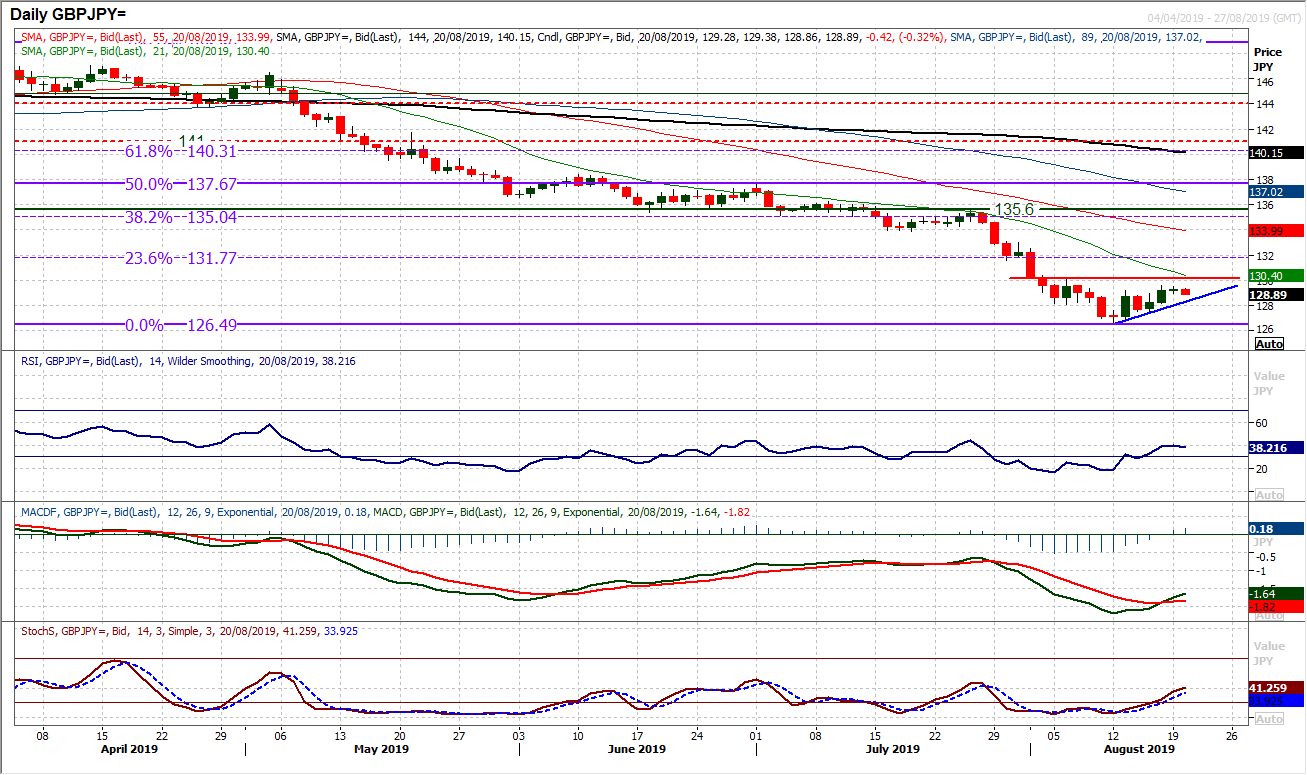
Chart of the Day – GBP/JPY
Two currencies with very differing performance levels amongst the majors are sterling and the yen. With Brexit risks mounting and safe havens in favour, we have seen a huge sell off on Sterling/Yen since March. However, is this performance beginning to turn a corner? The latest leg lower from early August has hit a low at 126.49 and has begun to put together a near term rally and a run of higher lows in five successive sessions. We have seen a bull cross on the MACD lines and Stochastics also positing a near term positive cross. Much more needs to be done though to suggest there is a sustainable shift underway. The daily RSI is improving but now needs to move above 45 and into the 50s to really reflect a recovery developing. Also, whilst the hourly chart reflects the rebound, there needs to be a breach of the resistance between 130.00/130.20 to suggest the bulls are finding traction and turned the corner. Continuing the run of higher lows would be helpful but the mini uptrend comes in at 128.35 today. The hourly chart shows the first real higher low at 128.15. Look for a closing break above 130.20 to open the 23.6% Fibonacci retracement of 148.86/126.49 at 131.75. For now, we have to still see sterling as a sell into strength and the yen likely to continue to outperform, but if the conditions laid out above begin to change then something bigger could be underway. This chart could be a very interesting one to watch for broader sentiment shifts.
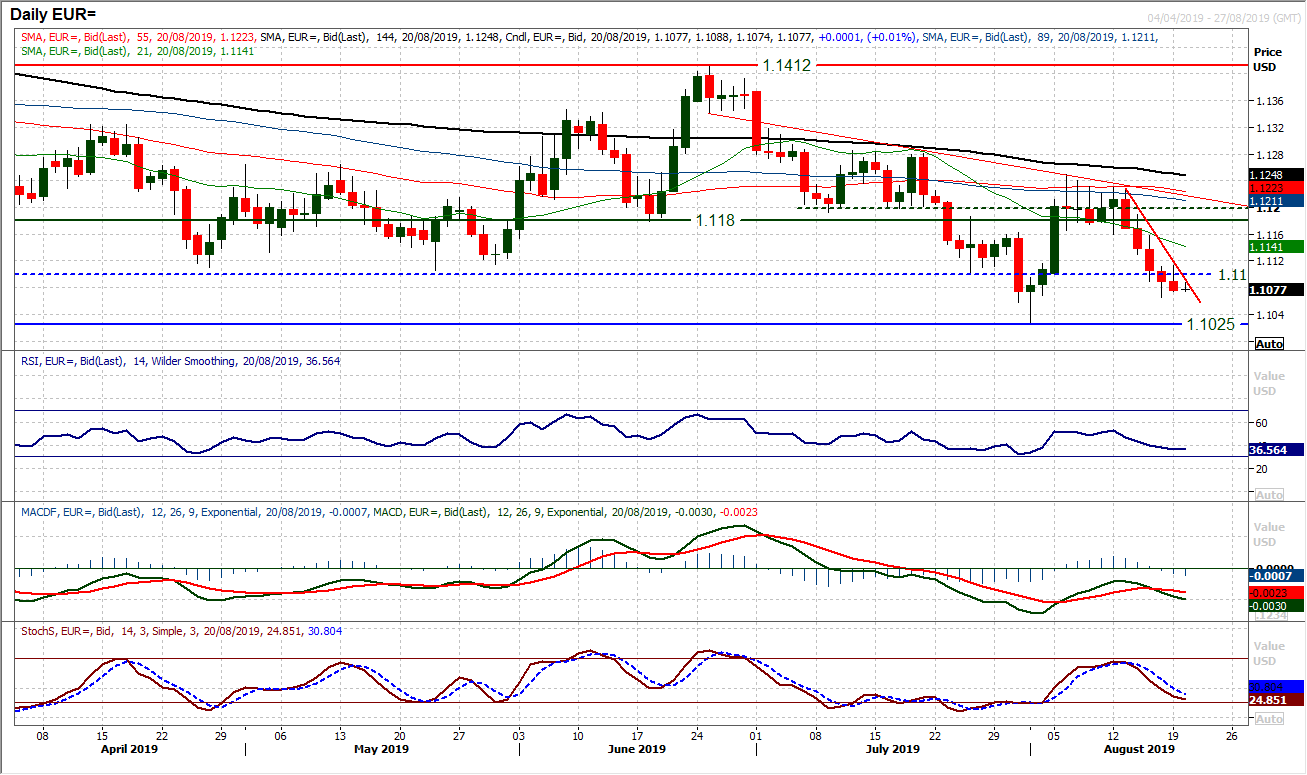
It looked for much of yesterday’s session that the euro bulls were beginning to get a foothold in the market once more. A drop back into the close has subsequently left a fifth consecutive bear candle and suggests there is a tough task still ahead. However, a higher daily low above $1.1065 is a start and if this continues to hold today then there will be further suggestion that whilst upside remains a struggle, at least the downside could become limited. Momentum indicators remain negatively configured, but a sense that Stochastics and RSI may be slowing in their descent. A tick higher at the open once more today is also encouraging. The first indicator to watch for recovery could be the hourly RSI which has repeatedly failed at 60 throughout the decline of the past week. Resistance in the band $1.1100 (old key floor) and $1.1120 (near term high) needs to be overcome. A failure of the support at $1.1065 once more opens the key August low at $1.1025.
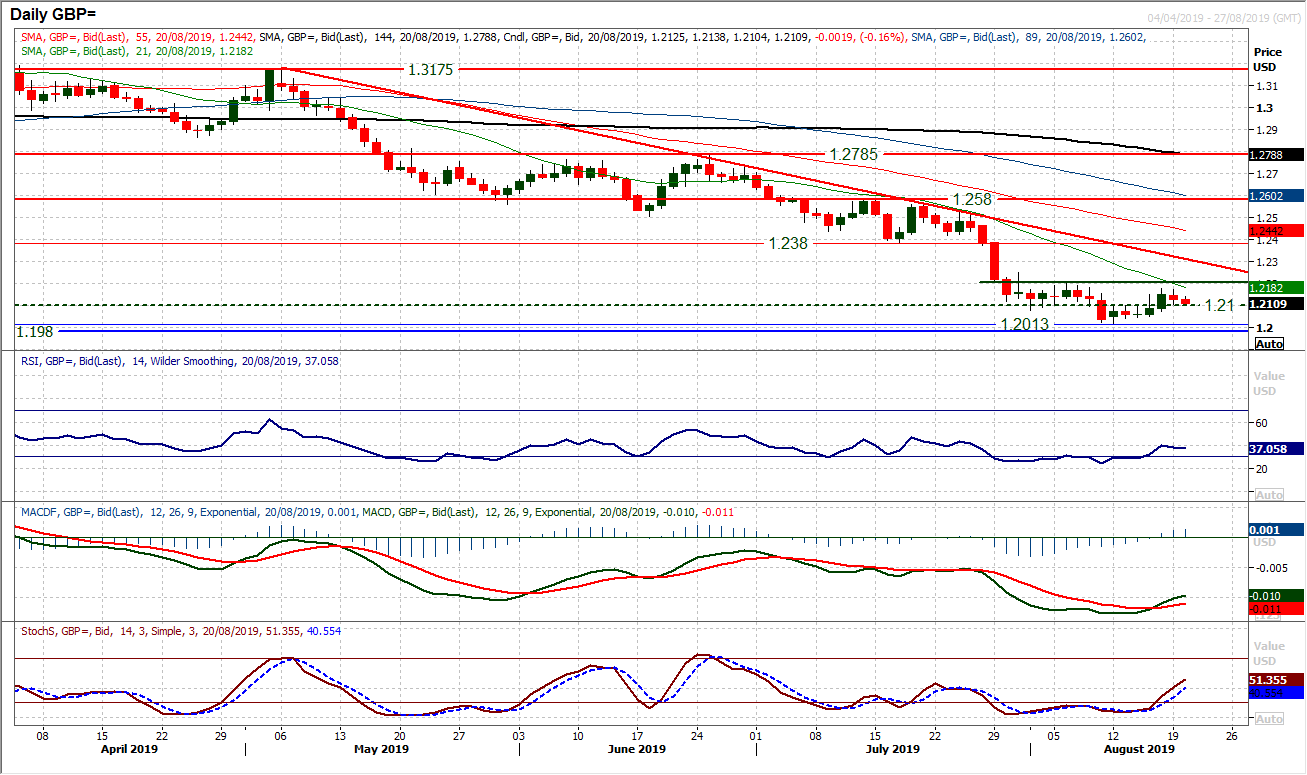
One interesting mover amongst the majors in the past week has been a rebound on sterling, even amidst a strengthening dollar. However, we continue to view strength on Cable as a chance to sell. Excitement for the bulls would have been rising last week as a run of three consecutive positive closes was put together (first time in a month), but no resistance was breached by this move and it simply looks to have been another unwind to sell. A failure under the resistance band $1.2210/$1.2250 maintains the ongoing negative outlook. Although there has been a cross higher on Stochastics and MACD lines, this is still well within the confines of negative medium term configuration and looks a chance to sell. The 21 day moving average has been a basis of resistance for much of the past few months and falls around $1.2185 today. A close back under the old low at $1.2100 would re-open a test of the low at $1.2013. It was interesting to see $1.2100 as support yesterday so is clearly a level the market is now eyeing. Resistance is mounting overhead under $1.2170. Traction on hourly MACD lines below neutral would be a negative signal.
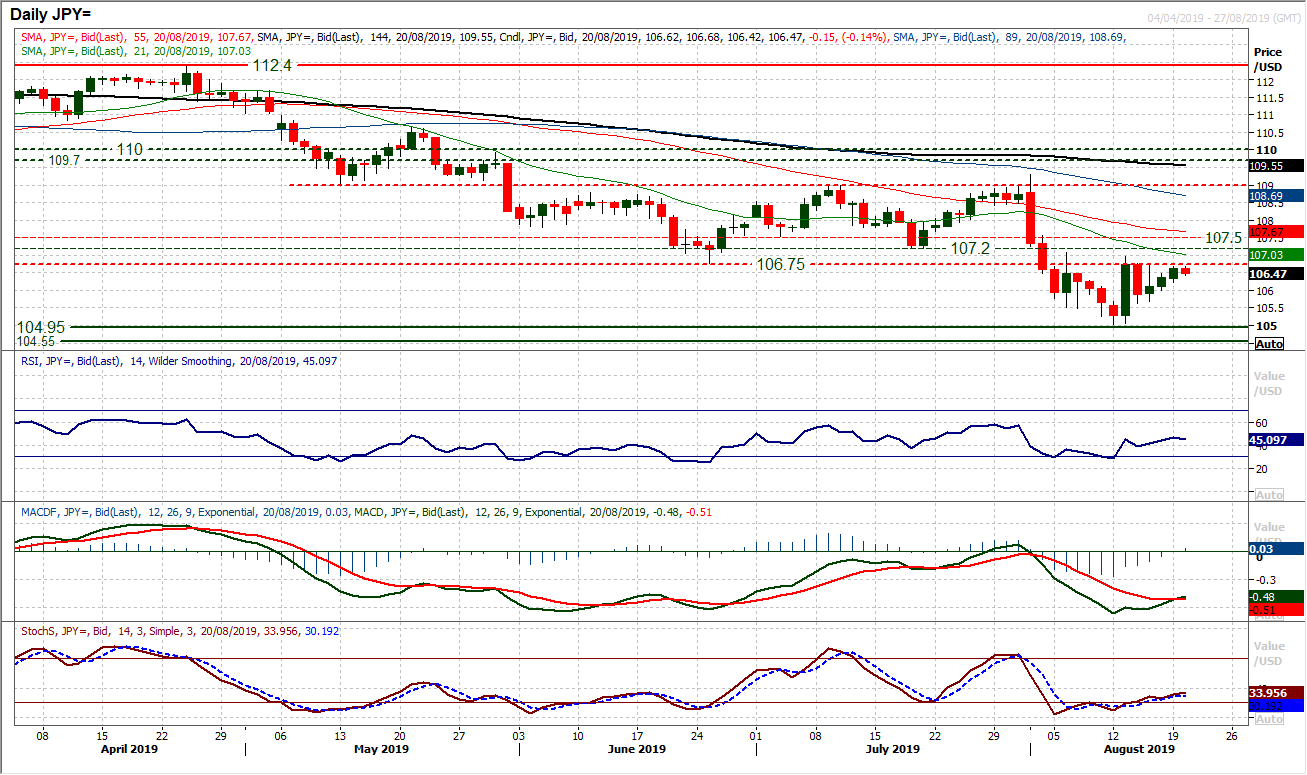
The move away from safe haven assets hit the yen yesterday, but as yet the market seems unwilling/unable to drive USD/JPY beyond the 106.75 key near to medium term resistance. This marks the bottom of overhead supply between 106.75/107.50 which is an area where the bulls have continued to struggle over the past couple of weeks. There is an edge of improvement creeping into the momentum indicators, however, the bulls seem reluctant to really commit to any sustainable move against the yen. There is a tepid positive bias to hourly momentum, but little conviction in the configuration. An uptrend on the hourly chart is worth watching as this is beginning to be breached as resistance at 106.75 looms. The support of 105.65 is now growing in importance, with yesterday’s low at 106.25 now worth watching as a close below would suggest once more the bulls losing their way to consolidation.
Gold
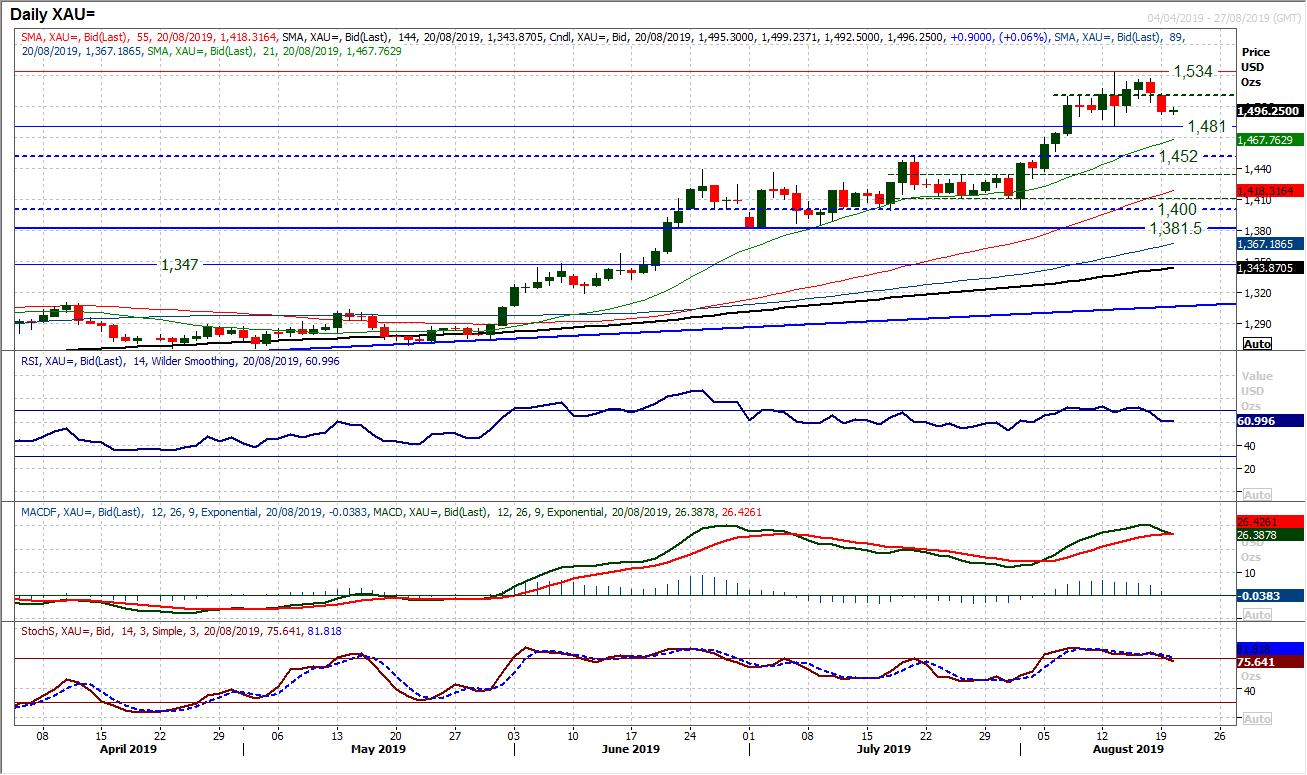
Gold has lost the upward momentum that has been so instrumental in pulling the market decisively higher over the past few weeks. The question is whether this is now a consolidation, or the beginning of a correction. We believe it to be part of a consolidation, but caution needs to be taken. Two negative candles in a row on the daily chart have begun to weigh on momentum indicators. Stochastics are slipping lower and MACD are threatening a bear cross. How the market responds today could be key. It has been six weeks since three consecutive negative candles were posted, but the key would be the support at $1481. Losing this support on a closing basis would be a negative development and drive a potential deeper correction towards $1452 (the latest key breakout support). However, looking on the hourly chart, there is a negative bias but one which is relatively well contained within a consolidation pattern of hourly momentum. Initial support at $1492 is holding early today but there is resistance mounting overhead at $1503 and under what is increasingly a mid-range pivot at $1510.
WTI Oil
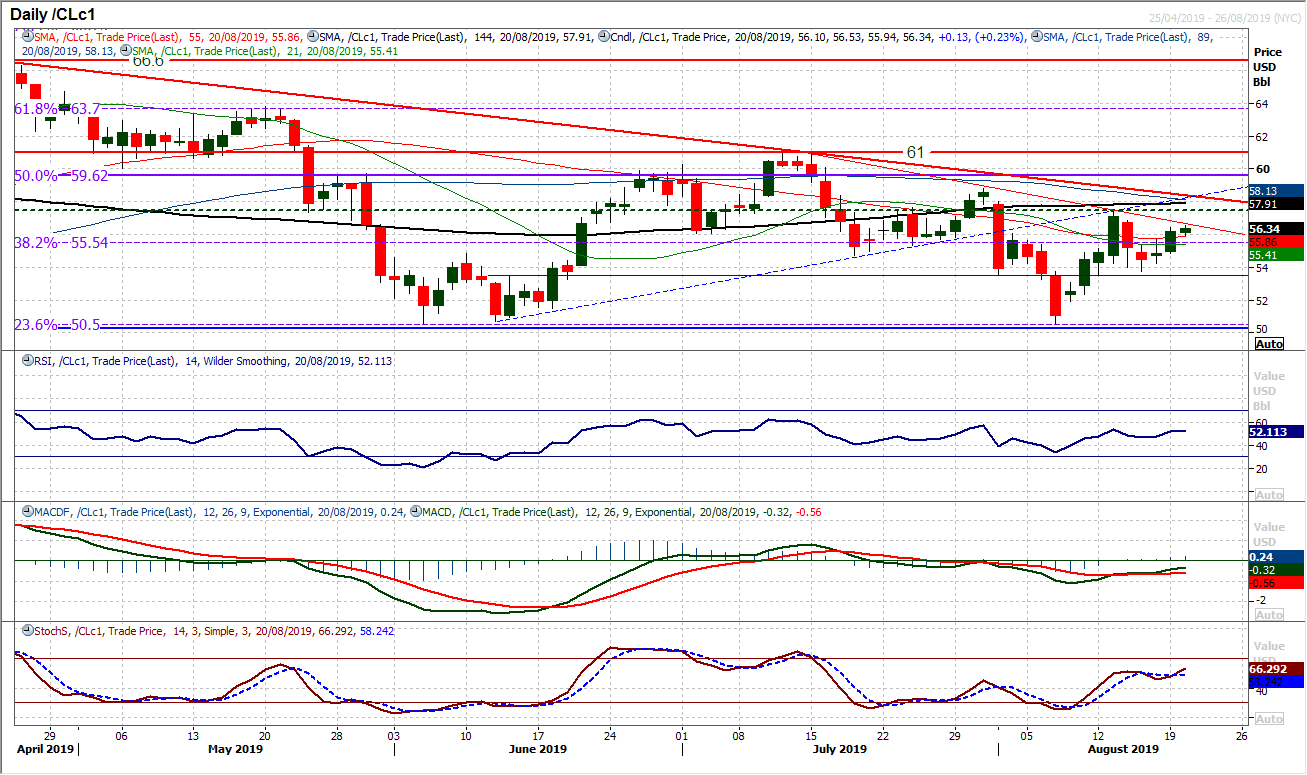
Improved broader market sentiment has allowed oil to tick higher. This move is still well within the confines of a negative medium term outlook (of lower highs and negative momentum bias) and for now is likely to be the source of another chance to sell. The medium term downtrend comes in around $58.20 today whilst the overhead resistance of the recent high at $57.50 and the old pivot at $57.90 is restrictive. However, on a near term basis holding above $55.55 (38.2% Fib) is a positive and helps to bolster the support at $53.75. There are enough mixed signals to be cautious with this near term move, but given the market has opened higher again today, it is worth just playing a wait and see for now.
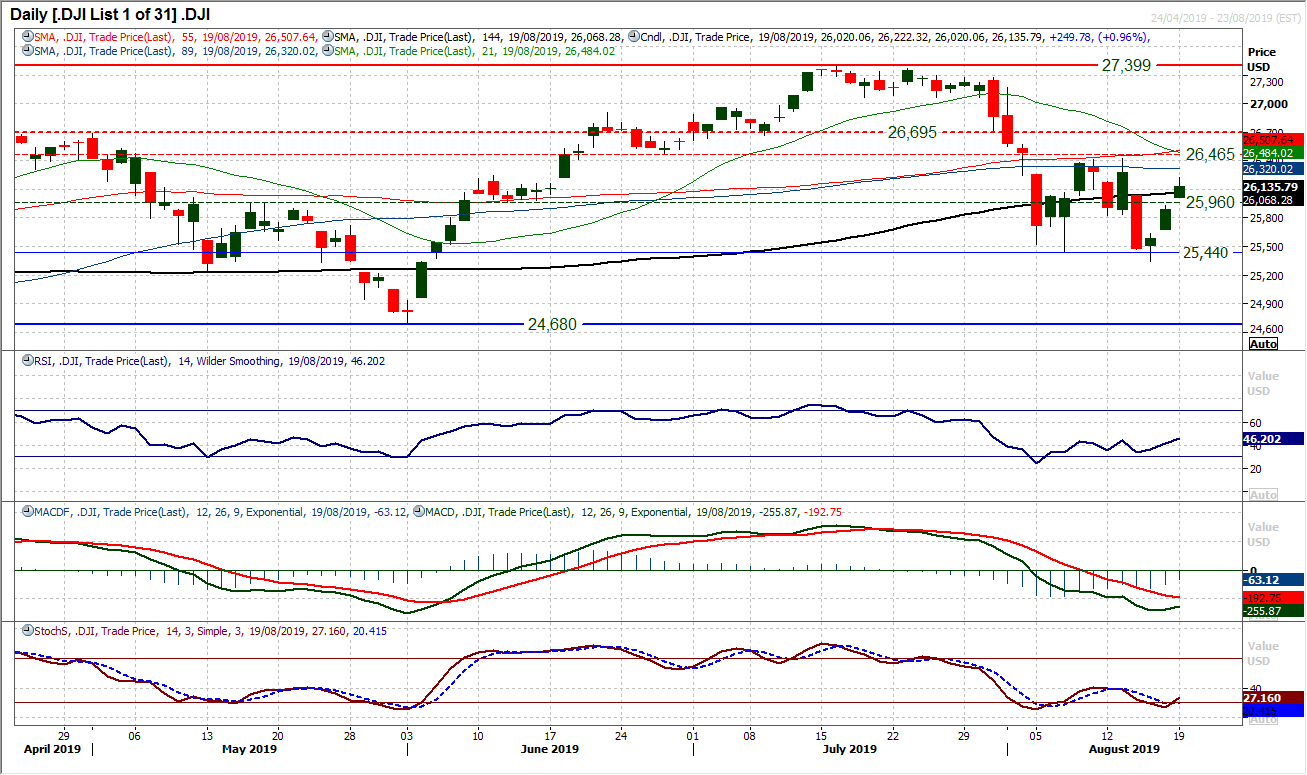
The rebound on Wall Street is progressing well. Three days of positive closes and two successive gaps higher that have been left behind. This suggests a market intent on pushing higher. However the big test lies ahead, with the resistance recently left around 26,425 and the old pivot at 26,465. There is a notable pick up in the RSI, but currently still below 50 so this also needs to be rectified. Stochastics are crossing higher whilst MACD lines are also showing signs of a potential turn around. The groundwork is being laid on momentum indicators for a sustainable recovery now, but more needs to be done to suggest this is more than just a near term rally that will be sold into. The resistance band 26,425/26,465 is key as this would also take the market back above all the moving averages too. The hourly chart shows a market positioning more positively, but is still not in bullish configuration yet. The latest gap is unfilled but is supportive at 25,930 and yesterday’s traded low at 26,020 initially a basis of support.
"""DISCLAIMER: This report does not constitute personal investment advice, nor does it take into account the individual financial circumstances or objectives of the clients who receive it. All information and research produced by Hantec Markets is intended to be general in nature; it does not constitute a recommendation or offer for the purchase or sale of any financial instrument, nor should it be construed as such.
All of the views or suggestions within this report are those solely and exclusively of the author, and accurately reflect his personal views about any and all of the subject instruments and are presented to the best of the author’s knowledge. Any person relying on this report to undertake trading does so entirely at his/her own risk and Hantec Markets does not accept any liability. """
