Market Overview
Although the immediate geopolitical risk of the Iran/US missile exchanges in Iraq has been put on the back burner for now, the issue will continue to rumble on. This is likely to be a drag on Treasury yields in the coming weeks however, for now the near term focus switches back to the trade dispute and to “phase one” again. On Wednesday, the US and China are expected to sign the first section of their trade agreement. Risk appetite is positive (the VIX hit its lowest in two weeks on Friday, whilst the Chinese yuan strength is at five month highs to drag USD/CNH under 6.90 this morning). The market is anticipating phase one to be signed, but when it comes to the US and China, anything could still happen. Although Treasury yields are hovering, elsewhere the risk improvement is showing through, with gold slipping back whilst the yen is also sliding and equities are supported. This the forex space, one big mover is a drop in sterling. There is an increasing number of Bank of England MPC members talking of the prospects of rate cuts. One of the more dovish members, Gertjan Vlieghe suggesting that he would likely be voting for a rate cut in the next meeting. This is the third dovish comment (alongside Governor Carney and Silvana Tenreyro) in the space of a few days.
Wall Street closed slightly lower in the wake of a drab Non-farm Payrolls report on Friday (S&P 500 -0.3% at 3265) but US futures are rebounding today (+0.3% currently). This has allowed Asian markets a bounce with the Nikkei +0.5% and Shanghai Composite +0.8%. In Europe there is a mild recovery with FTSE futures and DAX futures both around +0.1% higher today.
In forex markets, there is a slight risk positive bias, with AUD and NZD higher, whilst JPY and CHF are mildly weaker. The big mover is GBP where key lurch lower on Cable by around half a percent has been seen. In commodities there is a drop back on gold and silver by over half a percent, whilst oil is beginning to consolidate.
There is a UK focus on the economic calendar today. Monthly UK GDP for November is at 0930GMT and is expected to be flat on the month (0.0% in October) with the year on year growth at +0.6% (down from +0.7% in October). UK Industrial Production for November is expected to fall by -0.2% on the month (after growth of +0.1% in October) which would pull the year on year decline back to -1.4% (from -1.3% in October). The UK Trade Balance for November is at 0930GMT is expected to see the deficit improve to -£11.7bn (from -$14.5bn in October).
Chart of the Day – AUD/JPY
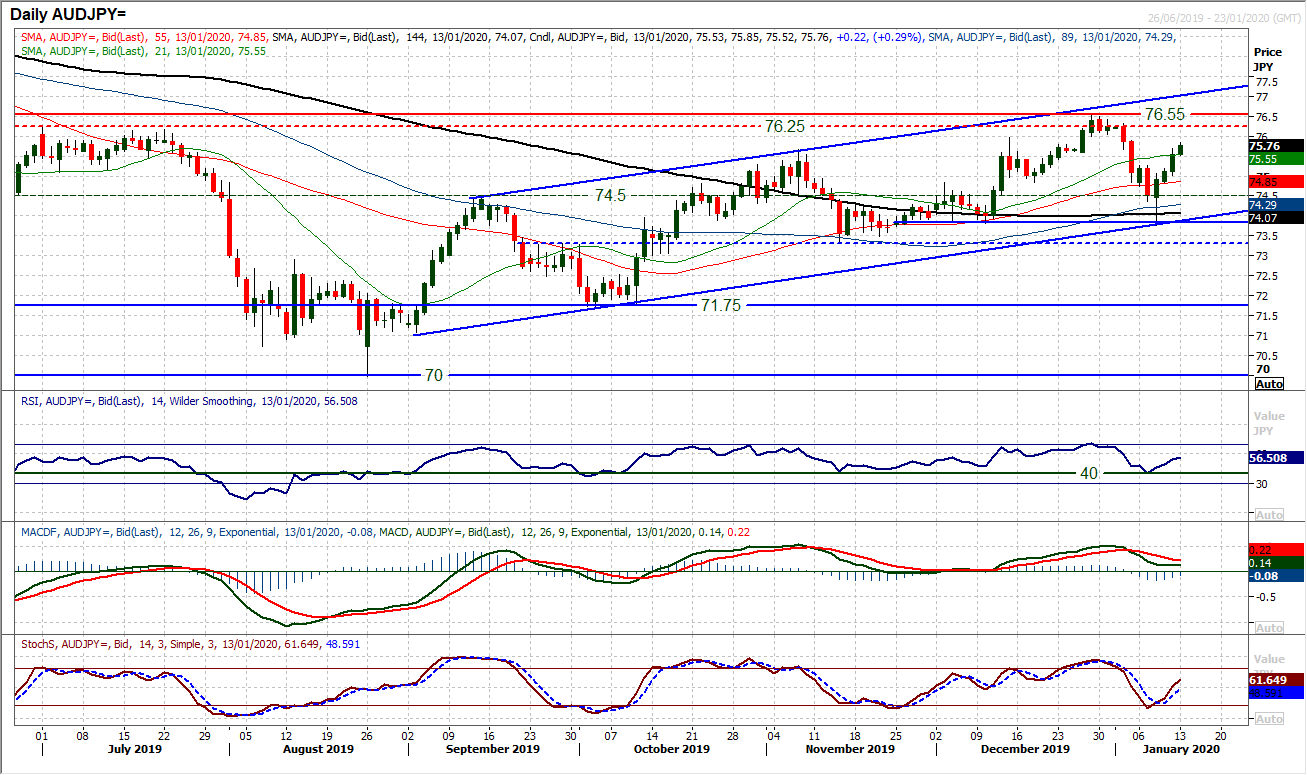
We have been looking at a risk recovery in recent sessions and this is once more evident through the outlook on Aussie/Yen. A near term corrective move back from 76.55 in December to bounce off 73.75 last week effectively now has formed an uptrend channel of the past four months. Now we see three consecutive strong bull candles have swung the market back into a renewed upward phase again. The uptrend channel is reflected across momentum indicators where the RSI is picking up consistently on the corrections around 40, whilst MACD lines are again holding above neutral and the Stochastics are accelerating higher from a bull cross. The market is now primed to test the resistance band 76.25/76.55 in the coming days. Near term corrections should be seen as a chance to buy. Immediate resistance is an old pivot around 76.00. On the downside, near term breakout support is at 75.25 with an old pivot at 74.50.
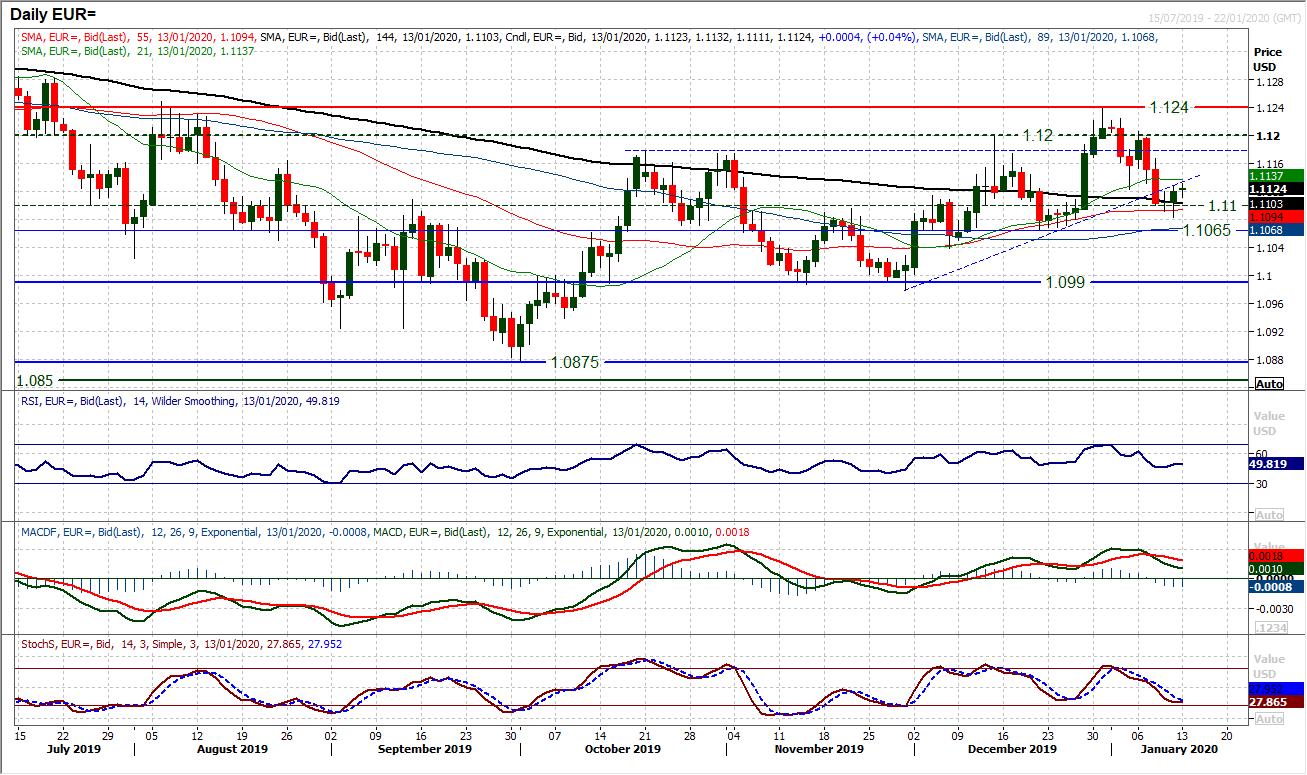
Holding the old pivot around $1.1100 has helped to settle down the corrective momentum of early January. Can the euro now begin to build upon the support around $1.1185 with a run positive sessions now? Momentum indicators suggest a continuation of waves in bull rebounds and bear corrections, but with little real conviction in the market. Moving averages are all but flat whilst RSI, MACD and Stochastics indicators are one more turning higher before any decisive directional outlook can be ascertained. We look therefore for a likely continuation of moves that disappoint. The market is edging higher again today, but once more with little conviction. Initial resistance is at $1.1150/$1.1170 under the more considerable $1.1185/$1.1200 area. Below $1.1065 would be a key move for a bearish direction.
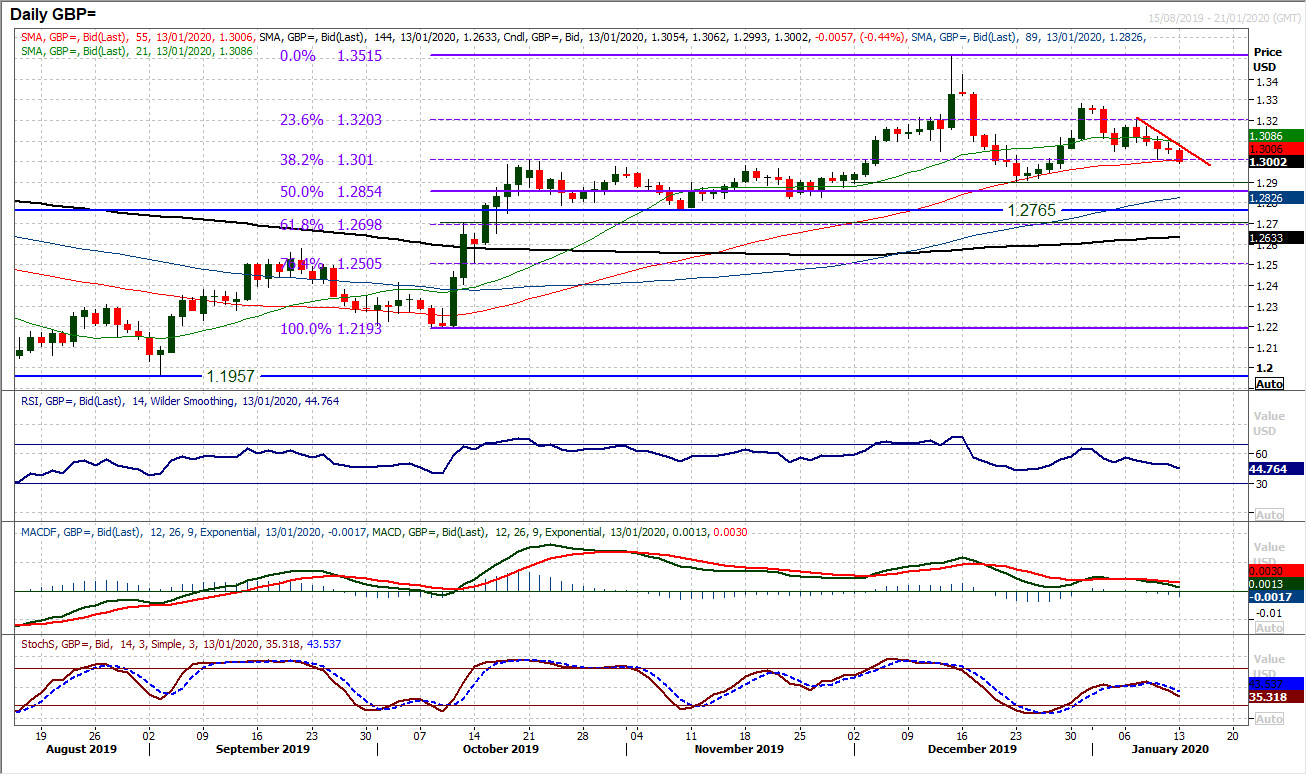
We see that Cable is once more drifting back towards the key support band $1.2900/$1.3010. Whether this proves to be a buying opportunity will be extremely interesting now. We believe that Cable is a medium term positive outlook above $1.3000, however, near term technical indicators are a drag on that outlook. Almost since the turn of 2020, sterling has been under consistent pressure. This is not being helped by the dovish comments of now three Bank of England voting members. Cable has been dragged back to the key support of the 38.2% Fibonacci retracement (of $1.2192/$1.3515) at $1.3010. We see this (and the key December low at $1.2900) to be a key floor area for Cable if the medium term positive outlook is to remain intact. Momentum indicators are still positively configured on a medium term basis but are sliding back once more (towards 40 on RSI and neutral on MACD). This is becoming a key test of support for the bulls. Initial resistance at $1.3095 is increasingly important now.
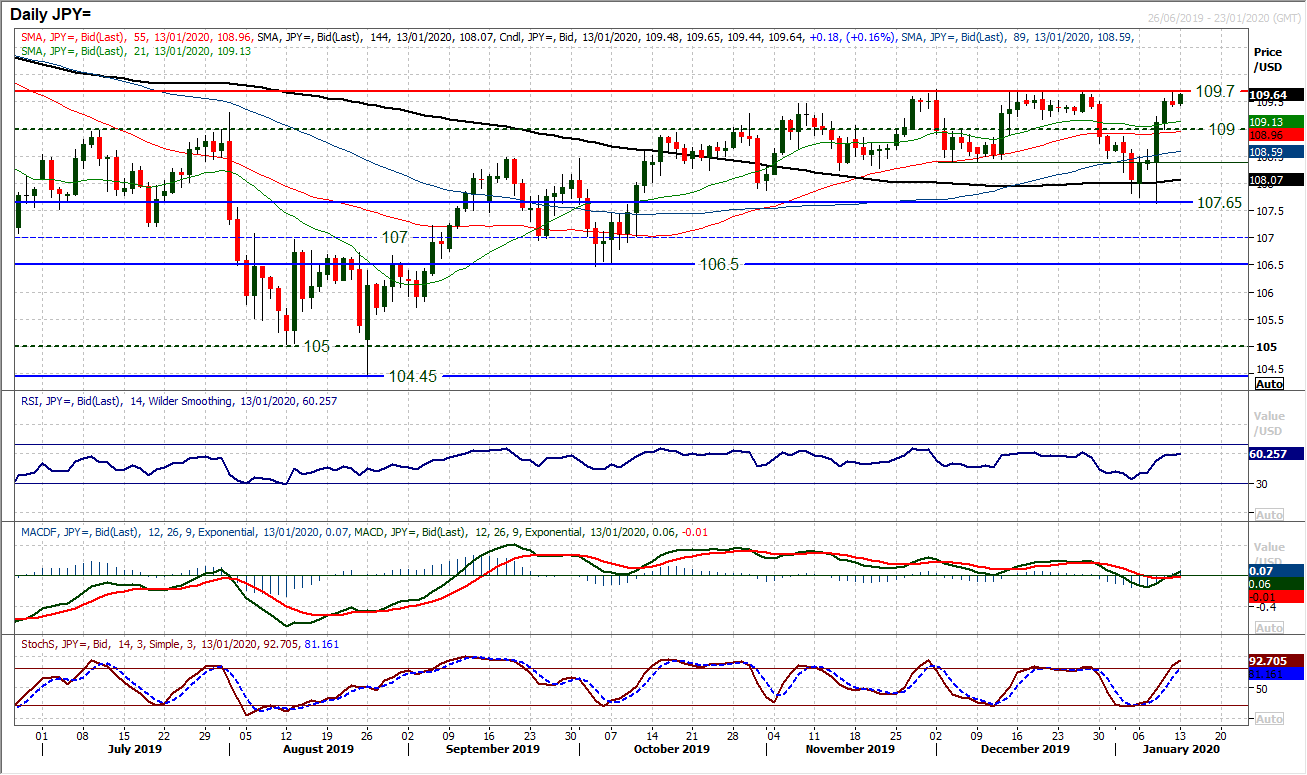
The bull swing higher that came in the wake of the dialling down of geopolitical tensions has been running out of steam as the key resistance at 109.70 has come under scrutiny again. This seems to be a key moment as consistently over recent months we have seen resistance levels tested and even if breached, only manage to do so on an initial break basis. Subsequent consolidation has followed a break only to then retrace. Into Monday morning, the bulls are still looking well set for now, but momentum indicators are pulling higher towards key ranging levels again. The RSI has tended to come a cropper around the 60/65 mark, whilst Stochastics struggle just as they get towards 80 (around where they are now). It is for this reason, we would view any prospective break above 109.70 with caution. Initial resistance would then be at 109.90 before 110.65, however beware the often seen retracement. Initial support at 109.00/109.20.
Gold
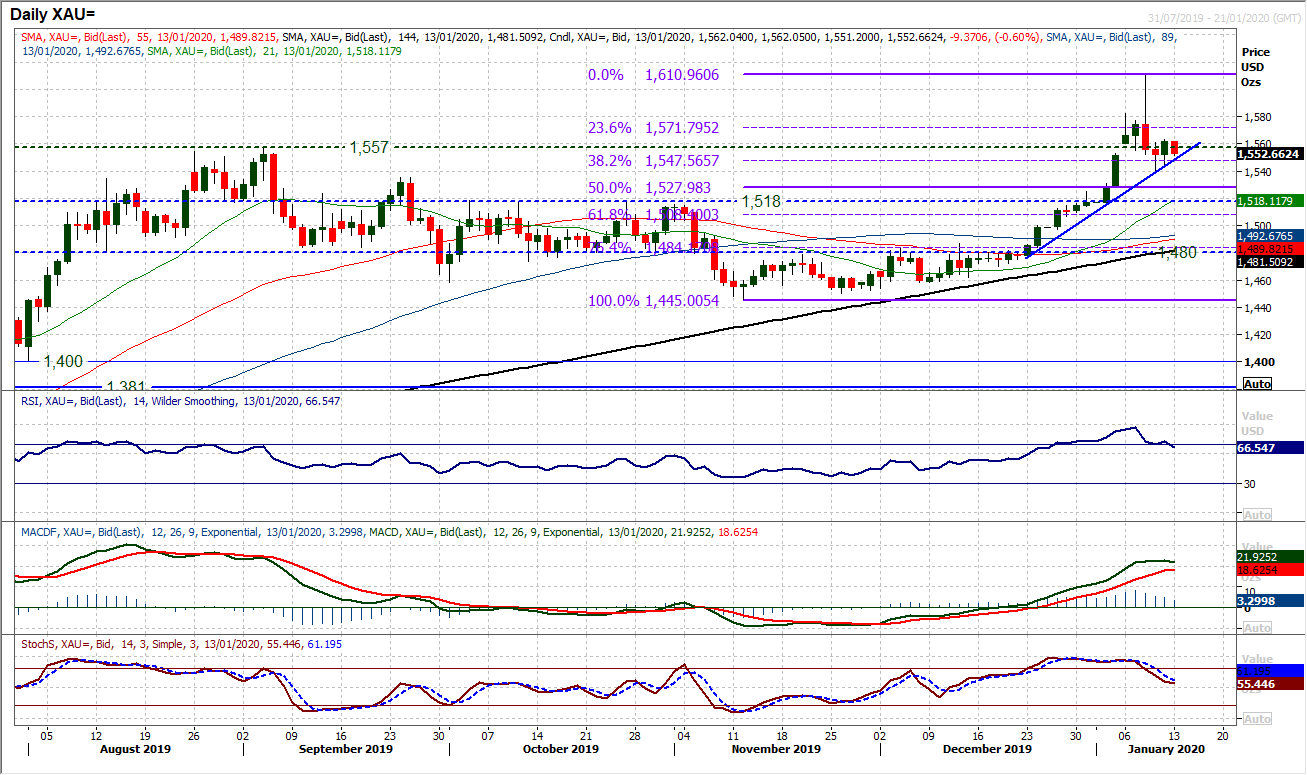
Is this the point at which we begin to see gold finding its feet once more? The sharp unwind of the bull run to $1610 has already unwound 38.2% Fibonacci retracement (of the $1445/$1610) around $1548 and the gold bulls began t look more confident again on Friday with a positive candle that has taken the market back up from 38.2% Fib again. It is also interesting to see the positive candle of Friday forming an uptrend of the past three weeks (which comes in around $1548 and which coincides with the 38.2% Fib again). Gold became extremely overbought recently and a retracement was a natural consequence, but once the bulls dusted themselves off, the outlook remains positive. Once the support looks to be solid, then the confidence levels will grow again. Friday’s high of $1563 is initial resistance now. A move back under $1540 would open for a deeper correction, but for now, this is a consolidation developing.
WTI Oil
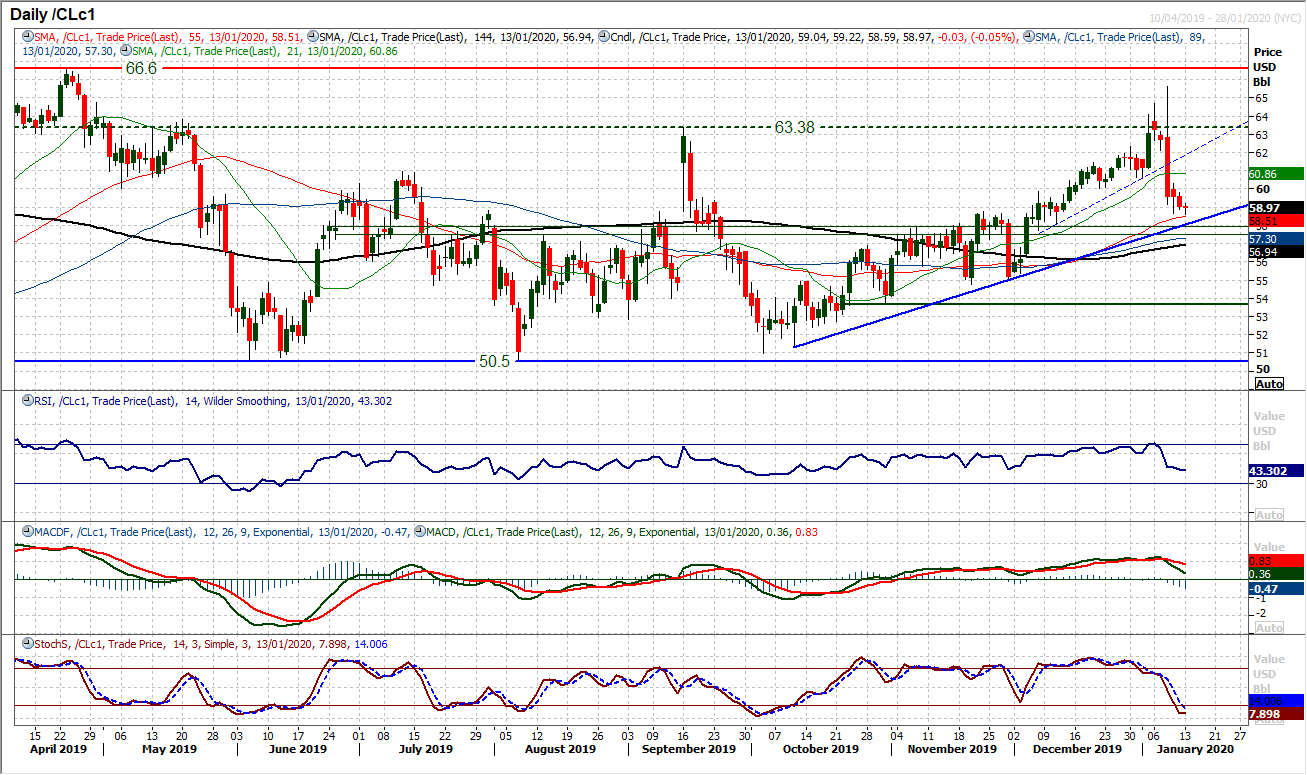
WTI is still unwinding back towards medium term key support levels as the retracement from the big bull run has continued. Coming into this week though there is a band of old pivot support that the bulls will be looking at between $57.50/$57.85. There is also the support of the three month uptrend (around $58.00 today). This is therefore an area where the bulls will be looking at for the next higher low. Momentum has unwound back towards areas where the bulls have also previously built support (around 40 on RSI is prime). So to see the early positive rebound off $58.60 today will be encouraging, but the move needs to push back above initial resistance around $60.00 to really take a positive outlook again. We are still confident of the medium term positive outlook on oil, but support needs to form soon. Below the 144 day moving average (at $57.30) would breach all realistic support levels, whilst below $55.00 is bearish again.
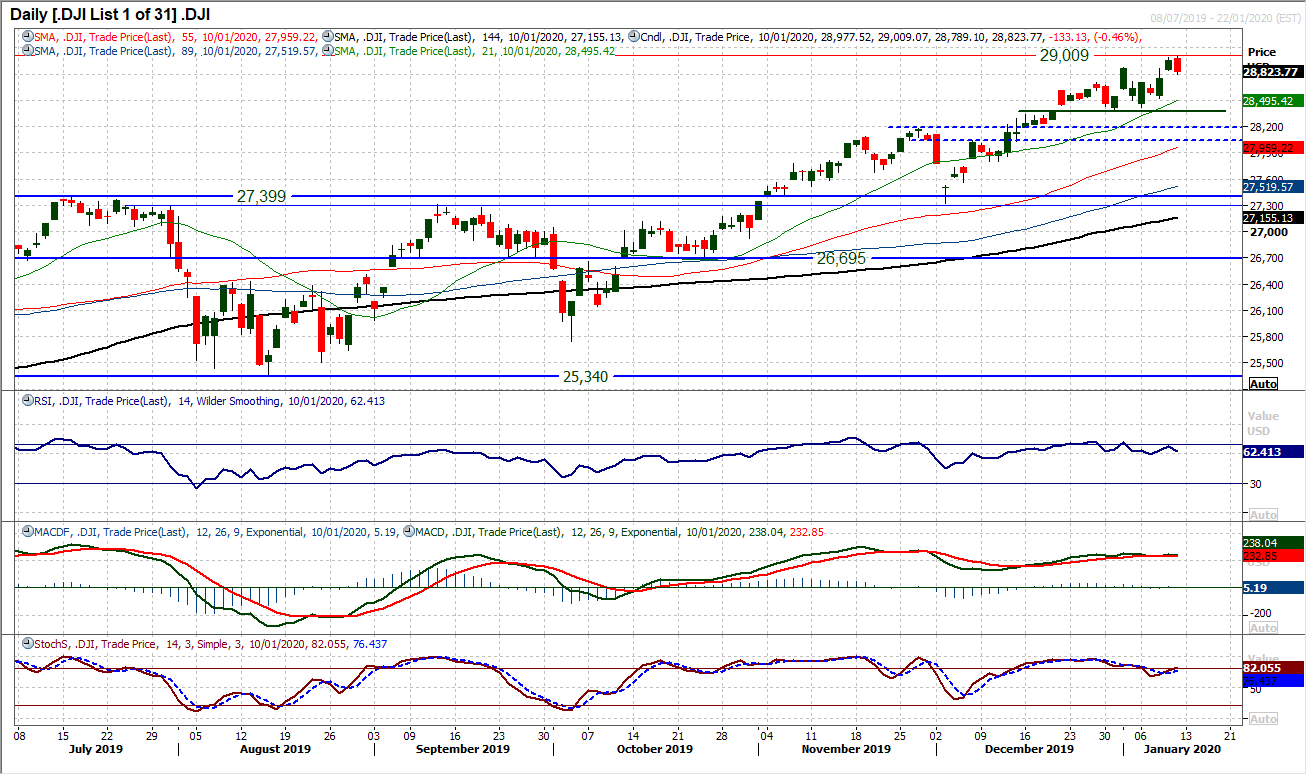
The slightly softer than expected payrolls data on Friday resulted in a mild slip back on the Dow. The session was a bearish engulfing candle (and bear key one day reversal) which means that we need to be a little be more cautious in the coming days. Whilst this is not a chart that screams correction, the negative candle on Friday is a near term drag on the outlook and warning sign for a correction. The late December support at 28,376 is the key near term support of note and whilst this is intact there is little that the bulls need to be overly concerned by. A near term slip would even likely be considered to be a buying opportunity. For now, momentum is still positive (without being exceptionally strong), with the RSI in the 60s, along with MACD lines looking positively configured. There is certainly a case for a near term correction now, back from a traded all-time high of 29,009 on Friday.
"""DISCLAIMER: This report does not constitute personal investment advice, nor does it take into account the individual financial circumstances or objectives of the clients who receive it. All information and research produced by Hantec Markets is intended to be general in nature; it does not constitute a recommendation or offer for the purchase or sale of any financial instrument, nor should it be construed as such.
All of the views or suggestions within this report are those solely and exclusively of the author, and accurately reflect his personal views about any and all of the subject instruments and are presented to the best of the author’s knowledge. Any person relying on this report to undertake trading does so entirely at his/her own risk and Hantec Markets does not accept any liability. """
