Market Overview
Positive US data along with strong earnings from Morgan Stanley (NYSE:MS) helped to propel risk appetite yesterday and this has been added to overnight with encouraging economic data out of China.
A third month of US retail sales growth and an encouraging reading to the regional Philly Fed survey helped to swing Treasury yields higher, allowing the dollar to recover. Most impressive of all though has been the latest sharp move higher on Wall Street into all-time highs, something which is happening on an almost daily basis. The move has undoubtedly been ushered through via the hand of the liquidity operations from the Fed in recent weeks; however, getting “Phase One” signed, along with positive economic data and a decent start to earnings season have all pushed sentiment to a whole new level. Whilst moves on forex majors still seem to be fairly muted, the yen is once more weakening and there are even signs of a retreat on the strength of the Swiss franc. Oil is beginning to find support again, whilst equities are the place to be right now. Although there are always questions over how long this move can last, for now, the train is still running.
Chinese data certainly encouraged overnight. China Q4 GDP was in line with expectations, holding at +6.0% (+6.0% exp, +6.0% in Q3) which meant +6.1% for 2019 . However, following decent trade data for December a few days ago, China Industrial Production also showed strongly at +6.9% (+5.9% exp, +6.2% last), with China Retail Sales also encouraging at +8.0% (+7.8% exp, +8.0%).
There is a clutch of data points to be on top of today on the economic calendar. At 09:30 GMT UK Retail Sales are expected to grow by +0.5% on an adjusted ex-fuel basis in December (following a -0.6% decline in November), with the year on year data picking up to +2.9% (from +0.8% in November). The final reading of Eurozone inflation is at 10:00 GMT which is expected to show no change to the headline HICP at +1.3% (+1.3% flash, +1.0% final November), with core HICP to remain again at +1.4% (+1.4% flash, +1.4% final November).
On to US data, Building Permits at 1330GMT are expected to reduce slightly to 1.468m in December (from 1.474m in November), and Housing Starts expected to improve slightly to 1.375m (from 1.365m in November). US Industrial Production at 1415GMT is expected to fall by -0.2% in the month of December (after an increase of +1.1% in November), with Capacity Utilization dropping back to 77.1% (from 77.3% in November). Finally, the prelim reading of Michigan Sentiment in January is expected to tick slightly higher to 99.3 (from 99.2 in December), with the Michigan Current Conditions component expected to drop a touch to 115.0 (from 115.2) and Michigan Expectations component to improve to 89.0 (from 88.9).
There are more Fed speakers today with the Patrick Harker (voter, mild hawk) at 14:00 GMT, and Randall Quarles (voter, centrist) at 17:45 GMT.
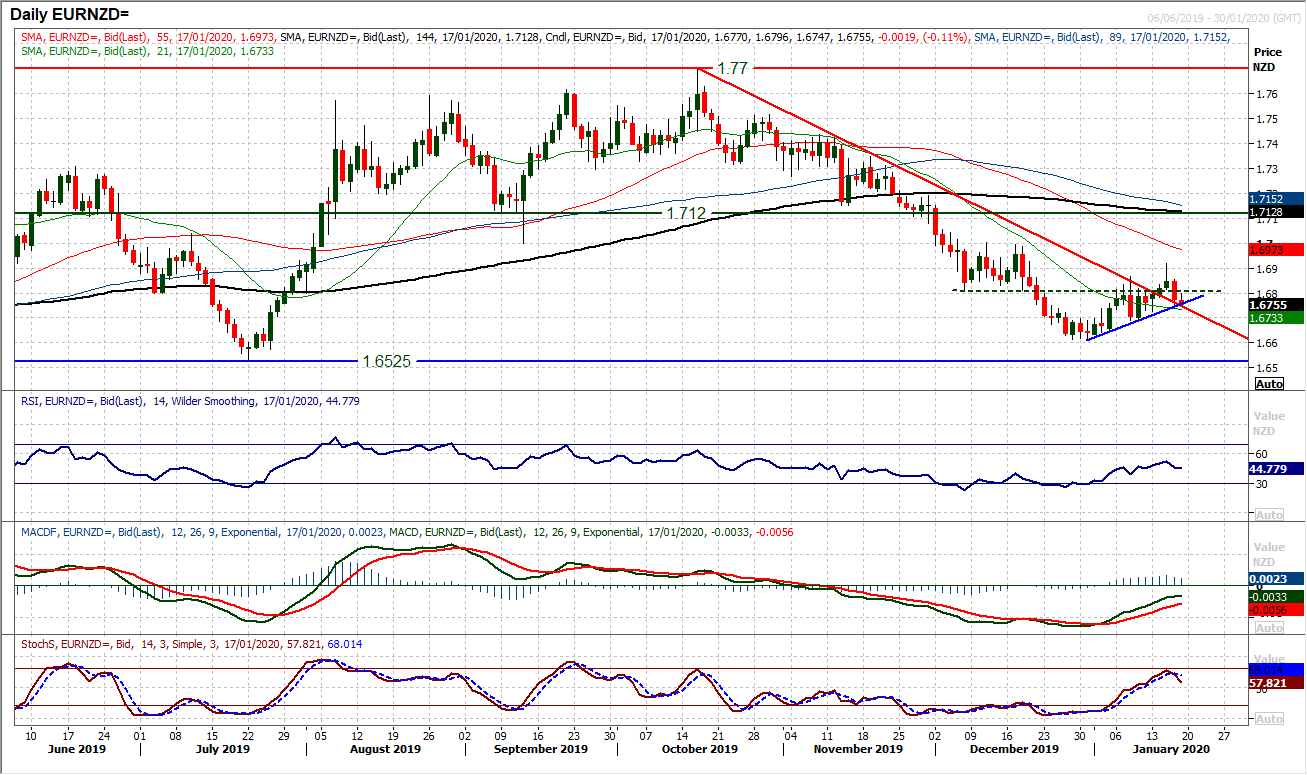
Chart of the Day – EUR/NZD
We have been looking at the recovery of the euro recently, and when crossed with a corrective looking Kiwi, this has driven a rebound on EUR/NZD. However, the move has been questioned by a sharp bear candle yesterday which suggests the market is at a key turning point. Until now, in the past couple of weeks, near term corrective slips have been bought into. This has formed an uptrend whilst also breaking a three month downtrend. Both trendline were tested yesterday and held into the close. This test continues this morning. Momentum indicators have been in decisive recovery mode, but has yesterday’s bearish session been a turning point? The RSI holding above 40 (the point where the recent higher low turned higher) is important now. The 21 day moving average is a gauge of support (currently 1.6735), but if the market continued lower today to breach the higher low at 1.6690 then it would suggest a euro recovery is still some way off. The bulls will subsequently see the near to medium term pivot around 1.6810 as a gauge, to regain upside initiative. The confluence of trendlines will also gauge the level of support for the recovery.
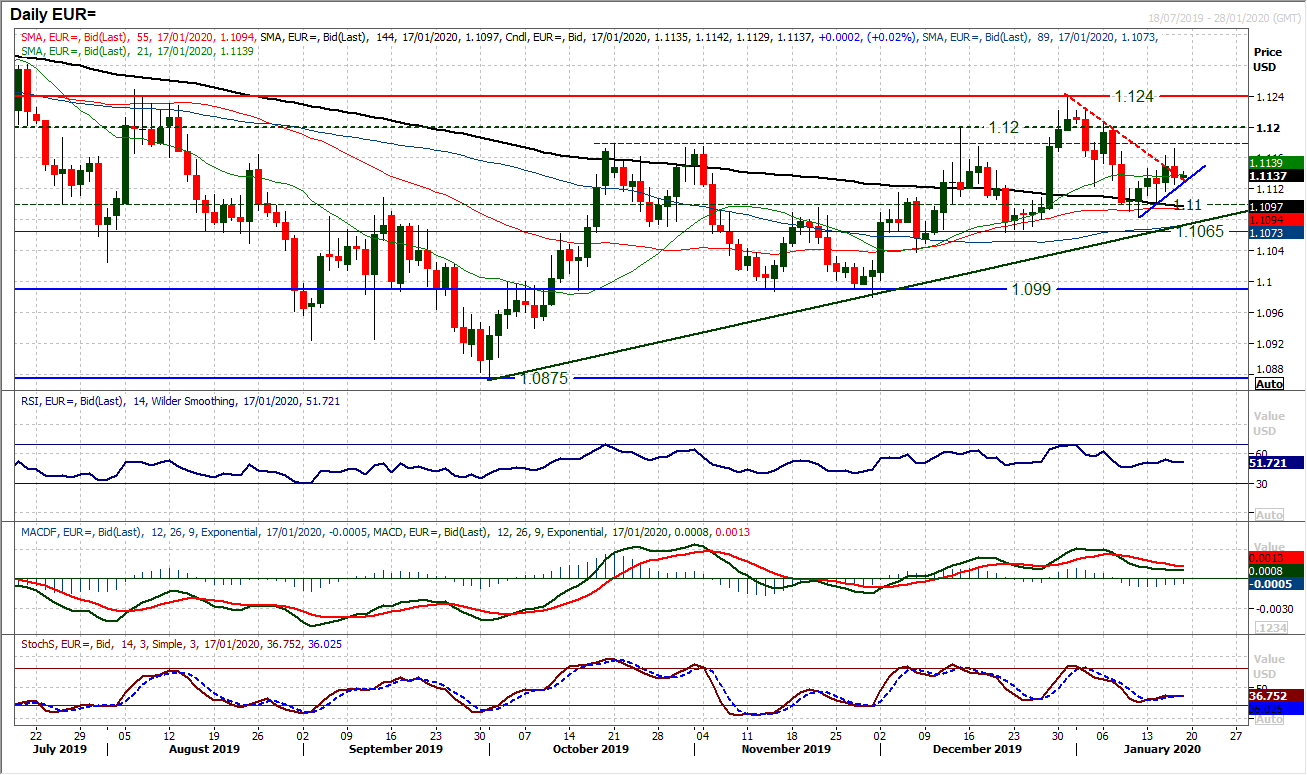
Can the euro continue to pull higher with a growing near term uptrend? In the past week there has been a run of buying into weakness which has formed a mini uptrend (at $1.1130 today). This move has broken a two week downtrend and needs to hold the nascent uptrend for the renewed move higher to remain on track. There is still a positive bias to the recovery over the past three months of uptrend and higher lows. We remain mildly euro positive whilst this continues. This raises the importance of the support at $1.1085 initially, but also $1.1065 on an ongoing basis (until $1.1240 is breached). Momentum retains a mild positive configuration to buy into weakness. The target initially is to break through yesterday’s high of $1.1170 and test $1.1200. The hourly chart shows a near term pivot area around $1.1120/$1.1130 is a basis of support coming into today’s session.
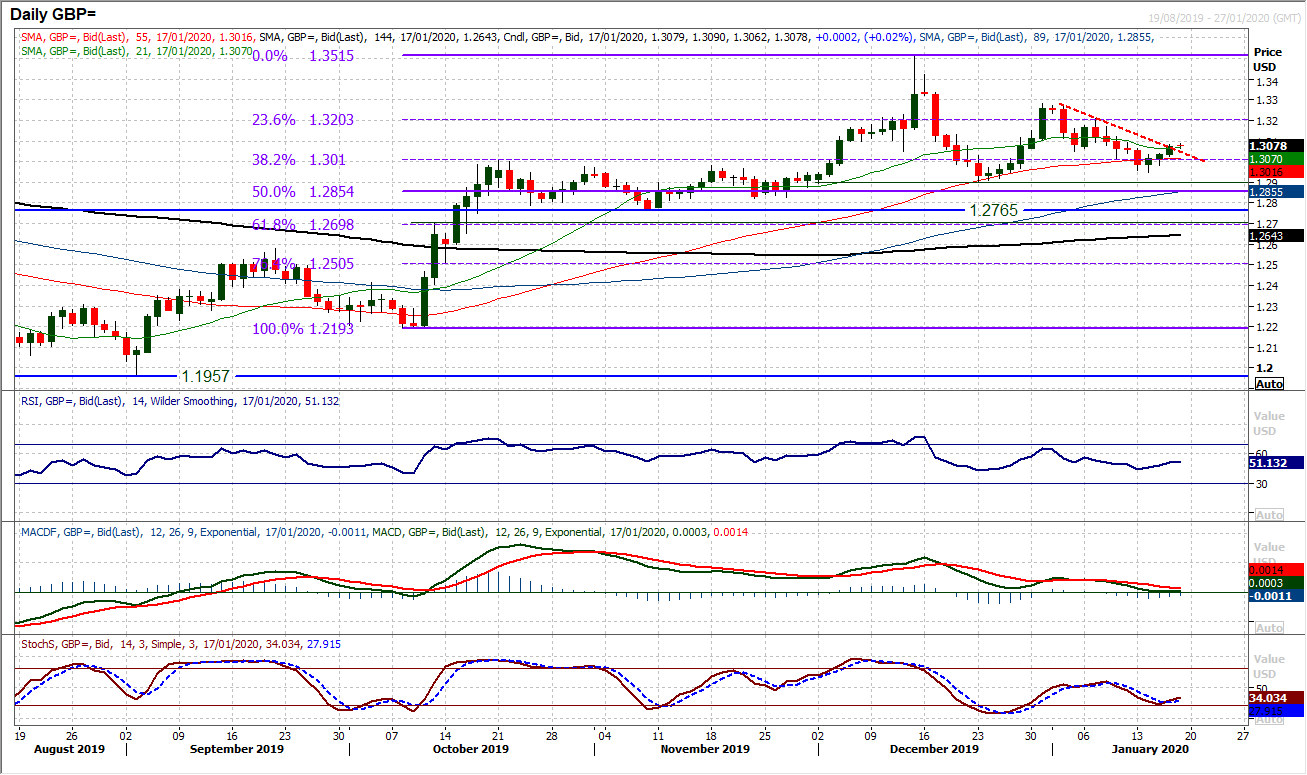
We have been talking up the positive prospects of Cable being supported around $1.2900/$1.3000 over recent weeks. This continues to build as the market has now formed three consecutive positive closes and looks today to be breaching a mini two week downtrend. Momentum indicators are picking up around their medium term buying opportunity levels (around 40 on RSI, around neutral on MACD and Stochastics swinging higher a shade above 20). The hourly chart shows the building recovery well, with a move now decisively above $1.3050 which has been a near term pivot level. The hourly RSI is also consistently in positive configuration (above 40, whilst pushing 70) in recent sessions and hourly MACD lines are above neutral. This points to buying into weakness. An initial support band is building $1.3025/$1.3050, with $1.2985 being a higher low above $1.2950 now. A decisive move through $1.3095 today would open the recovery for further upside today. Above $1.3130 opens the key reaction high of $1.3210.
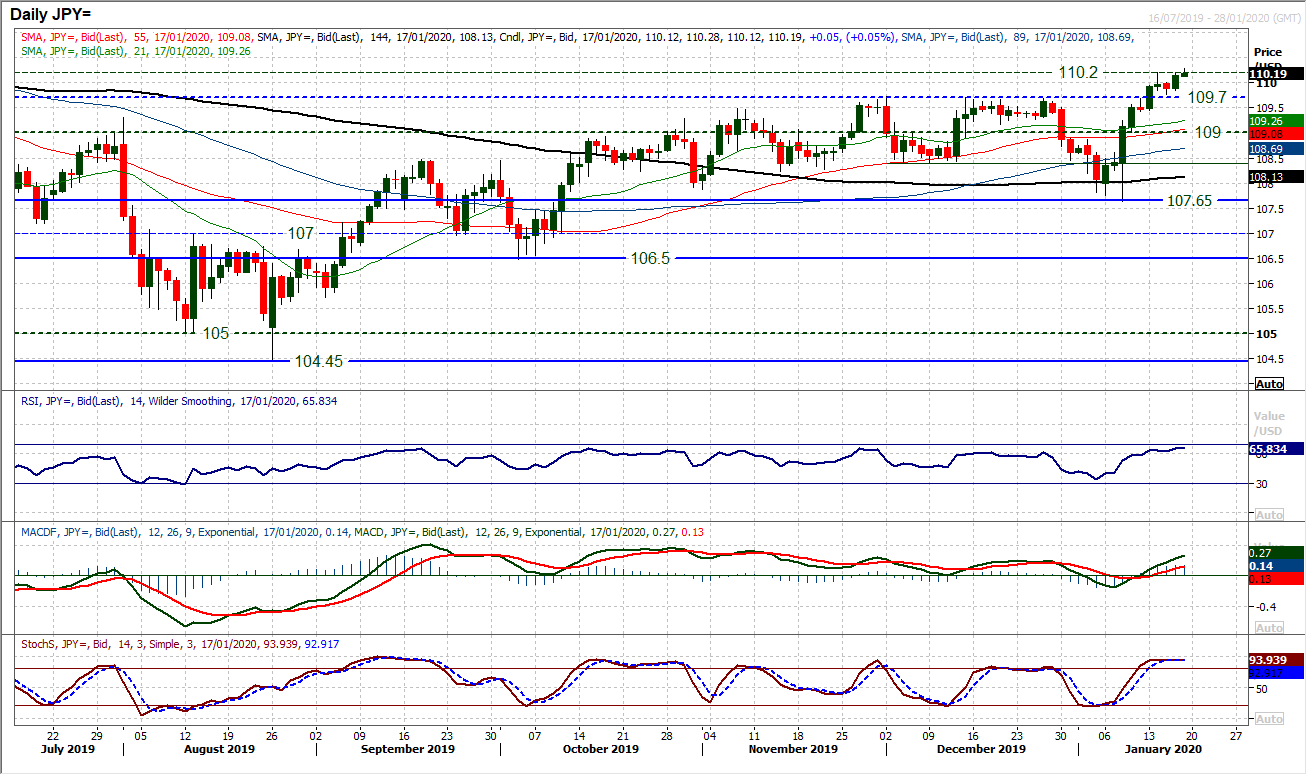
Is this time different for Dollar/Yen? We have been concerned that the original break above 109.70 had begun to stall in a similar fashion to so many previous attempted breakouts. However, the bulls regained their strength yesterday to post a decisive positive candle and this morning 110.20 is being breached. It should not go unnoticed that this is also coming as the RSI is pushing above 65 (so consistently around where the bulls have faltered since September). It would mean that this move is being confirmed (if seen on a closing basis). After Wednesday’s low (at 109.75), the 109.70 breakout is being left as support now and is increasingly important to hold. A close clear of 110.20 would be a significant move and open the upside for 110.65 (the May high).
Gold
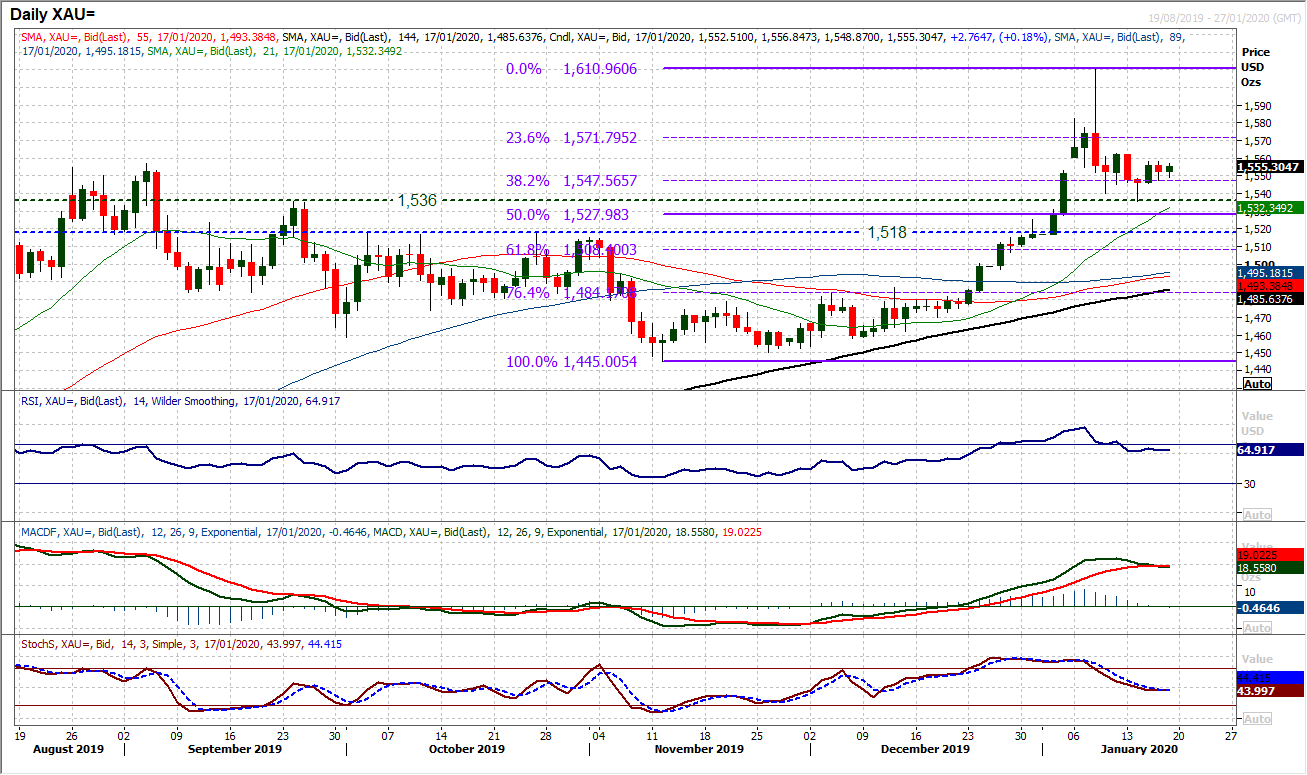
The volatility of the spike higher and subsequent retracement on gold is settling down. It is interesting to see that having briefly been breached earlier in the week, the 38.2% Fibonacci retracement (of $1445/$1610) at $1548 is becoming a floor that the bulls are working from. This comes as the consolidation continues to build. The corrective momentum of momentum indicators is moderating now, with the Stochastics bottoming out and importantly, the RSI holding well above 60. The market is looking for the next catalyst, but it is notable that even with broad risk appetite picking up, gold is holding firm. There is a stable look to moves on the hourly chart with $1536/$1563 becoming the range. Within that $1546/$1558 is a tighter range of the past couple of sessions. We continue to view gold as a medium term buy into weakness and the potential is that the corrective move of the past week has now played out. Support at $1536 is increasingly important, especially if the market moves above $1563.
WTI Oil
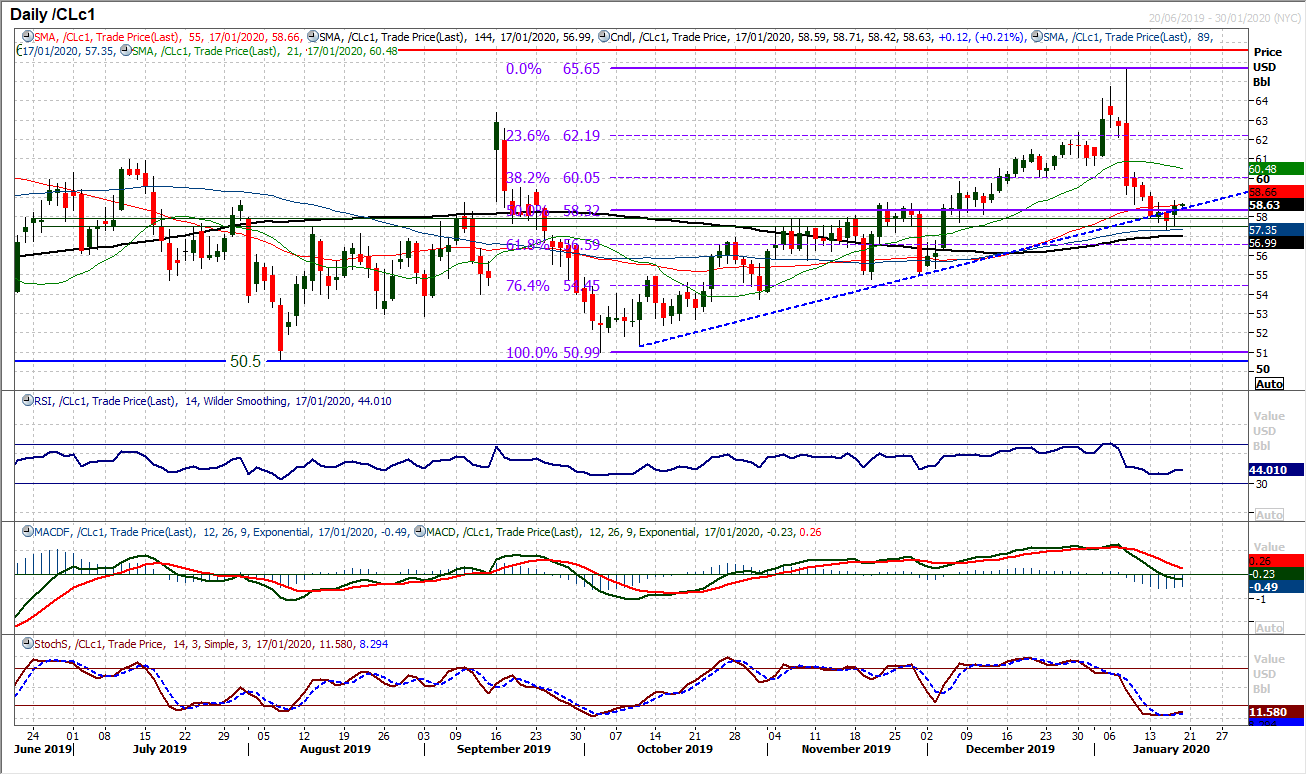
The last few sessions have hinted that oil could now be building support once more. A massive retracement of the December into January rally has been seen over the past week and a half, but there are signs of stabilisation. Two positive candles in the past three sessions is suggesting a shift in market sentiment. Whilst the $57.50/$57.85 pivot band may not have been solid to the cent, it has still acted as a strong gauge and once more seems to be tempting the bulls back in. With the RSI again beginning to swing higher (from a shade under 40) as it has done on several occasions in recent months, this could be another corner being turned. The hourly chart shows a decent pick-up yesterday above resistance at $58.70 which now needs to be traded clear for the bulls to generate recovery momentum. The old resistance around $60.00 then needs to be negotiated.
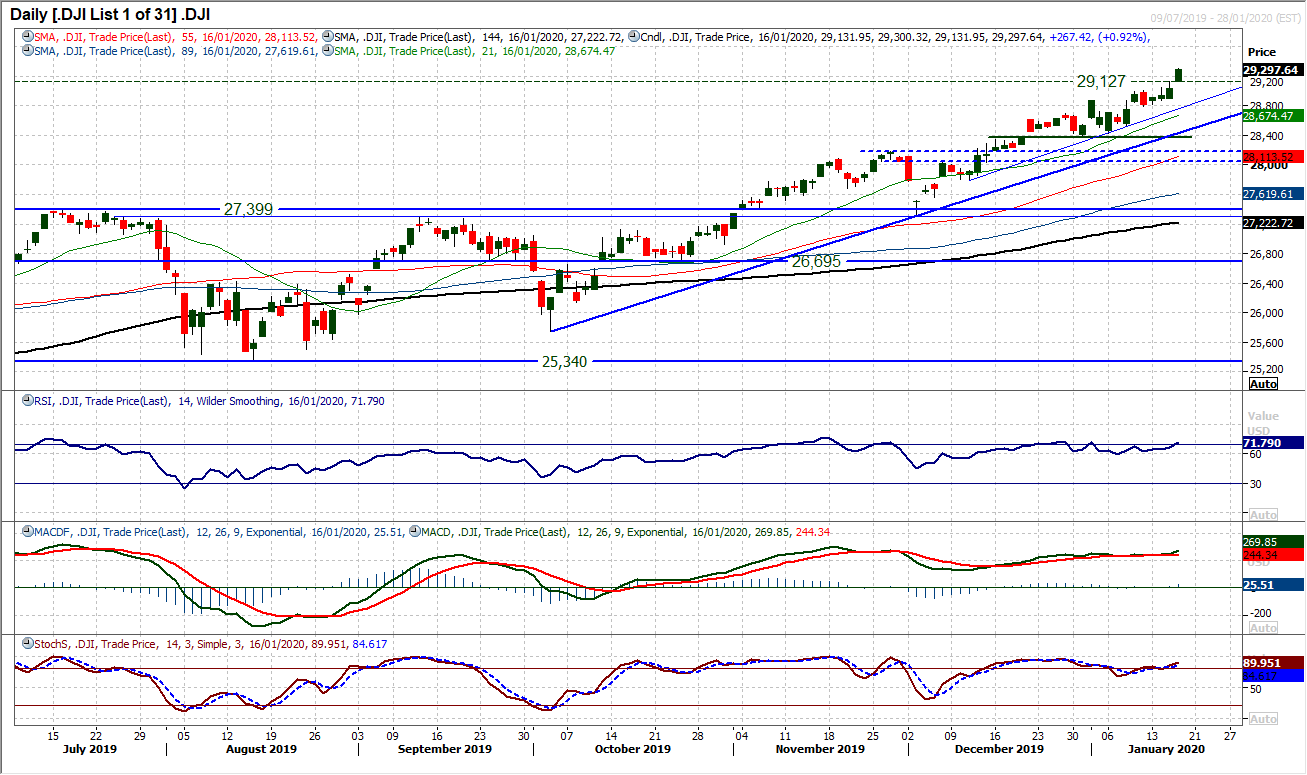
There seems to be nothing to stop the Dow at the moment as new all-time highs are being posted on almost a daily basis (in five of the past six sessions). The latest breakout came with a gap higher and a close all but at the high of the day. Momentum is strong, with the RSI ticking back above 70 whilst MACD lines are edging higher again (after a period of being flat) and Stochastics are also strong. Intraday weakness has been seen as a buying opportunity for almost three weeks now. In ten of the past twelve sessions there has resulted in a positive one day candlestick. There is a breakout band of support 28,789/29,010 and with a five week uptrend sitting at 28,790 today there is much for the bulls to be positive about. In the absence of any exhaustion signals we are happy to stick with the trend higher.
"""DISCLAIMER: This report does not constitute personal investment advice, nor does it take into account the individual financial circumstances or objectives of the clients who receive it. All information and research produced by Hantec Markets is intended to be general in nature; it does not constitute a recommendation or offer for the purchase or sale of any financial instrument, nor should it be construed as such.
All of the views or suggestions within this report are those solely and exclusively of the author, and accurately reflect his personal views about any and all of the subject instruments and are presented to the best of the author’s knowledge. Any person relying on this report to undertake trading does so entirely at his/her own risk and Hantec Markets does not accept any liability. """
