Market Overview
There is a continued edge of positive risk appetite in markets amidst a consistent drip feed of encouraging newsflow surrounding the US/China trade talks. Whilst there is nothing as yet concrete, there is a growing expectation that a deal is closing in.
Telephone conversations between the top trade delegates of both sides suggest an open dialogue, whilst the move by China at the weekend to help protect intellectual property rights certainly appears to paint a picture of progress. However, two bills on the relationship with Hong Kong sit on President Trump’s desk, waiting for his decision. Veto the bills would appease China, but be domestically difficult; whilst signing the bills would induce a response from China that may harm the prospects of “phase one”.
Markets are slightly muted today, but retain positive risk appetite, with the Vix volatility closing at its lowest level since October 2018. Treasury yields are muted (perhaps with Thanksgiving on Thursday in mind), but an edge of dollar positive/risk positive is still creeping through markets. However, decisive direction is unlikely without President Trump’s decision on the Hong Kong bills and/or “phase one” being unresolved.
Positive risk appetite pulled Wall Street strongly higher with the S&P 500 closing at an all-time high +0.8% at 3133. US futures continue to hold this ground +0.1% today which is helping Asian markets to build support (Nikkei +0.4% and Shanghai Composite flat). European markets are also building support on recent gains with FTSE futures and DAX Futures around flat.
In forex, there is limited real direction, but with an ongoing shade of positive risk. This is weighing on JPY and CHF. GBP continues to plough its own road with the UK election still crucial.
In commodities, there is little direction with gold and silver all but flat, whilst oil is a touch lower.
There is a big US focus on the economic calendar today. The US Trade Balance for October is at 13:30 GMT which is expected to see the deficit widening to -$71.3bn (from -$70.4bn in September). The S&P Case-Shiller House Price Index is at 1400GMT and is expected to show a slight improvement to +2.1% in September (from +2.0% in August). The Conference Board’s Consumer Confidence is at 14:00 GMT and is expected to show an improvement to 127.0 in November (up from 125.9).
The Richmond Fed Composite Index is at 15:00 GMT and is expected to slip slightly to +6 in November (down from +8 in October). Finally, there is expected to have been a +1.1% improvement in the New Home Sales to 709,000 in October (up from 701,000 in September).
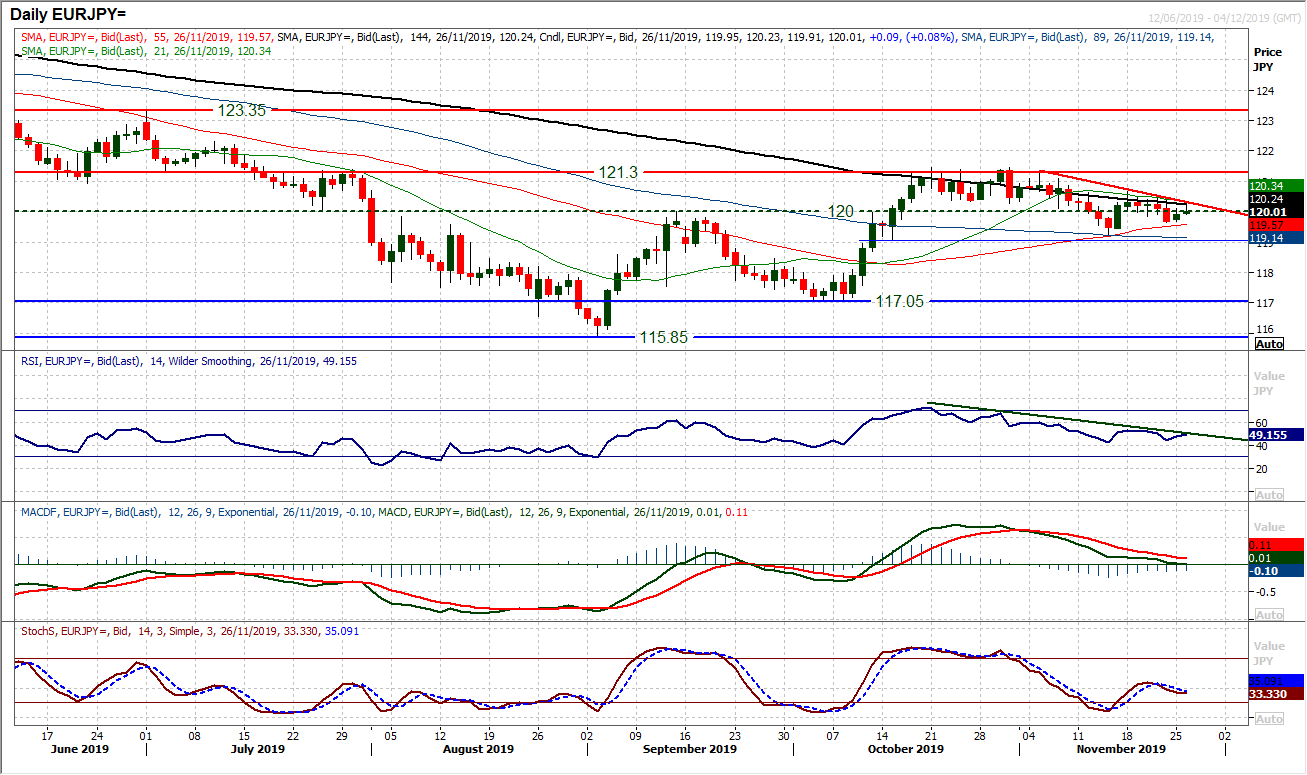
Chart of the Day – EUR/JPY
There is still a sense that the euro bulls are struggling in recent weeks. Despite the apparently improved risk sentiment through the market, even against the safe haven yen, the euro is a struggle. This comes as EUR/JPY has pulled back from the key resistance around 121.30 in November, to now form a two week downtrend. The trend is adding consistent pressure now on the support of the 120.00 pivot. How the market reacts around this pivot will be a key near term gauge, as will the falling two week downtrend (today around 120.30). Momentum indicators have been confirming the trend in recent sessions. As the RSI and MACD lines continue to deteriorate, the Stochastics recently bear crossed lower under 50. It points to a struggle for the euro bulls and near term bounces, such as yesterday’s rebound being a chance to sell. Between 120.00/120.30 is now a mini sell zone. Resistance is growing overhead with 120.55/120.70. Watch for a breach of 119.65 to open the November low at 119.25 as the next key test.
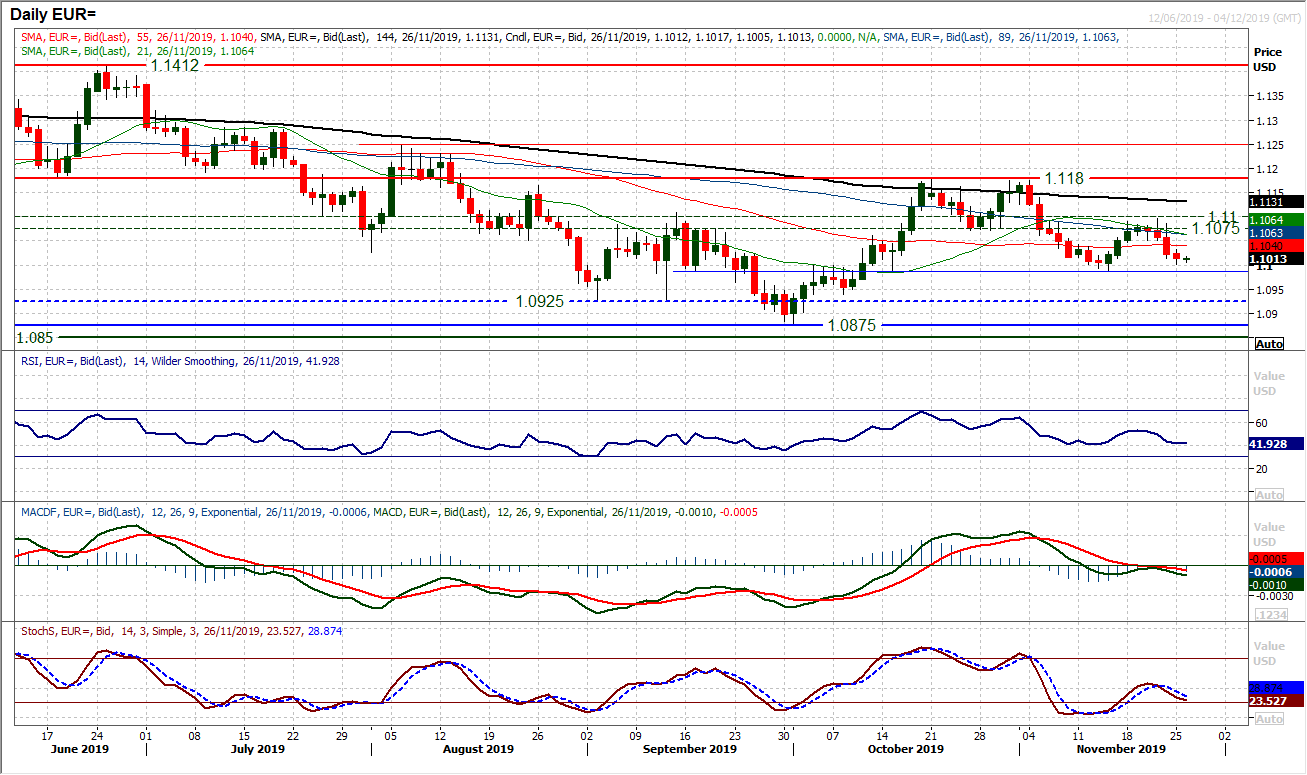
A fourth consecutive negative candlestick has the euro under growing pressure. It also now means that the key medium term pivot at $1.0990 (pivotal over the past two months) is under threat. Intraday rallies in the past three sessions have all succumbed to the bear pressure and pulled the market lower. Subsequently, this morning’s early rebound should be treated with caution. Momentum indicators reflect a negative bias with the MACD lines showing a “bear kiss” under neutral whilst Stochastics are in decline following a bear cross lower at neutral. If the RSI were to move below 40 it would be a real sign of a downside break of $1.0990. A closing breach of $1.0990 opens the old September/October lows between $1.0875/$1.0925. The hourly chart shows initial resistance at $1.1030/$1.1050.
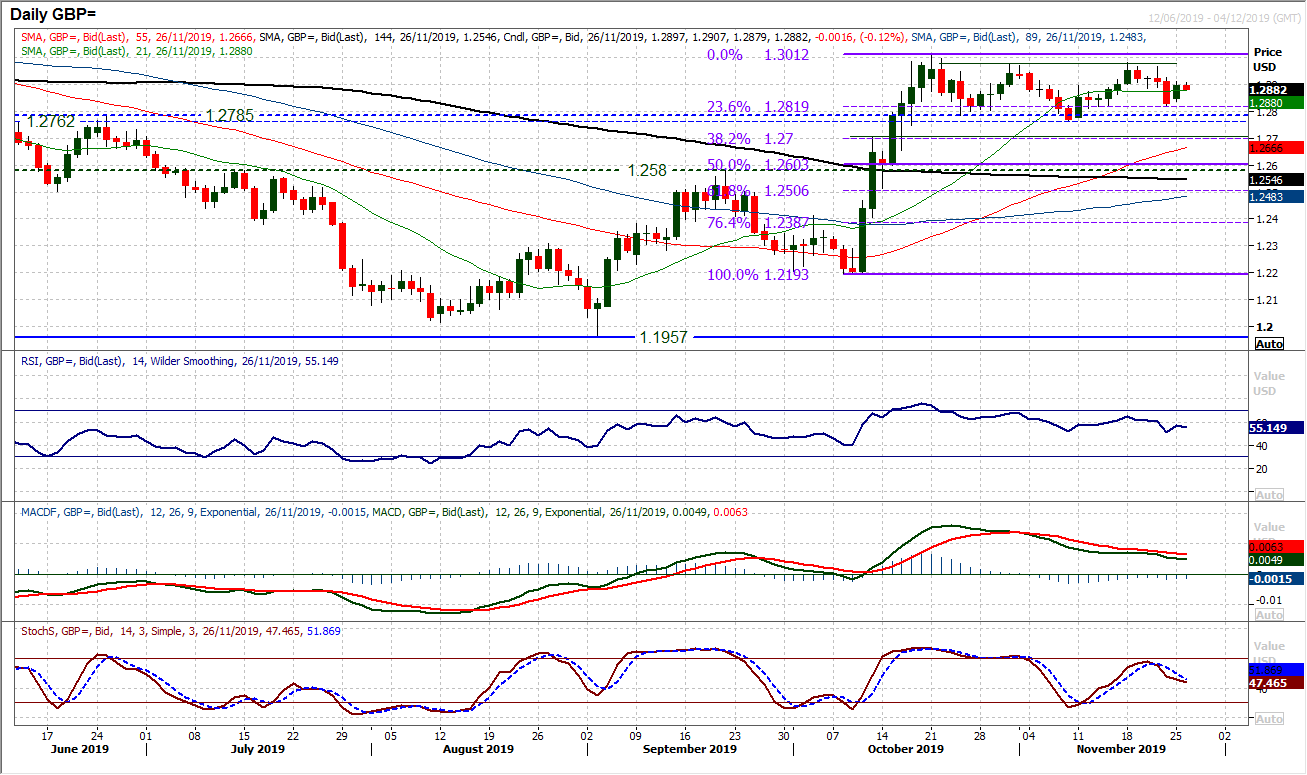
The trading range that has built up on Cable over recent weeks shows little sign of being broken. The uncertainty of the UK election will drive sterling higher and lower as polling/newsflow drives the outlook. However, we do not expect any decisive breakout in front of polling day on 12th December. Within this, the market seems to be holding between the support band at $1.2765 (old pivot and November low) and $1.2820 (the 23.6% Fibonacci retracement of the October rally). On the top side is the consistent resistance $1.2975/$1.3010. Momentum indicators are on the drift unwind from October’s huge bull run, which is indicative of a range following such a big move. We expect the consolidation range to continue. The hourly chart indicators show a ranging formation with the recent bounce into a band of resistance $1.2900/$1.2930. Initial support is at $1.2865.
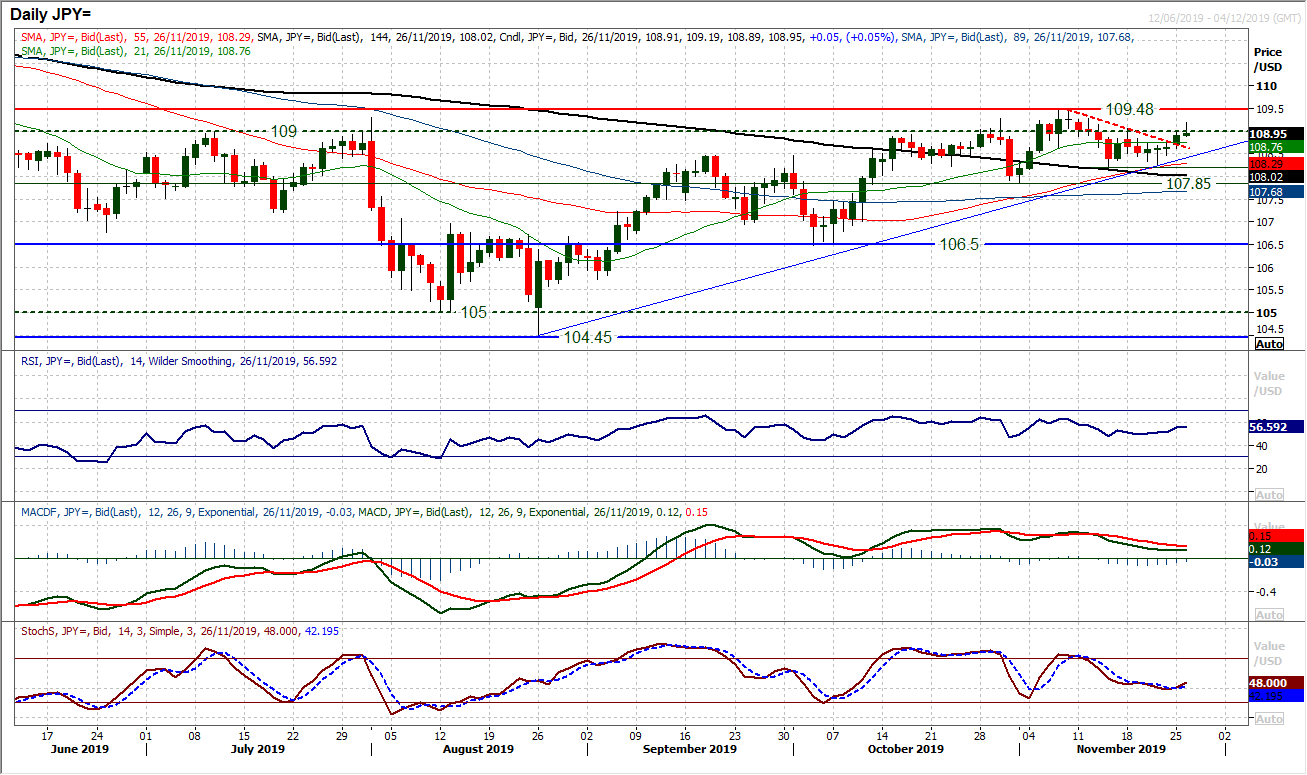
Breaking the mini two week downtrend puts the market on bull alert. The overnight continuation of a growing positive outlook has pulled the market above 109.05. if this can be achieved on a closing basis, then it would suggest that the bulls are preparing for another push on 109.50. This would be a confirmed breach of the lower high and with the market above the moving averages, the swing higher would be developing. the recent breaches of the old eleven week uptrend were unable to be the trend changing event. It means that a slight re-alignment of the old uptrend comes in around 108.40 today. Already we see Stochastics ticking higher again, whilst the RSI confirms the recent improvement. However, this all comes with a caveat, with the consistent failure of recent weeks between 109.00/109.50. Can the bulls sustain the move this time? There seems to be a decent basis across the indicators, however, Thanksgiving (on Thursday) may result in a near term stalling. The hourly chart shows initial support at 108.65/108.80.
Gold
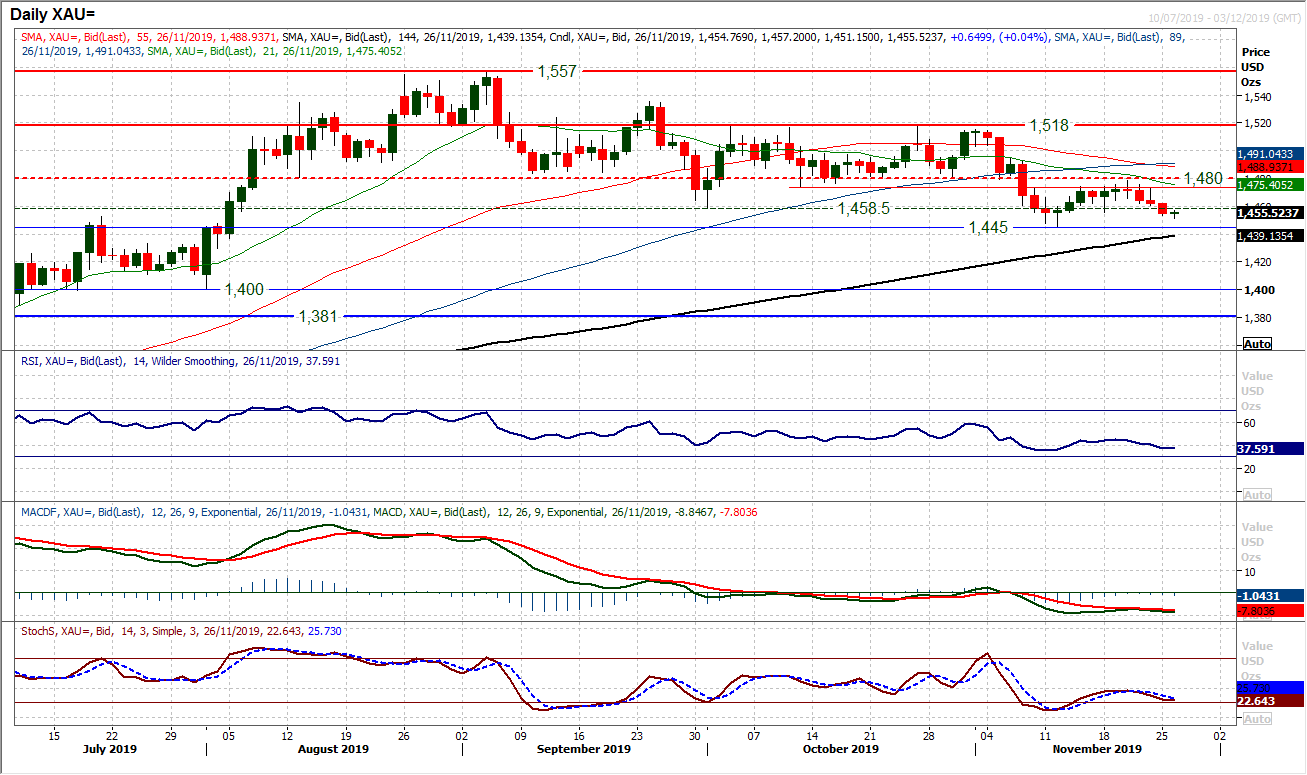
A failure of the recent rally to make any impression on the resistance band $1474/$1480 is certainly now weighing on the market. Downside pressure is growing as another negative session and bear candlestick yesterday closed below support at $1456 to re-open the November lows again around $1445. With momentum indicators all in bear sequence turning lower from under their neutral points, there is a real sense that the next break of key support could be close. RSI below 40, along with the struggles on MACD and Stochastics reflect a market ready to use rallies as a chance to sell. With the run of lower highs and lower lows in the past few months, the medium term outlook remains corrective and we see near term strength struggling. An early rebound today looks to be another opportunity. The hourly chart shows an unwinding of momentum to renew downside potential. Around 60 on hourly RSI and around neutral on hourly MACD seem to be limiting the buying momentum. A closing breach of $1445 would be the latest breakdown and would open $1430 initially but the medium term test of $1400 should not be ruled out.
WTI Oil
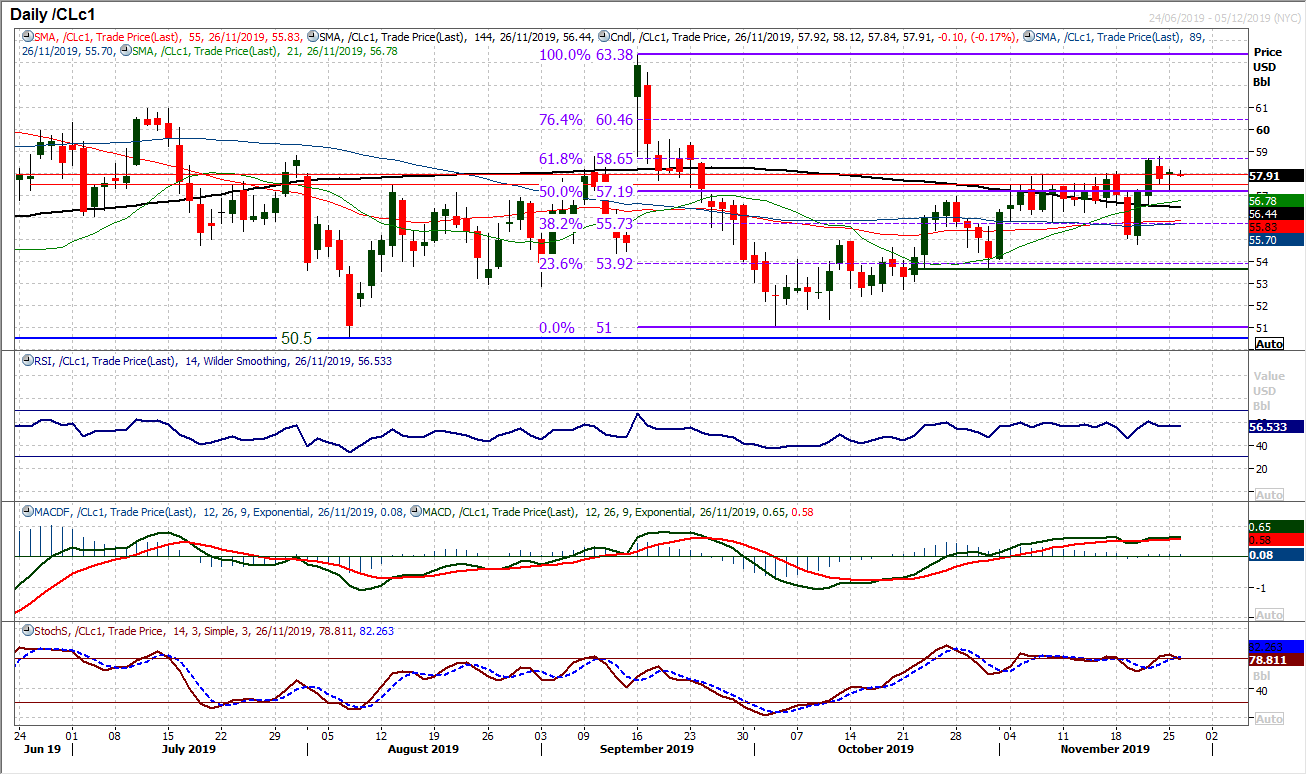
There is still a sense that a recovery is progressing on oil. Subsequently, near term weakness is seen as a chance to buy. There is a positive configuration across momentum indicators which reflects this. Although the bulls are not storming higher, there is a sequence of higher lows and higher highs to show their ascendancy. The support of the 50% Fibonacci retracement at $57.20 under the old pivot band $57.50/$57.75 all adds to support now building. We look to use near term weakness for a test of the 61.8% Fib level at $58.65 which capped the gains last week. A closing breach opens $59.40 initially, but the 76.4% Fib at $60.45 would be the next target. Support at $54.75 is now key.
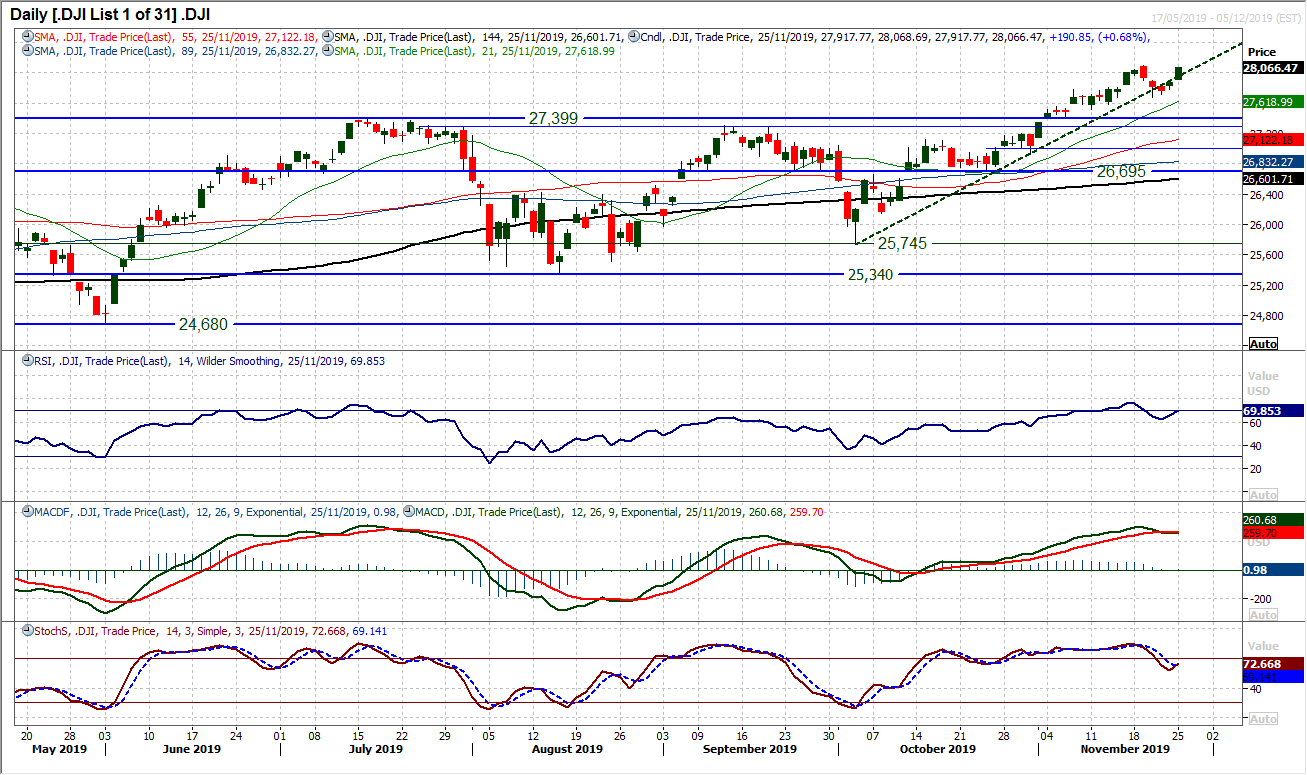
The bulls are back in the swing of it as a decisively positive bull candle posted yesterday pulls the Dow to within sniffing distance of the all-time high again. Momentum has been mildly unwinding, as opposed to any serious selling pressure and this move has helped to renew upside potential. The positive moves of the past couple of sessions now have a swing higher on Stochastics and RSI, ready for another break to all-time highs. Last week’s resistance at 28,090 is in the way now, but with strength of momentum on both daily and hourly charts, with upside potential, the bulls are ready. Support in the band 27,675/27,775 has been bolstered but the move higher, whilst the hourly chart shows initial pivot support around 27,900. Intraday weakness is a chance to buy.
"""DISCLAIMER: This report does not constitute personal investment advice, nor does it take into account the individual financial circumstances or objectives of the clients who receive it. All information and research produced by Hantec Markets is intended to be general in nature; it does not constitute a recommendation or offer for the purchase or sale of any financial instrument, nor should it be construed as such.
All of the views or suggestions within this report are those solely and exclusively of the author, and accurately reflect his personal views about any and all of the subject instruments and are presented to the best of the author’s knowledge. Any person relying on this report to undertake trading does so entirely at his/her own risk and Hantec Markets does not accept any liability. """
