Market Overview
Easing measures from the People’s Bank of China are lifting market sentiment this morning. The Chinese authorities are attempting to combat the Coronavirus which has infected over 70,000 people, killed 1770 and put hundreds of millions of people on mainland China under lockdown restriction. The PBoC has announced that it would be providing medium term financing to the tune of 200bn yuan to commercial lenders whilst also cutting its main interest rate by -10bps to 3.15%. There has been a mildly risk positive response across markets, however, with US equities and bond markets shut for Presidents’ Day, we will probably not know the true reaction until tomorrow. Into the close on Friday we were beginning to see signs that traders were ready to take on more risk once more.The VIX Index (of S&P 500 options volatility) was at its lowest in more than three weeks, whilst the bulls were threatening a positive breakout on oil. This move will need bond yields to accompany it however, for now, a yields recovery remains elusive. Bond traders seems to remain far more concerned about the negative global growth impact of the Coronavirus than equity traders. With the US on public holiday today, we will have little to resolve this dichotomy. There is also a marginal risk positive outlook today following the PBoC actions.Wall Street closed +0.2% higher at 3380, with US futures +0.3% higher (although shut today). Asian markets have been mixed overnight with the Nikkei -0.7% whilst the Shanghai Composite has reacted strongly to the PBoC and closed +2.3% higher. In Europe there is a more moderate positive reaction.In forex, there is a mixed outlook across majors today and with the US on public holiday, it is unlikely that there will be too much real direction throughout the session.In commodities, there is a mild shift out of gold today, whilst oil remains supported.The here are no key data releases on the calendar today. However, keep in mind that US markets will be shut for Presidents’ Day (both equities and bond markets will be closed). This means that volumes and liquidity will be thin and perhaps cause some erratic moves on an otherwise quiet day.
Chart of the Day – Silver
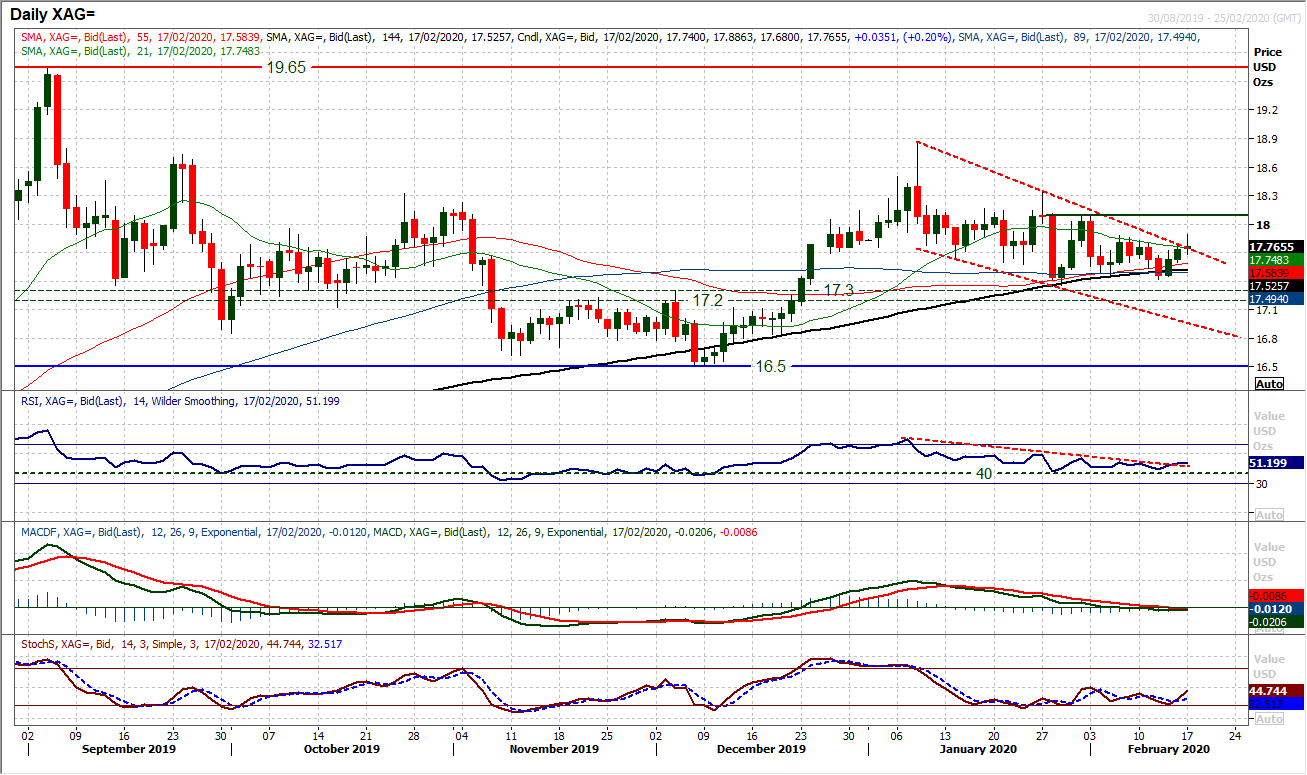
We continue to expect gold to be breaking to the upside, and although silver still has slightly more of a corrective outlook, we also see the recent consolidation on silver to be a medium term buying opportunity. The bulls are starting to flex their muscles again and this morning could signal a shift in sentiment. A corrective slide back from a multi-month high of $18.85 has been unwinding overbought momentum. This move has helped to renew upside potential and now the bulls look ready to go again. The RSI has been finding lows around 40 recently, whilst the MACD lines are back around neutral. The correction found support at $17.35 in late January, around the medium term pivot at $17.20/$17.30 and picking up from $17.42 last week, a run of positive candles is now forming. A downtrend is being broken this morning and a close clear of resistance at $17.88 would begin to complete a falling wedge breakout. This would be confirmed on bull traction above $18.09. Although this move higher has not been confirmed yet, with momentum now showing signs of life, the bulls look ready now. Initial support at $17.67 this morning.
EUR/USD
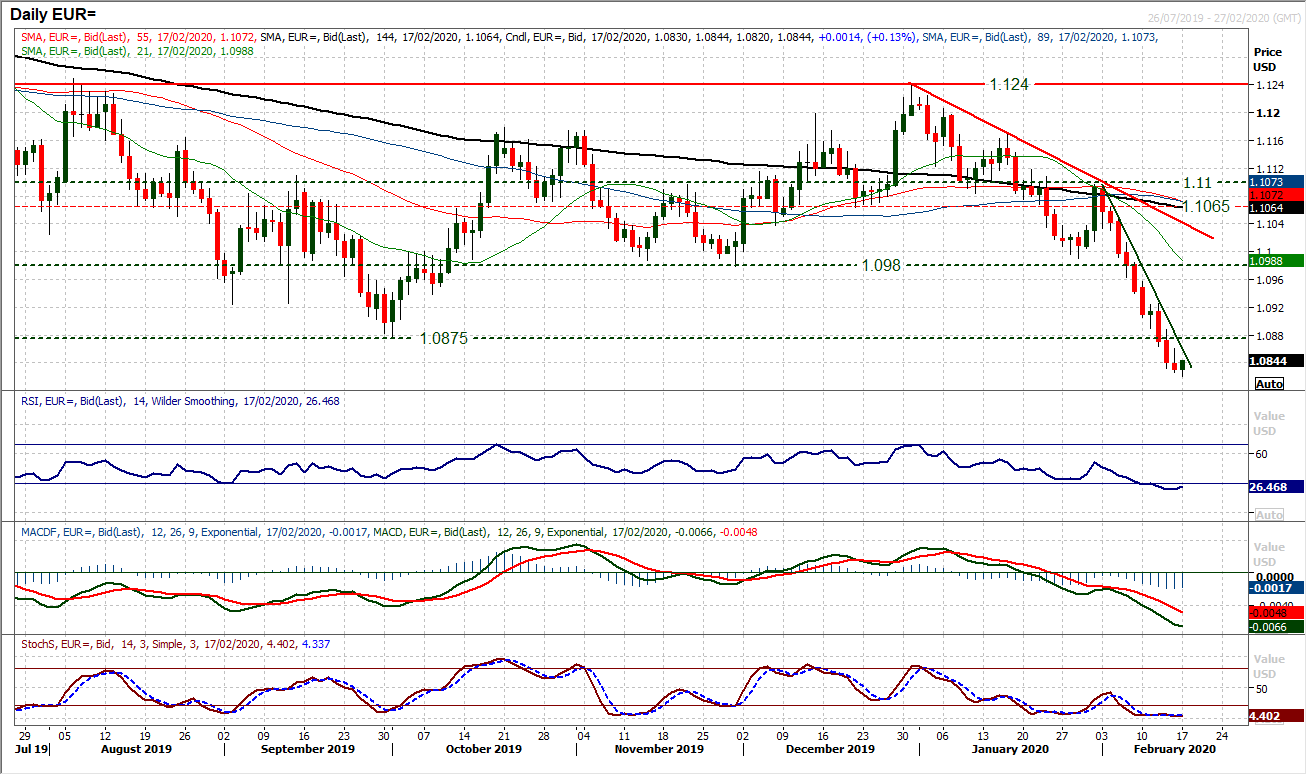
The euro remains under bearish pressure as EUR/USD continues to fall at multi-year lows. We have noted for the past few days that momentum is stretched to the downside, with RSI well below 30, a very rare position for a market as liquid as EUR/USD. This certainly raises the potential for a technical rally, however, as yet none is forthcoming. It is interesting that in every session of the past seven, the early part of the session has been filled with rally potential, only for the US traders to come in later on to sell. This is leaving a stream of bearish candles. Once more today, the market has ticked higher early today, but we remain sceptical of a recovery. There needs to be several signs to raise confidence levels. A two week downtrend comes in at $1.0860 today, which coincides with initial resistance on the hourly chart. We continue to see the euro unable to break through the pivot levels of old support. So the importance of $1.0865 is key, but for confirmation, above $1.0890 is needed. Hourly momentum has picked up slightly, but the hourly RSI needs to move into the 60s and MACD into positive for confirmation of potential recovery building. Initial support is $1.0820 from the overnight low, but any continued downside opens minor support from 2017 at $1.0775 and then $1.0560.
GBP/USD
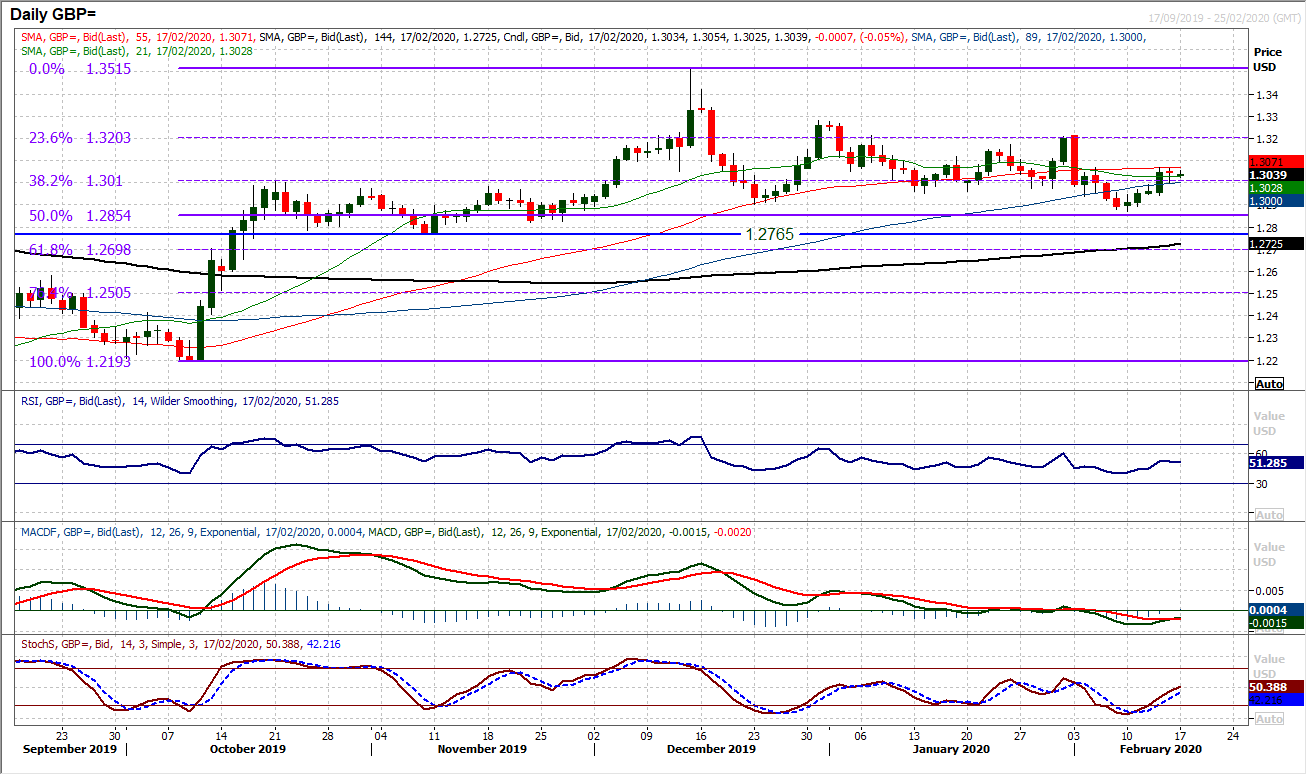
The near term sterling rally has just started to consolidate once more as a doji candlestick formed on Friday and the market has begun this week rather muted. The US public holiday today may mean that this consolidation continues for the early part of this week. The outlook for Cable has neutralised once more. The recovery from $1.2870 helped to bolster what we see as an ongoing range outlook. Although the December support around $1.2900 was breached there is little follow through and there is an ongoing appetite to support sterling. Cable momentum indicators reflect a medium term range, with RSI now all but having been between 40/60 since the beginning of the year. This suggests a lack of sustainable traction in either direction where runs of three or four days in any one direction seems to be the limit. Initial resistance now at $1.3070 which is preventing a move towards $1.3200 again. Initial support at $1.3000, whilst $1.2940/$1.2960 is more considerable near term support.
USD/JPY
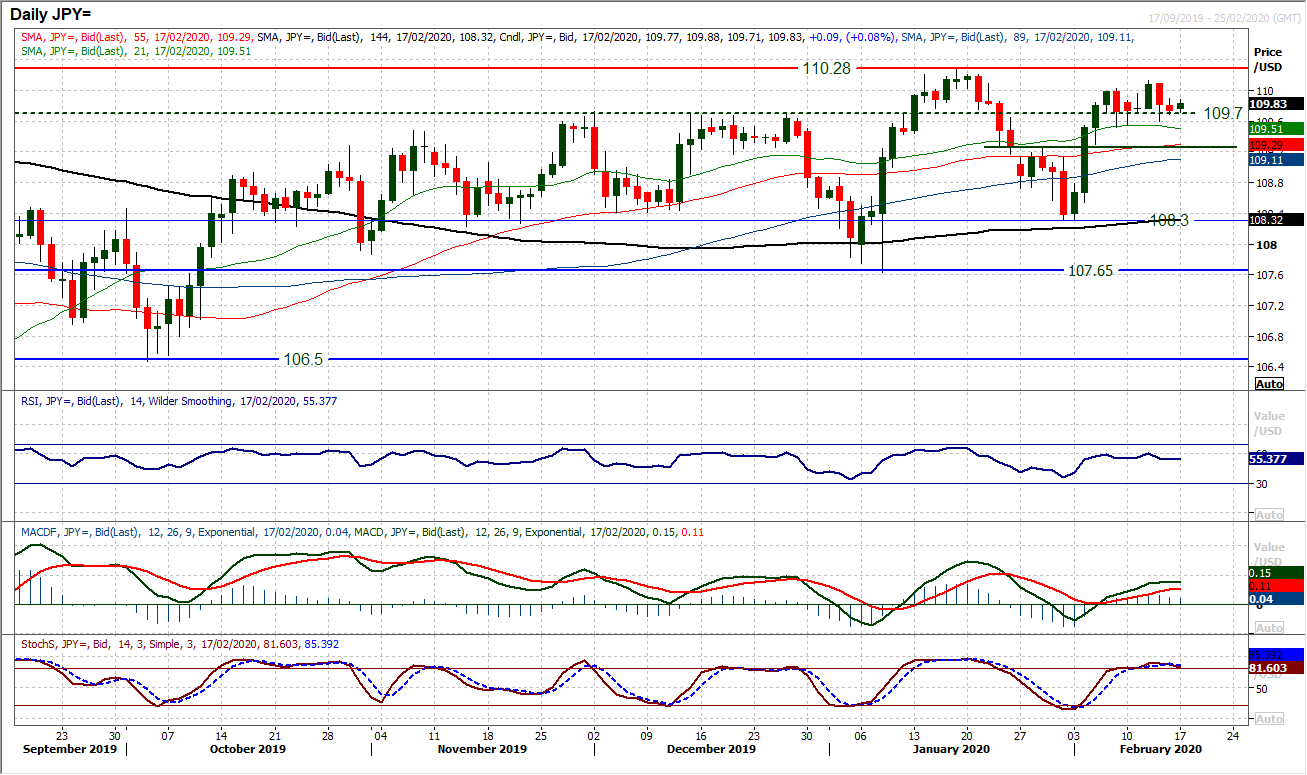
Another small bodied candlestick ended a week of consolidation on Dollar/Yen last week as the fluctuations of uncertainty around how to play the Coronavirus just pulled the reins on the bull run. The consolidation is still based around 109.70 which is an old breakout, where near term support has been building at 109.50/109.70. Although there is a mildly positive bias to momentum indicators (RSI above 50, MACD line rising above neutral, Stochastics above 80) the has been a weighting of negative candles in the past six sessions that is starting to drag slightly on sentiment. Despite this, whilst support between 109.50/109.70 holds, we remain positive on a near to medium term basis. This outlook would change on a close below the 109.25 pivot. Resistance is still in place around 110.0/110.15 and is preventing a look at 110.30 which we still see as likely in due course. With the US on public holiday, it could be a quiet session today.
Gold
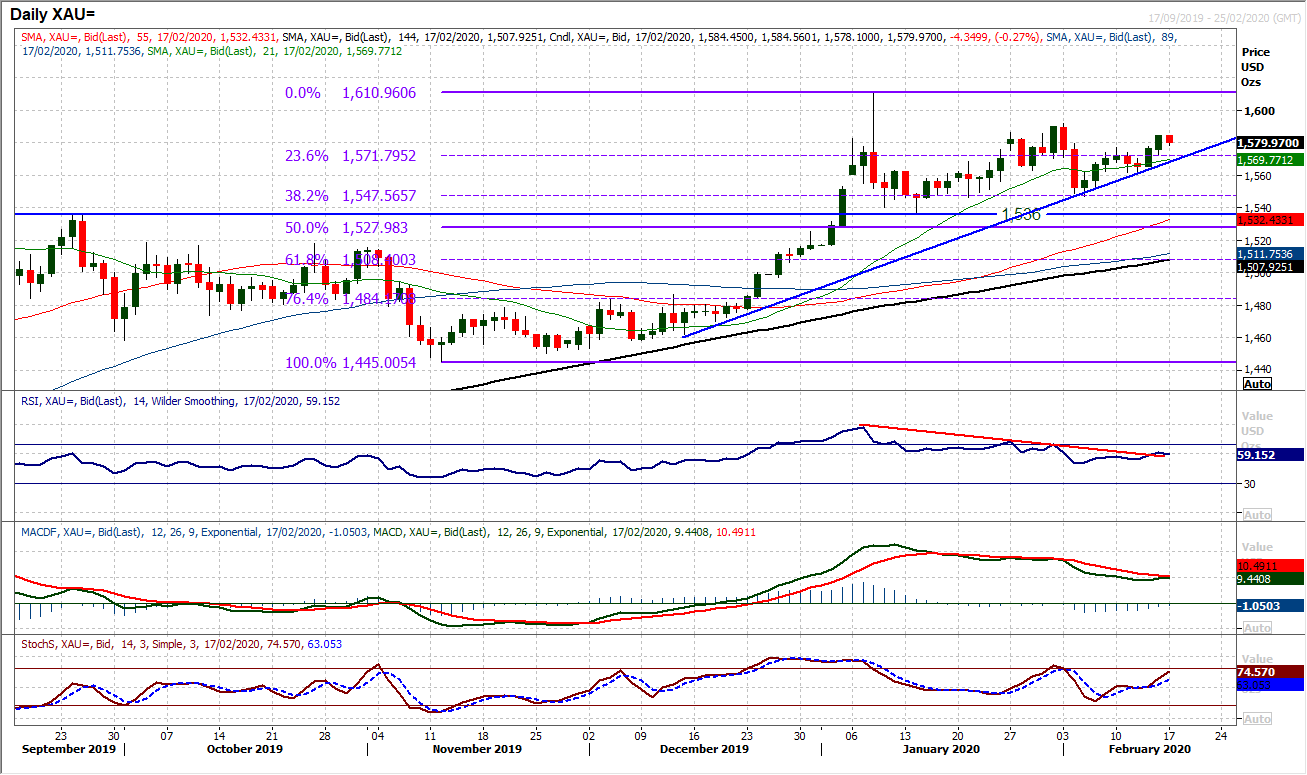
The gold bulls have been straining to break higher in the past week. The fact that this has come as the US dollar has been a strong performer across the major currencies, should give the bulls some confidence coming into this week. Friday’s second successive positive candle pulled the market clear of resistance at $1578 and is now beginning to build some traction. Supported by the support of a nine week uptrend (today at $1568) the bulls are beginning to strengthen. We have been reticent to call a breakout during this phase of consolidation and after the market fell sharply a couple of weeks ago. However, the bulls now look more settled and primed for a test of $1591 which can be considered a key resistance now. There is a basis of support between $1568/$1577 which is a combination of uptrend (at $1568), 23.6% Fib (of $1445/$1611 at $1572) and breakout (at $1577). The importance of the reaction low at $1562 is also growing. Above $1591 opens $1611.
WTI Oil
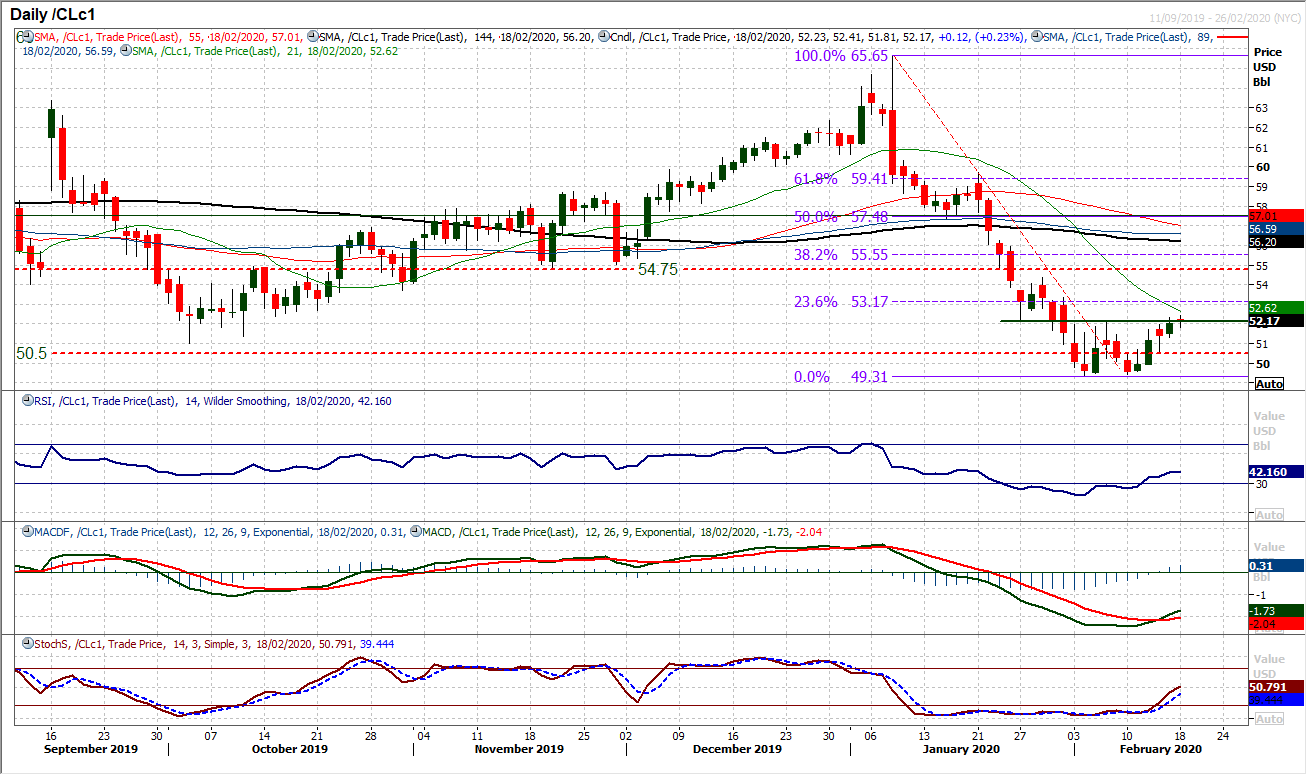
WTI is on the brink of a key shift in outlook. For more than five weeks, it has been a real struggle for the bulls. Intraday rallies have been consistently sold into and sentiment has been negative surrounding the Coronavirus. However, in the past week there has been a more positive positioning. Intraday strength has been holding to form a run of positive candles. Weakness is now being bought into. The market is now testing the key pivot resistance around $52.15 which is also a neckline of a near term recovery base pattern. A decisive closing breach would imply around $3 of recovery and put the market in for a test of the $54.75/$55.00 key medium term resistance area. The hourly chart looks to have a far more positive configuration now, with hourly RSI consistently above 40 (signals a more bullish sentiment) and MACD lines above neutral. A key higher low at $50.60 needs to hold for the recovery to remain in play, whilst initial support is at $51.30/$51.60.
Dow Jones Industrial Average
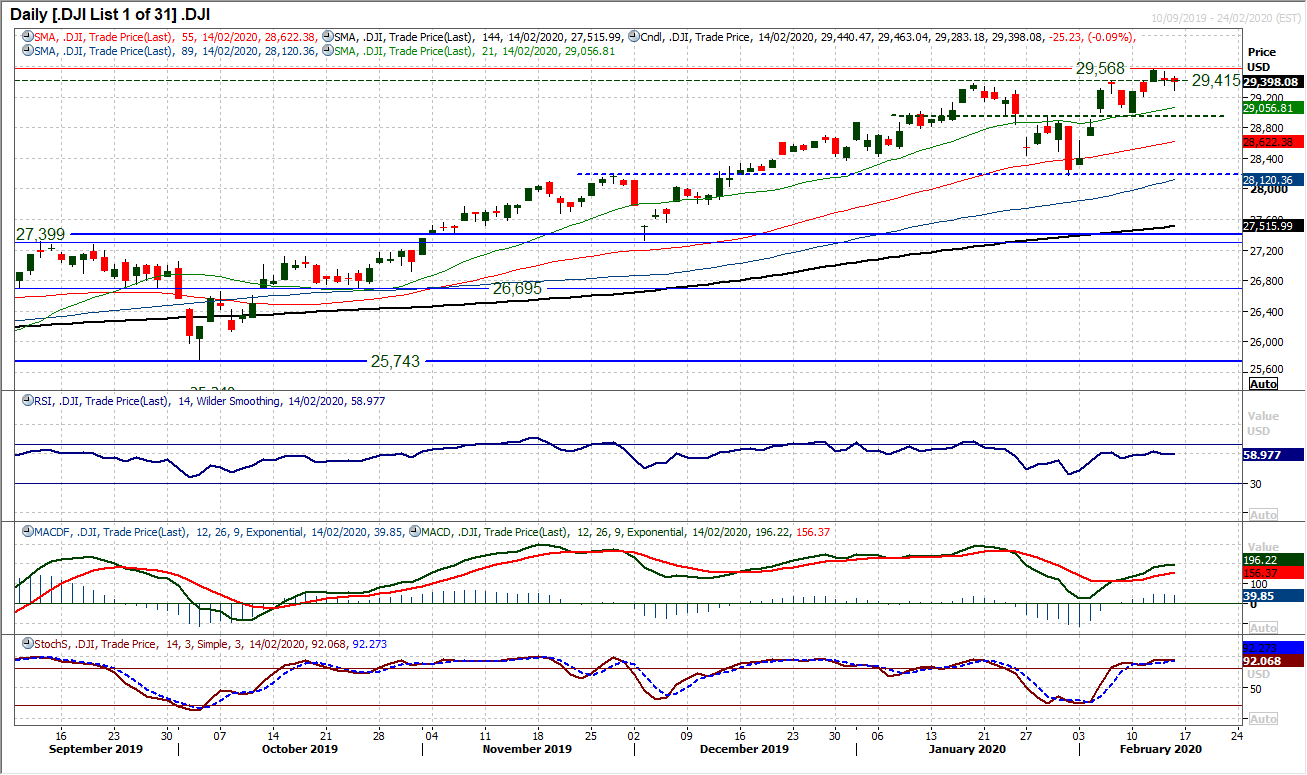
With the technical outlook remaining positive, a near term slip back on the Dow should be the source of another chance to buy. The pivot at 28,950/29,000 is the first real band of support that would be of significance if it were to be breached. The last two daily candlesticks which have been very small-bodied and with little real corrective momentum, have been trading around the old 29,374/29,415 breakouts which already the bulls seem to be viewing as a limit to a correction. Momentum indicators remain positively configured and suggest weakness is still a chance to buy. MACD lines rising, whilst Stochastics remain strong above 80. There is also upside potential on RSI around 60. We favour a retest of the 29,568 all time high and further moves on towards 30,000 in due course. Friday’s low at 29,283 is initially supportive but a closing breach of 28,950 would require a more considerable shift in outlook. The market is shut for Presidents’ Day public holiday today.
"""DISCLAIMER: This report does not constitute personal investment advice, nor does it take into account the individual financial circumstances or objectives of the clients who receive it. All information and research produced by Hantec Markets is intended to be general in nature; it does not constitute a recommendation or offer for the purchase or sale of any financial instrument, nor should it be construed as such.
All of the views or suggestions within this report are those solely and exclusively of the author, and accurately reflect his personal views about any and all of the subject instruments and are presented to the best of the author’s knowledge. Any person relying on this report to undertake trading does so entirely at his/her own risk and Hantec Markets does not accept any liability. """
