Get 40% Off
⚠ Earnings Alert! Which stocks are poised to surge?
See the stocks on our ProPicks radar. These strategies gained 19.7% year-to-date.
Unlock full list

Palladium Suffers 122 Point Drop In 2 Days

Published 12/11/2019, 14:00
Updated 02/12/2019, 15:00

After witnessing a rally of 31% since the low in August 2019 to the high in October 2019 price has merely become exhausted which has seen it suffer a huge decline.

What does this mean for price?

Is this the end of the palladium rally or will palladium continue to triumph?

Newbie traders viewing this decline would likely be running for cover especially if they have seen the 2-day 122 point drop on a lower timeframe. This move will appear much larger on the lower timeframe such as the 5-minute timeframe.

For this reason, we always want to view charts on the monthly, weekly and daily timeframes to get the bigger picture.

What we can clearly see from the daily chart below is a cup and handle pattern which lasted from March 21st 2019 to September 19th 2019.
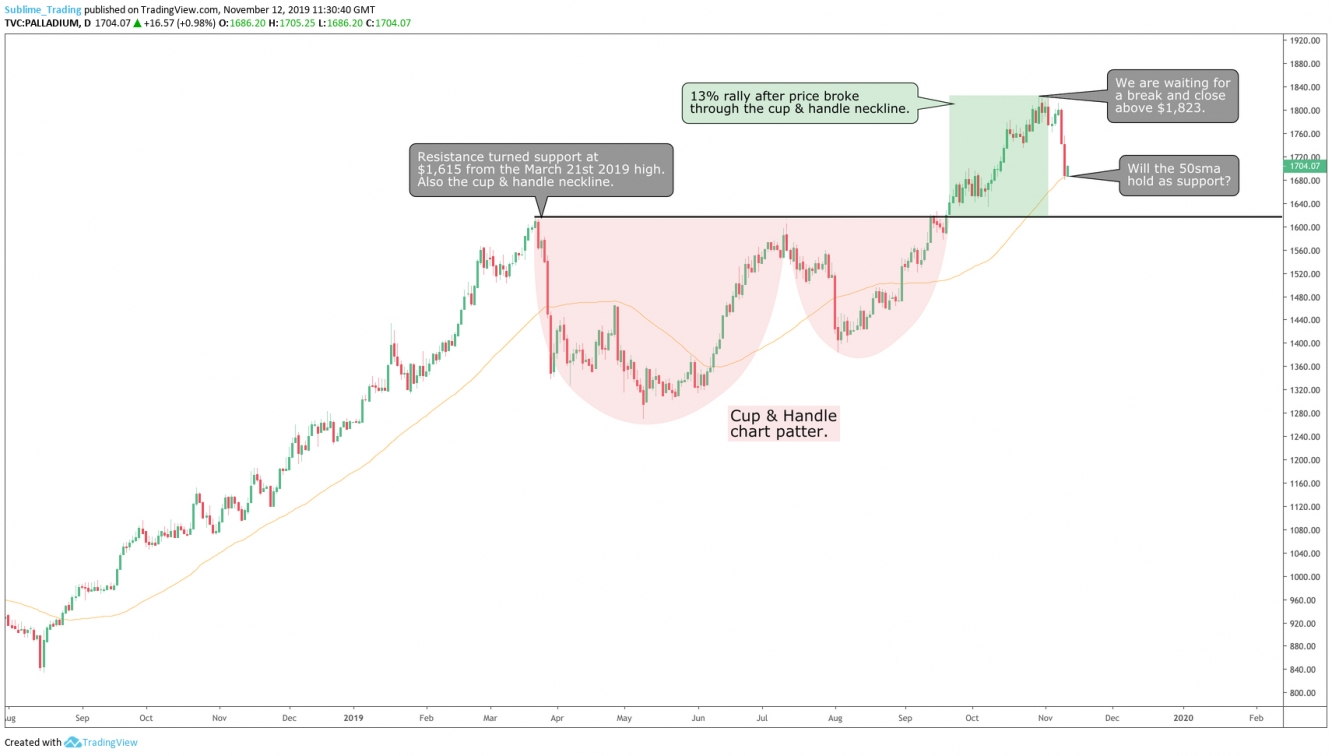
Palladium Daily Timeframe

A cup and handle in an uptrend is a strong trend continuation pattern. The pattern was only confirmed once price broke and closed above the neckline and since then we have seen a 13% move to the upside.

The rally has been interrupted with a sharp reversal for 2 consecutive days, dropping 122 points in that period and finding support at the 50sma. If this support does not hold price up then we have the major support from the cup and handle neckline at $1,615 to cushion the fall.

As the overall trend is bullish, the odds for a continuation to the upside is more likely. We still need to wait for confirmation of this, as price can sometimes surprise us and behave completely differently.

Waiting for a break and close above the current high at $1,823 will confirm further bullish moves and then we can compound on our current positions.

See more articles here.

Keep it simple, keep it Sublime!

Latest comments

Risk Disclosure: Trading in financial instruments and/or cryptocurrencies involves high risks including the risk of losing some, or all, of your investment amount, and may not be suitable for all investors. Prices of cryptocurrencies are extremely volatile and may be affected by external factors such as financial, regulatory or political events. Trading on margin increases the financial risks.
Before deciding to trade in financial instrument or cryptocurrencies you should be fully informed of the risks and costs associated with trading the financial markets, carefully consider your investment objectives, level of experience, and risk appetite, and seek professional advice where needed.
Fusion Media would like to remind you that the data contained in this website is not necessarily real-time nor accurate. The data and prices on the website are not necessarily provided by any market or exchange, but may be provided by market makers, and so prices may not be accurate and may differ from the actual price at any given market, meaning prices are indicative and not appropriate for trading purposes. Fusion Media and any provider of the data contained in this website will not accept liability for any loss or damage as a result of your trading, or your reliance on the information contained within this website.
It is prohibited to use, store, reproduce, display, modify, transmit or distribute the data contained in this website without the explicit prior written permission of Fusion Media and/or the data provider. All intellectual property rights are reserved by the providers and/or the exchange providing the data contained in this website.
Fusion Media may be compensated by the advertisers that appear on the website, based on your interaction with the advertisements or advertisers.
© 2007-2024 - Fusion Media Limited. All Rights Reserved.