Market Overview
For two countries about to engage in top level trade negotiations, the atmosphere between the US and China seems to be increasingly toxic. A series of antagonistic moves are being made which surely leaves a significant cloud over the talks, even before they have begun. The US has placed 28 Chinese companies and organisations on its banned “Entity List”, whilst also placing visa bans on several Chinese officials.
Apparently, the Chinese trade delegation is already planning on cutting short its visit by one day, whilst vice Premier Liu He has not been given the “special envoy” status by President Xi, meaning that no real decisions can be made in the talks. It seems that the trade negotiations will struggle to achieve any sort of progress that the global economy needs to prevent the further escalation into all out trade war between the two economic powerhouses.
Subsequently, we see risk appetite under renewed pressure. This is impacting across markets with Treasury yields falling back, the yen strengthening, gold is also ticking higher, whilst on the flip-side we see equities are struggling. Add in the background noise of potential impeachment for President Trump and Brexit seemingly careering towards a “no deal” conclusion, it is a difficult to be sitting in bullish sentiment positioning right now.
One chink of light, is the dovish outlook of Fed chair Powell, who has been talking about further rate cuts and Fed bond purchases (QE, but by another name?) to improve overnight liquidity issues. Could that be enough to boost sentiment? That aside, it is still safety first, and that seems to include the dollar too.
Wall Street closed sharply back lower with the S&P 500 -1.4% at 2893. However, with US futures +0.3% this morning, there is a slightly less negative view on Asian markets than could have been seen (Nikkei -0.6%). European markets are cautiously positive, with FTSE futures +0.1% and DAX futures +0.1%. In forex there is a mixed outlook for USD this morning, whilst GBP remains under pressure from Brexit fears.
In commodities, gold is again trading on the bid, whilst the deterioration in the expectation on the US/China talks is weighing on oil again.
It is a quiet day on the economic calendar but the Fed minutes will be key. The US JOLTS jobs openings at 1500BST will be the first release of any note, with consensus expected to slip slightly to 7.191m in August (from 7.217m in July). The EIA oil inventories at 15:30 BST will be key for oil, with another crude oil inventory build of +2.6m barrels expected (+3.1m barrels last week), whilst distillates are expected to drawdown by -2.2m barrels (-2.4m last week) and gasoline stocks expected to drawdown by -0.3m barrels (-0.2m last week).
The FOMC minutes for the September meeting are at 19:00 BST and focus will be on just how the committee is split on further rate cuts and what could drive them to cut again.
However, it is another day that we need to keep an eye out for Fed speakers. Once more, Fed chair Jerome Powell is speaking, at an event hosted by the Kansas City Fed at 16:00 BST, although the significance of this may be reduced considering he spoke just yesterday. However, it will be interesting to hear the views of the FOMC dissenter, Esther George (voter, hawk) who is speaking at the same event in Kansas at 1600BST. Has George shifted her stance given the recent data?
Chart of the Day – EUR/GBP
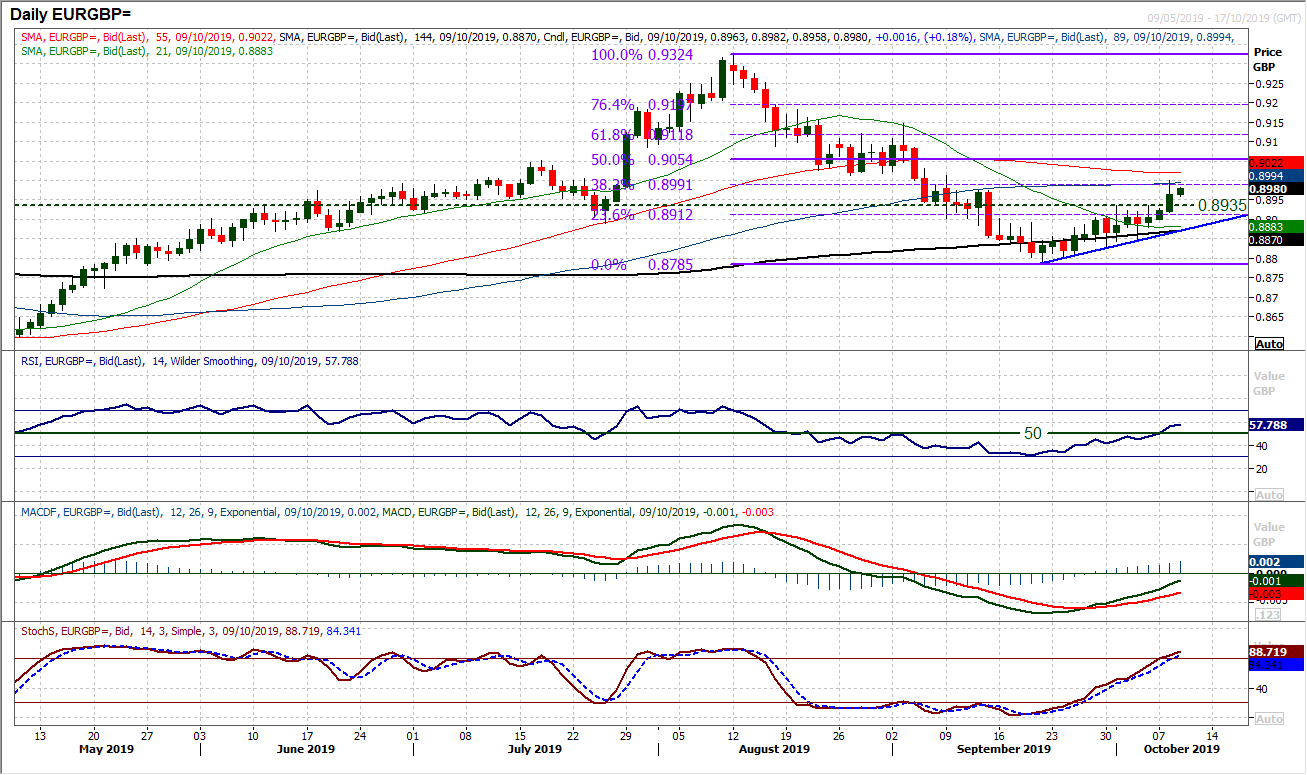
As the politics towards the 31st October Brexit deadline begin to become clearer, we are expecting elevated volatility on sterling. The selling pressure ramped up yesterday and EUR/GBP leapt higher. A recovery was already building but momentum of this move accelerated yesterday with a strong bull candle. This took the market clear of initial resistance at £0.8935, but also intraday pressure above the first real lower high at £0.8975. Although it could not hold the move into the close, further gains early today are continuing the move which signals a change in trend. The manner of the recovery on momentum indicators now points towards a market in decisive recovery, with RSI above 50 at seven week highs, whilst Stochastics move into bullish configuration and MACD lines advance strongly. Intraday weakness is a chance to buy now, with £0.8935 a basis of support. The 38.2% Fib retracement of £0.9324/£0.8785 was a basis of resistance yesterday (at £0.8990) but a move clear of £0.9000 would certainly add further momentum to the rally now. Yesterday’s move seemed to be outlook defining and opens the upside once more. A close above £0.9000 would open £0.9120/£0.9150.
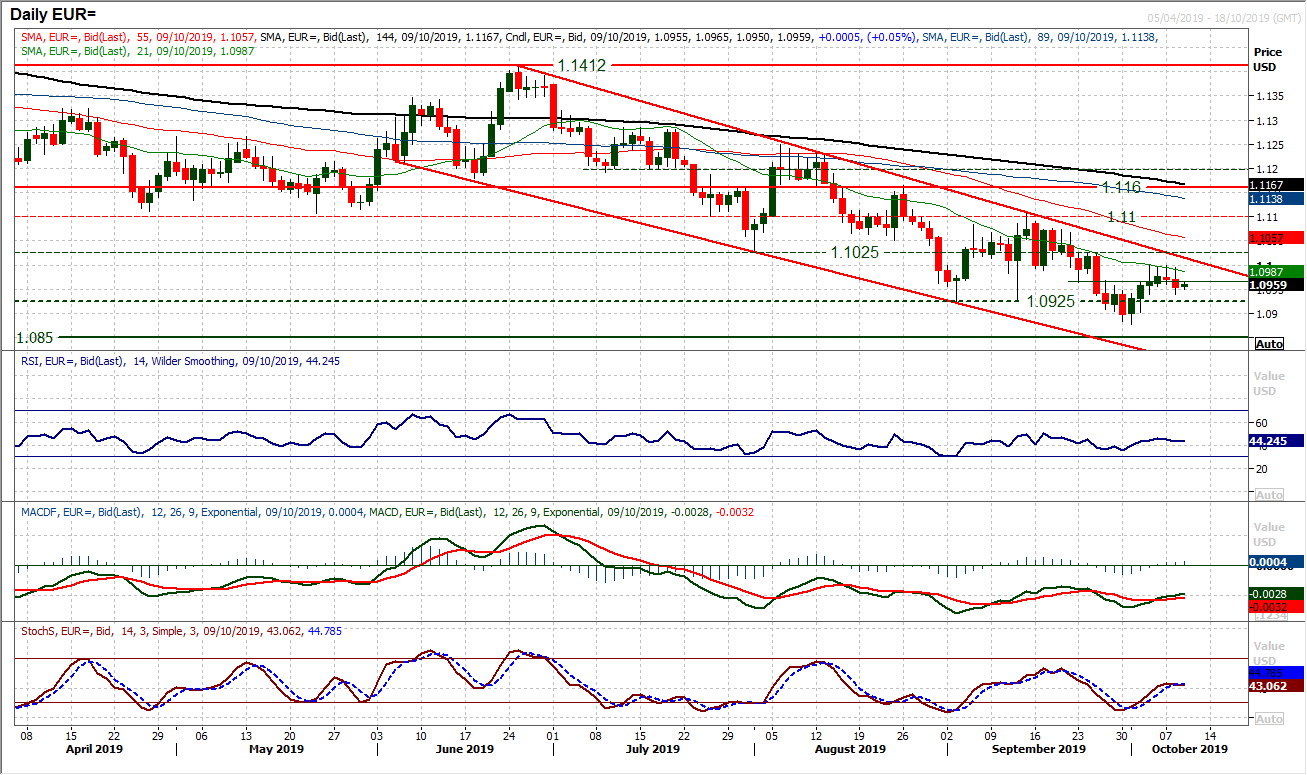
The euro was indecisive for much of yesterday’s session, but the way EUR/USD just started to roll over would suggest that the dwindling hopes of progress in the US/China trade talks will be a drag on the market. A second close lower and negative candle is beginning to weigh on the market. Interestingly, this is coming again where the 21 day moving average (currently c. $1.0985) is a basis of resistance. The downtrend channel is falling at $1.1015 today (between the $1.1000/$1.1025 resistance band) meaning the barriers to gains on EUR/USD are quite considerable now. The risk certainly seems to be growing to the downside once more. Momentum indicators are rolling over around similar levels as previous bear rallies have failed too. However, this is still a market lacking conviction, as the euro has ticked slightly higher into the European session. However, the hourly chart shows $1.0965 is a near term pivot resistance basis now and hourly momentum has shifted into a more corrective configuration. Initial support at $1.0940 but below $1.0925 opens the $1.0875 recent low.
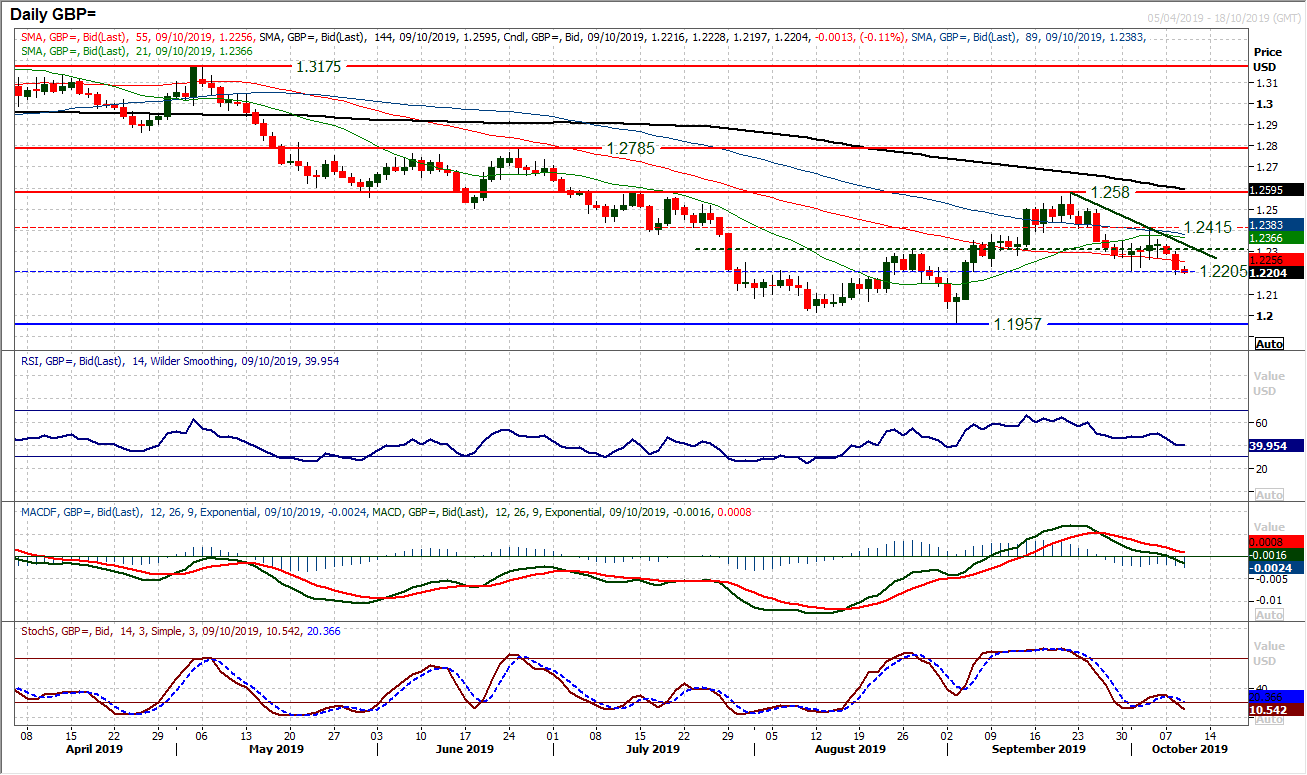
As the politics of Brexit become ever more acrimonious (if that was possible) sterling is finding the selling pressure ramping up once more. Technically, the trend lower on Cable and latterly accelerating negative candlesticks are weighing on the outlook. The tentative support of last week’s low at $1.2205 was breached intraday yesterday and continues to be tested this morning, but effectively a close under $1.2200 would confirm a downside break and open $1.2000 area again. The key September low was at $1.1957. Momentum is now beginning to lead the market lower, with the RSI at multi-week lows, as Stochastics bear cross lower and MACD lines on the brink of falling below neutral. A three week downtrend is at $1.2335 today but intraday rallies will struggle and look to be a chance to sell now. This is backed on the hourly chart where initial resistance comes in at $1.2270.
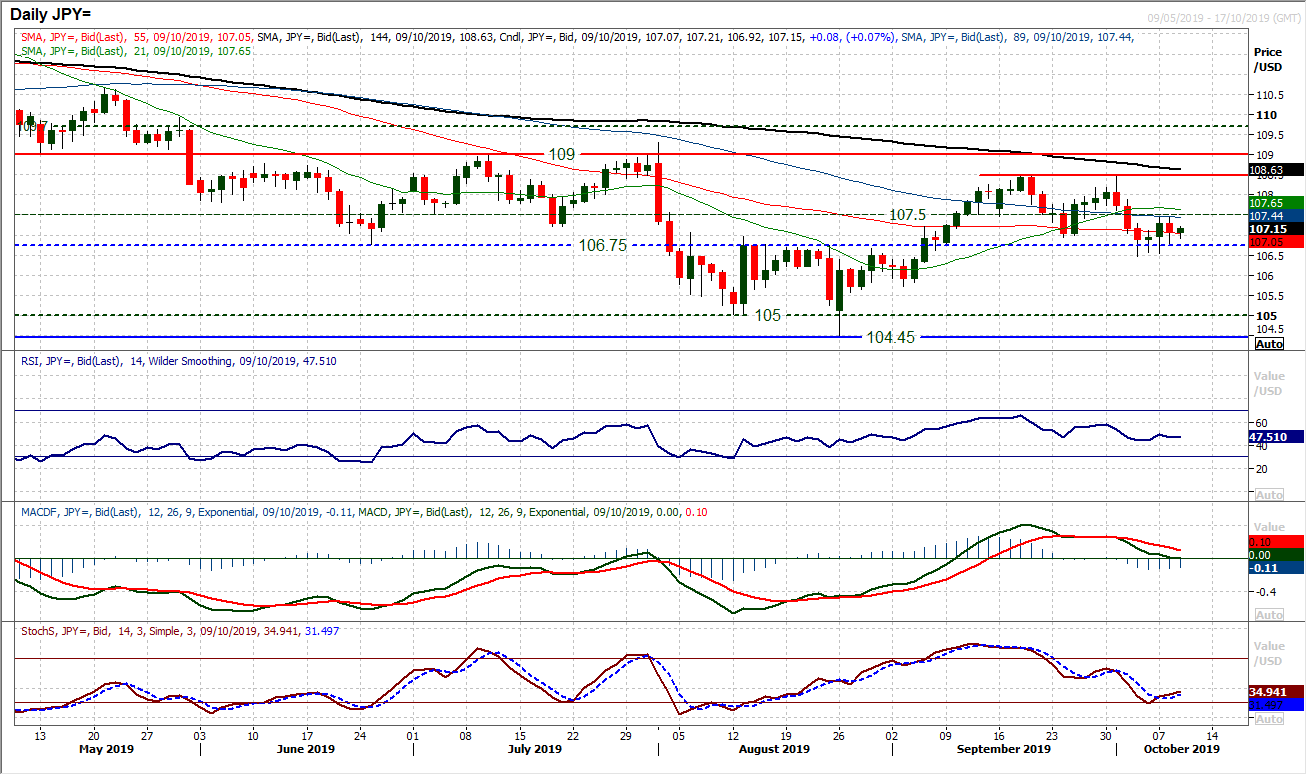
Another market increasingly lacking conviction is Dollar/Yen. The negative momentum of the sell-off last week has dissipated and the market is seemingly set on finding support in the band 106.50/106.75. However, Monday’s pick up was neutralised by a contradictory candle yesterday as the safe haven yen gained ground again. This leaves the market stuck between the support band 106.50/106.75 and effectively mid-range resistance at 107.50. Momentum is settling around a more neutral configuration, with the RSI and MACD lines flattening around their neutral points. With the hourly chart moving averages all converging and momentum around neutral, this looks to be a market waiting for a catalyst. The US/China talks seem to be the key here.
Gold
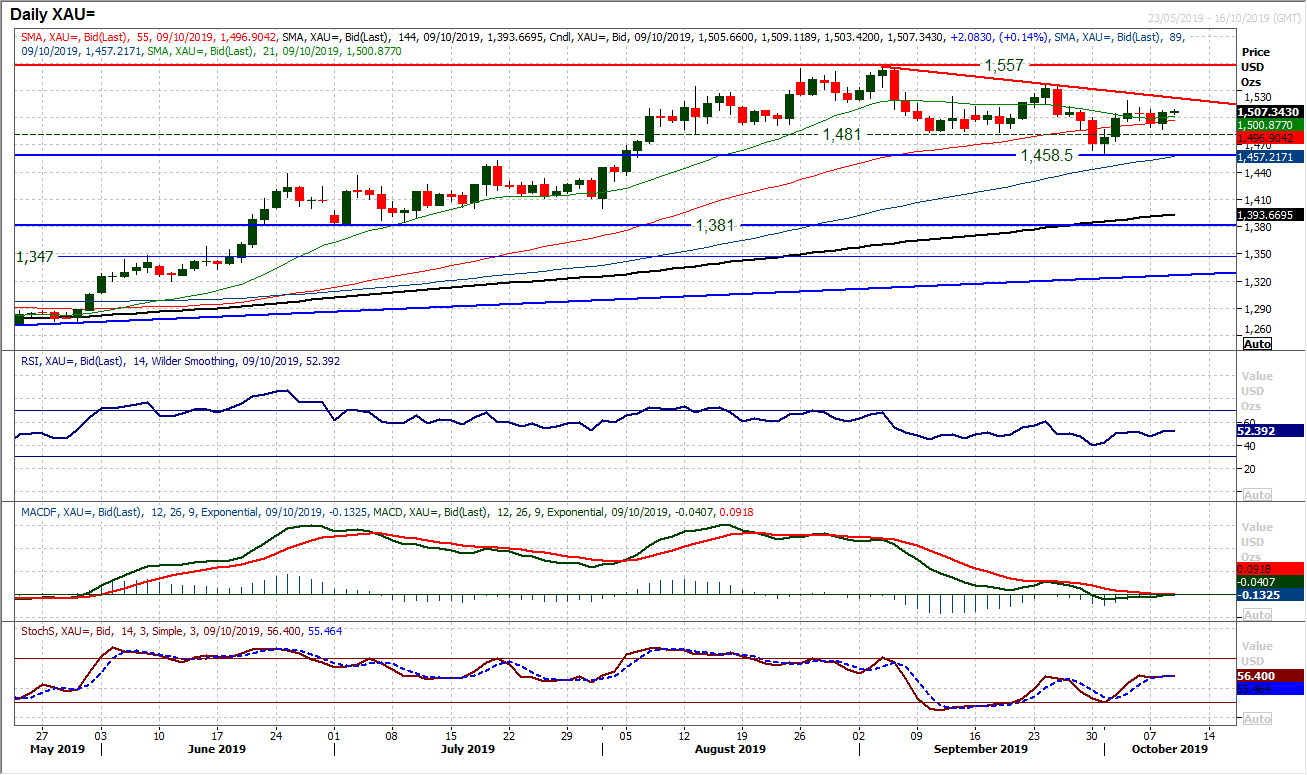
Since the strong recovery of last week, the market has spent the past few sessions throwing off a range of mixed technical signals. Taking a step back though, and the momentum indicators on gold are almost entirely neutral. RSI around 50, MACD lines flat and bang on neutral and Stochastics flat around 50. We have been noting that during the trend higher of the summer, the 21 day moving average had been an excellent basis of support, but it is interesting that in the past month, gold has traded around $1500 on 16 of the 22 sessions. Basically the price has gone all but nowhere and the outlook has become increasingly neutral. It is likely that in the wake of the US/China negotiations there will be more direction though. With the Average True Range of $22 the daily moves are still relatively volatile, but just lacking sustained direction. The hourly chart is talking support at a pivot of $1487, with resistance under $1510 and the recent rebound high of $1518.50. Given the market trading above all moving averages, we are still inclined to positive of gold into weakness, but for now the market seems to be stuck waiting for a catalyst.
WTI Oil
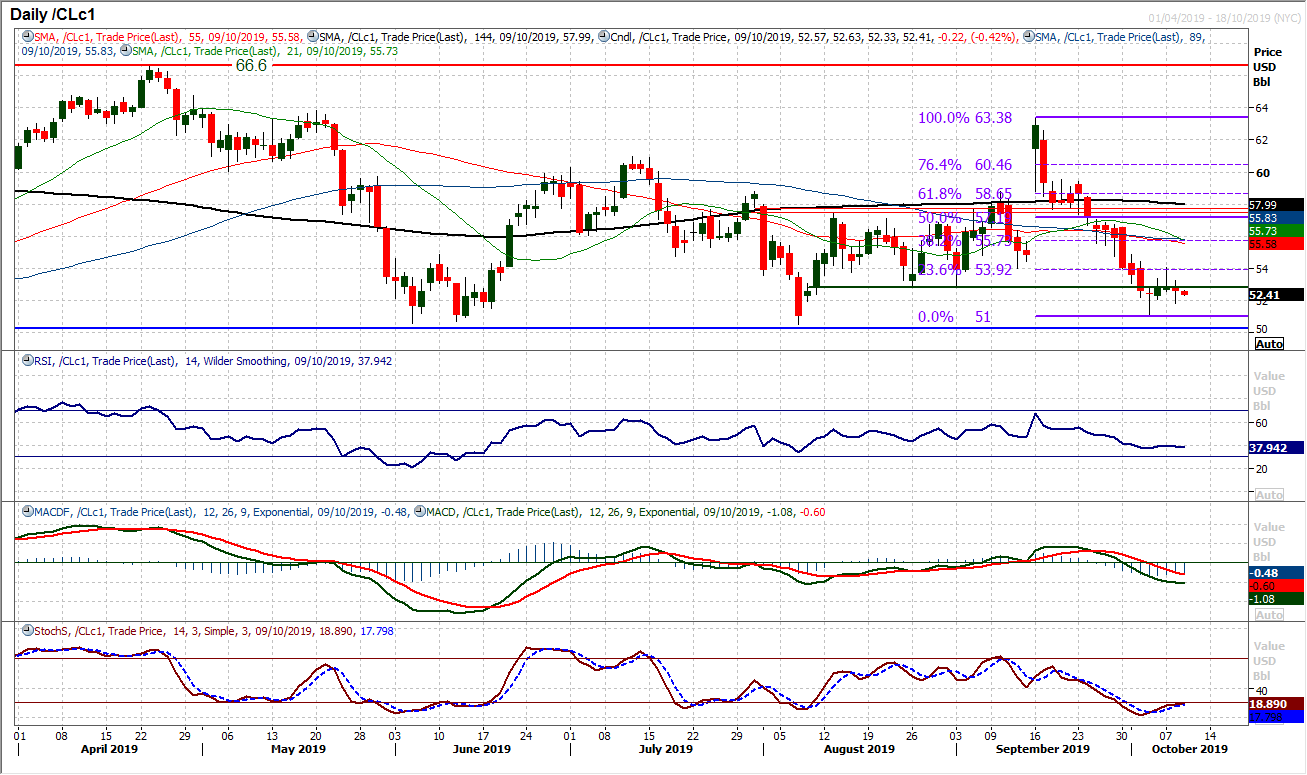
We had been seeing a move constructive bull position forming in recent sessions, however, this seems to be dissipating again. The crux seems to be a failure to close above the resistance around $52.85. This has been a growing theme of recent sessions, but today the bulls seem to be backing away again. There is a stalling of previously improving momentum and the hourly chart shows the market beginning to fail at lower levels again. Initial support at $51.80 today is from yesterday’s low and a breach would re-open the lows again, with the key support $51.00 and down at $50.50. If the bulls can muster a decisive close above $52.85 it would help to improve the outlook but more considerable tests lie above at $54.00.
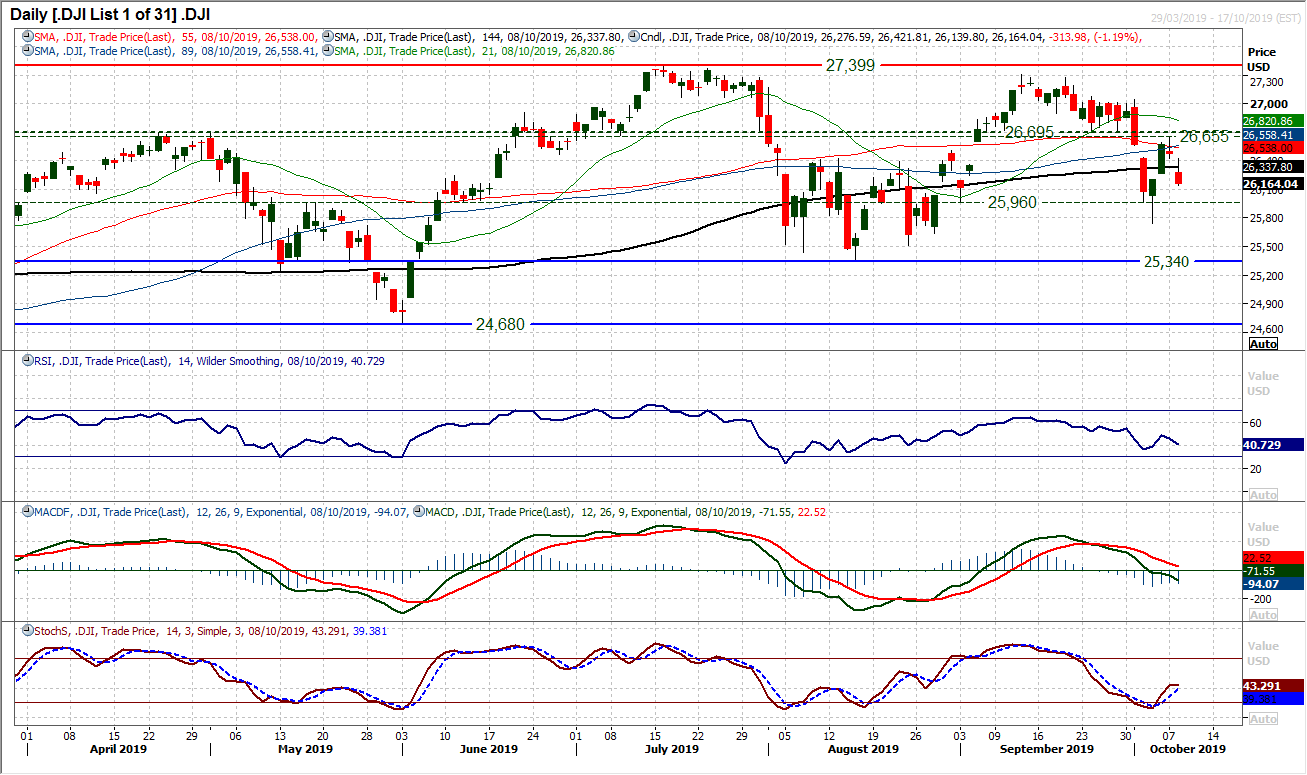
Sellers are taking control once more. The gap analysis for the Dow does not make pretty reading if you are bullish right now. Firstly an initial downside gap early in yesterday’s session was subsequently filled (baring all but 3 ticks) to leave resistance at 26,422 before a sell-off gathered pace. However, the sell-off also then closed the bullish gap from Friday last week. Allied to the deterioration in momentum (RSI and Stochastics rolling over, whilst MACD lines are falling into negative) and the bears are finding their feet again. The focus now turns to the old pivot at 25,960 as the next downside test, whilst last week’s low at 25,745 also comes quickly back into sight. Negative configuration across hourly technicals suggests that intraday rallies are a chance to sell now. Resistance at 26,655/26,695 is now key.
"""DISCLAIMER: This report does not constitute personal investment advice, nor does it take into account the individual financial circumstances or objectives of the clients who receive it. All information and research produced by Hantec Markets is intended to be general in nature; it does not constitute a recommendation or offer for the purchase or sale of any financial instrument, nor should it be construed as such.
All of the views or suggestions within this report are those solely and exclusively of the author, and accurately reflect his personal views about any and all of the subject instruments and are presented to the best of the author’s knowledge. Any person relying on this report to undertake trading does so entirely at his/her own risk and Hantec Markets does not accept any liability. """
