Market Overview
With little data to really change the narrative over the next couple of days, traders will be trading off scraps from the US/China trade story. On Thursday the top level negotiators for both sides will meet. Chinese vice Premier Liu He will sit opposite Robert Lighthizer and Steven Mnuchin of the US in an attempt to thrash out an agreement. However, before then, there are talks between lower level officials in Washington to pave the way for these later negotiations. There are mixed signals coming out already, but the crux seems to be that if there is any room for a deal, it is likely to be smaller in scope. A deal covering perhaps agricultural goods which potentially allows a suspension of further tariffs is becoming the expectation. China and the US appear to be quite a way apart on the main sticking points of technology and government subsidies. So, these talks are unlikely to be a game changer but positivity that at least something may come out of the negotiations is providing some light relief so far. At this stage, there is a fairly upbeat bias to market reaction to this. Sentiment is moving out of safety with the yen sliding and gold off. Furthermore, there are signs of a turnaround on Treasury yields, with the 2 year yield around +10bps this week and the 10 year yield around +8bps. This is helping the dollar to gain ground too. After a mixed session yesterday, equities are also picking up again. It is important to note that newsflow on the trade story is likely to ebb and flow this week, but early signs are at least relatively positive.
Wall Street closed lower with the S&P 500 -0.4% at 2939 however US futures are ticking higher this morning by +0.3% which is reflected through gains on Asian markets (Nikkei +1.0%). European markets are following the lead of Wall Street futures, with the FTSE futures +0.3% and DAX futures +0.4% higher. In forex, there is a tentative move again this morning, but broadly risk positive. The main underperformer is JPY whilst GBP continues to be dogged by Brexit uncertainties, whereas amongst the gainers we have AUD and NZD bouncing solidly higher. Commodities are also looking risk positive, with gold off by -$2 whilst oil has opened higher again (c. +0.8%).
There is a very light day of data on the economic calendar, with the US PPI at 1330BST only really there to trouble traders. The consensus forecast is for September headline PPI to remain at +1.8% (+1.8% in August), with September core PPI to stay at +2.3% (+2.3% in August).
However, it is another day of important Fed speakers, with Charles Evans (voter, mild dove) speaking at 1835BST. The main event though will be Fed chair Jerome Powell who is speaking at 1850BST. For the UK’s Bank of England speakers there are a couple to watch for, with Andy Haldane (leans hawk) at 0920BST and Silvana Tenreyro (centrist) at 1030BST.
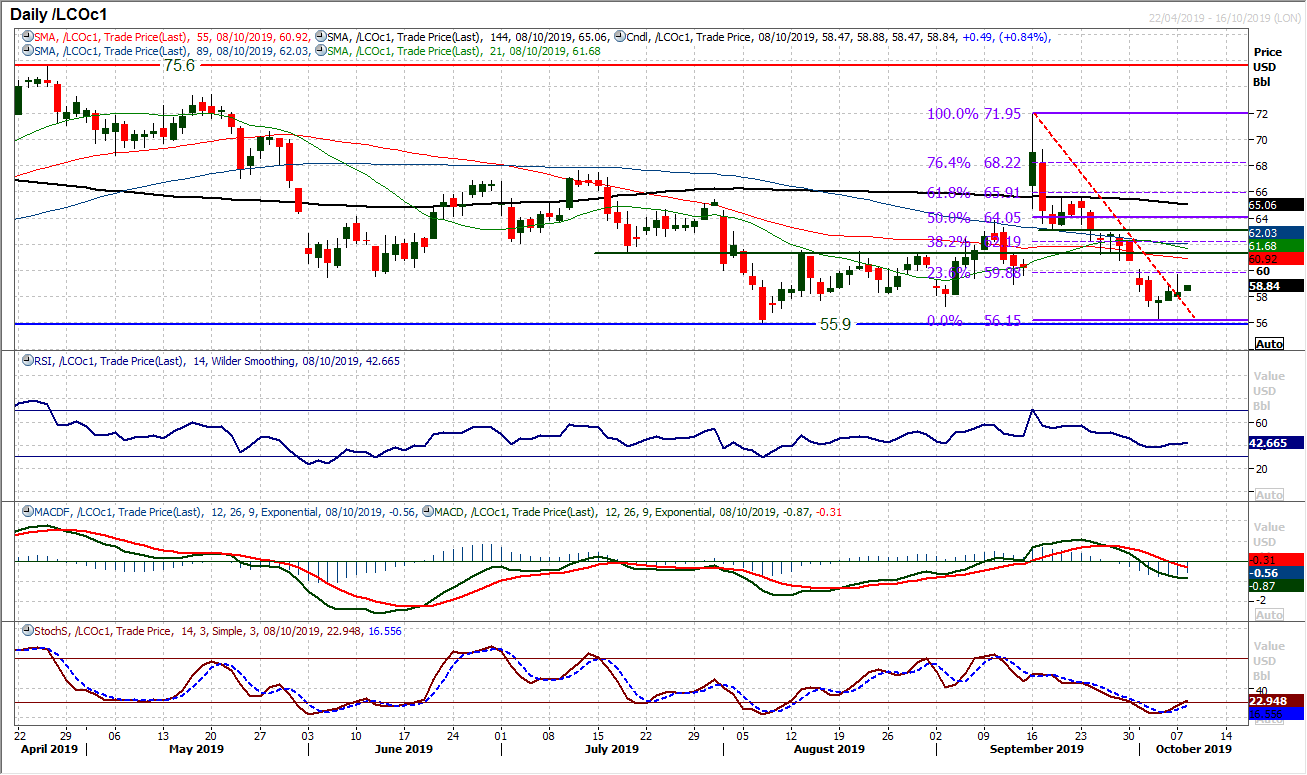
Chart of the Day – Brent Crude
After coming under sustained corrective pressure in the past few weeks, finally signs of life from the oil bulls. Brent Crude has been trending sharply lower in the sell-off but a run of three positive candles in a row have now broken this downtrend and momentum is starting to improve for a near term rebound. However, it is important that the bulls need to respond well after giving up over 2% from yesterday’s intraday high. There are building signs of a recovery but these could be quickly dispelled by a couple of negative sessions. The positive open today suggests that there is still an appetite to support a recovery. A bull cross on the Stochastics (not yet confirmed) has been seen, whilst RSI is stable around 40 as momentum looks to be bottoming. The key test will be the 23.6% Fibonacci retracement of the $71.95/$56.15 sell-off (around $59.90) which acted as a basis of resistance again yesterday. A close above which would open 38.2% Fib at $62.20. The resistance at $60.10 played a role in what looks to have been an exhaustion of the selloff last week and is important resistance on the way back up. Furthermore, the market would need to close the gap at $60.75. If these can be achieved then the market will be generating upside traction in the recovery.
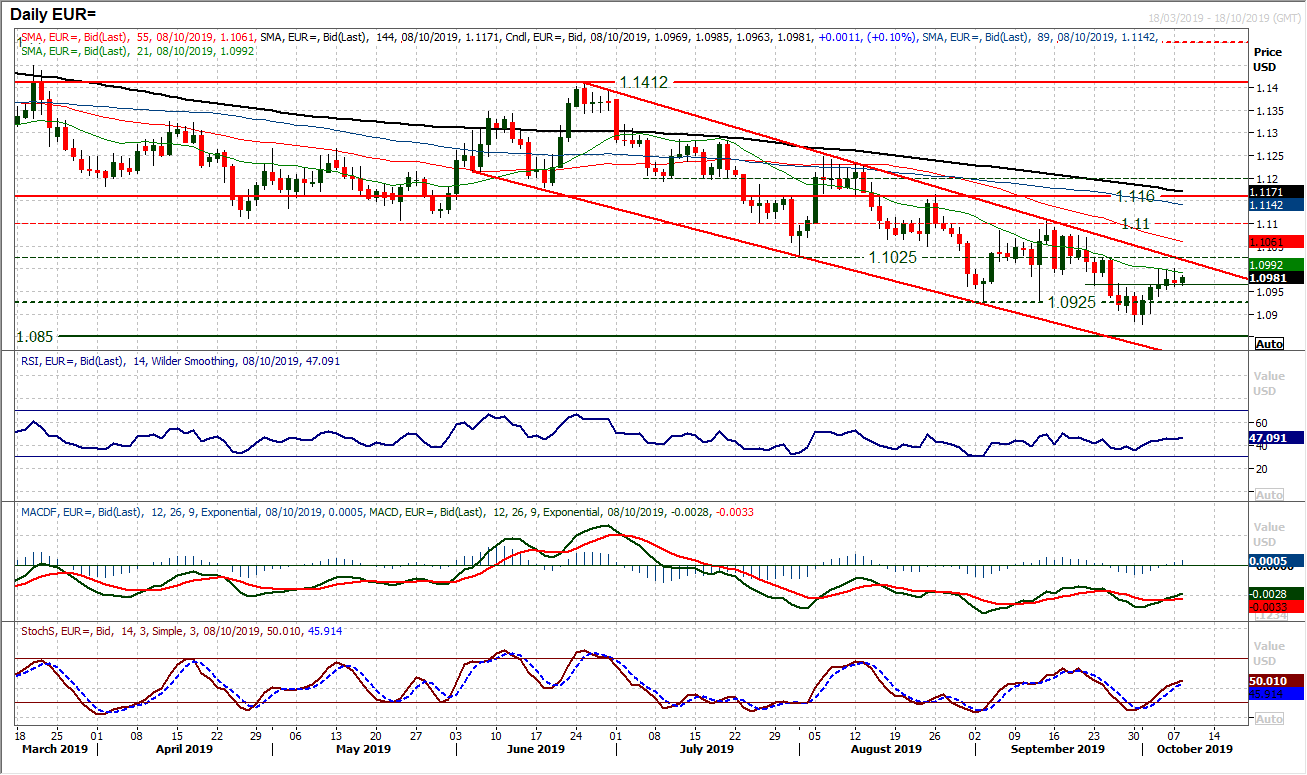
A cautious consolidation has set in on EUR/USD. However, the concern will be that this is playing out under the falling 21 day moving average (at $1.0990) which has previously been a good gauge within the downtrend channel. Momentum is also becoming a concern as the impetus of the recovery is waning as the RSI and Stochastics tail off under 50. Small bodied candlesticks reflect a lack of conviction in the market now, with the US/China negotiations clearly a factor. There is a resistance band $1.1000/$1.1025, with the trend channel resistance falling today at $1.1020. The bulls have their work cut out to prevent another near term rebound being sold into. Closing below $1.0965 (a near term pivot) would add bear pressure. Below $1.0940 would begin to drive negative traction for $1.0875/$1.0900.
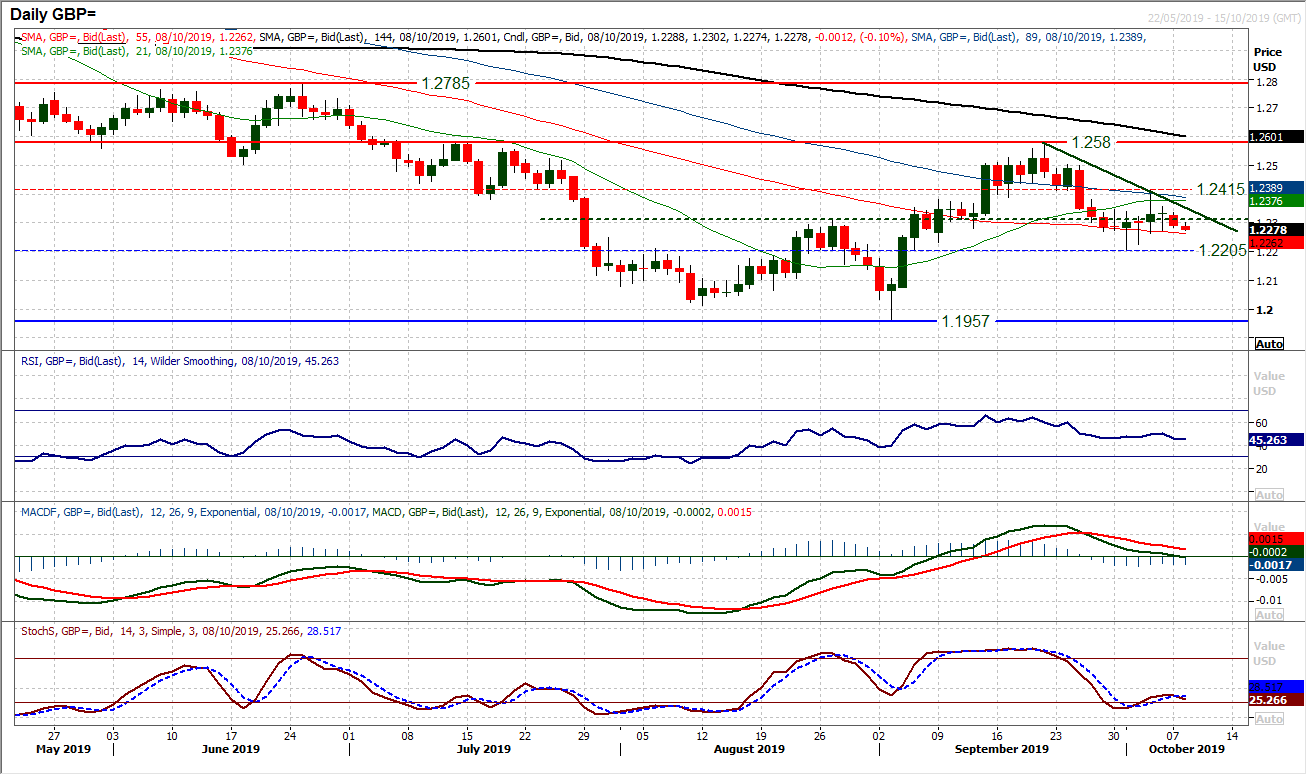
The mild creep higher of last week lacked conviction but is now being replaced by a mild negative drift. Yesterday’s -40 pip decline pulled the reins on a move higher but taking a step back we see very little of any conviction in Cable right now. The market is essentially trading within a couple of pivot levels now, between $1.2205 as support and $1.2415 as resistance. Almost bang in the middle of that lies the old neckline of the base pattern around $1.2305. We see momentum indicators (especially RSI and MACD lines) flat around their neutral points, whilst moving averages are also giving very little direction. This drift into a consolidation of the past week or so comes with uncertainty of the US/China trade negotiations and a crucial stage of Brexit. The hourly chart gives very little by way of direction either. Below $1.2270 starts to lend some negative steer, whilst above $1.2355 gives more of a bullish bias.
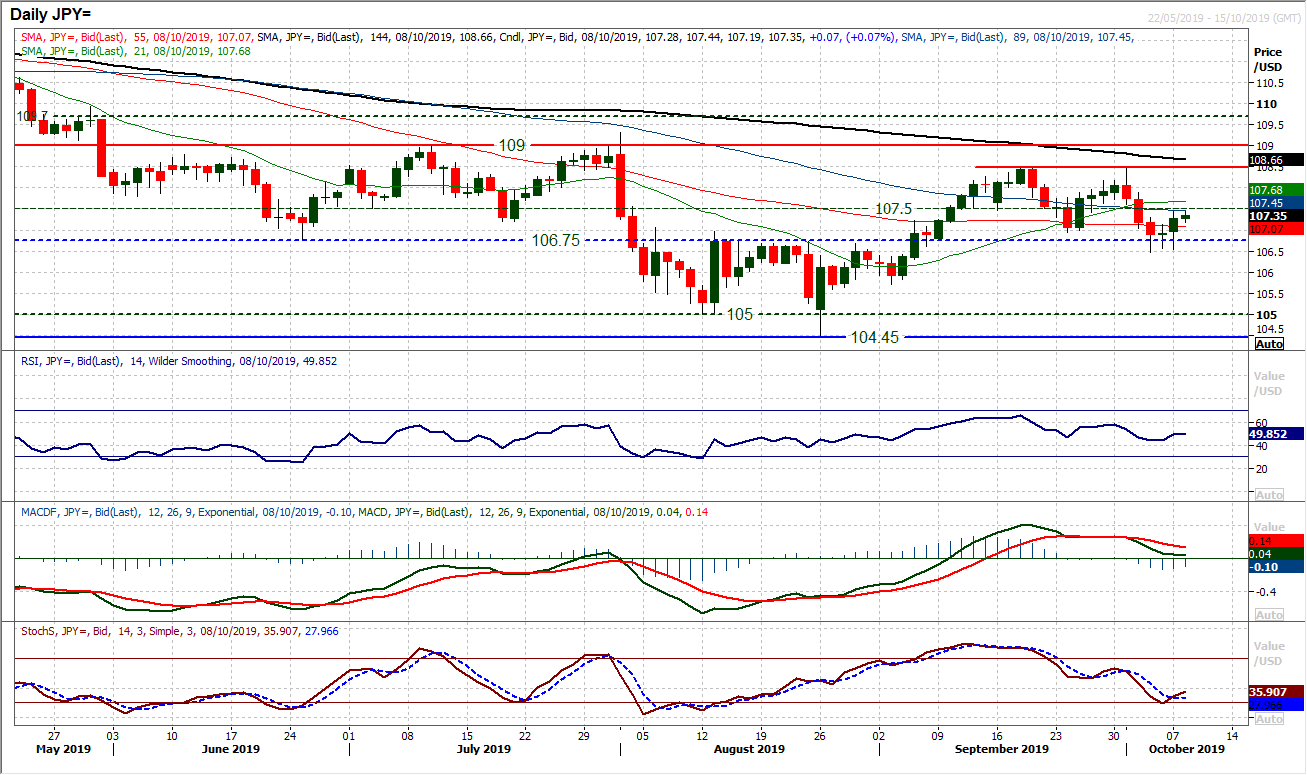
The bulls have started an important week in a positive frame of mind. A mild bullish engulfing candle has swung the recent decline around and the market is pulling higher again. Closing decisively above 106.95 suggests that the bulls do not intend to give way yet. The move has resulted in the momentum indicators ticking back higher again to neutralise what had looked to be a threatening corrective move. Trading around a grouping of flat moving averages suggests the near to medium term outlook is neutral now. If the bulls can clear the old pivot at 107.50 this would add a more positive outlook again to what must now be seen as a growing trading range of around 200 pips between 106.50/108.50. The hourly chart shows initial support 106.95/107.10.
Gold
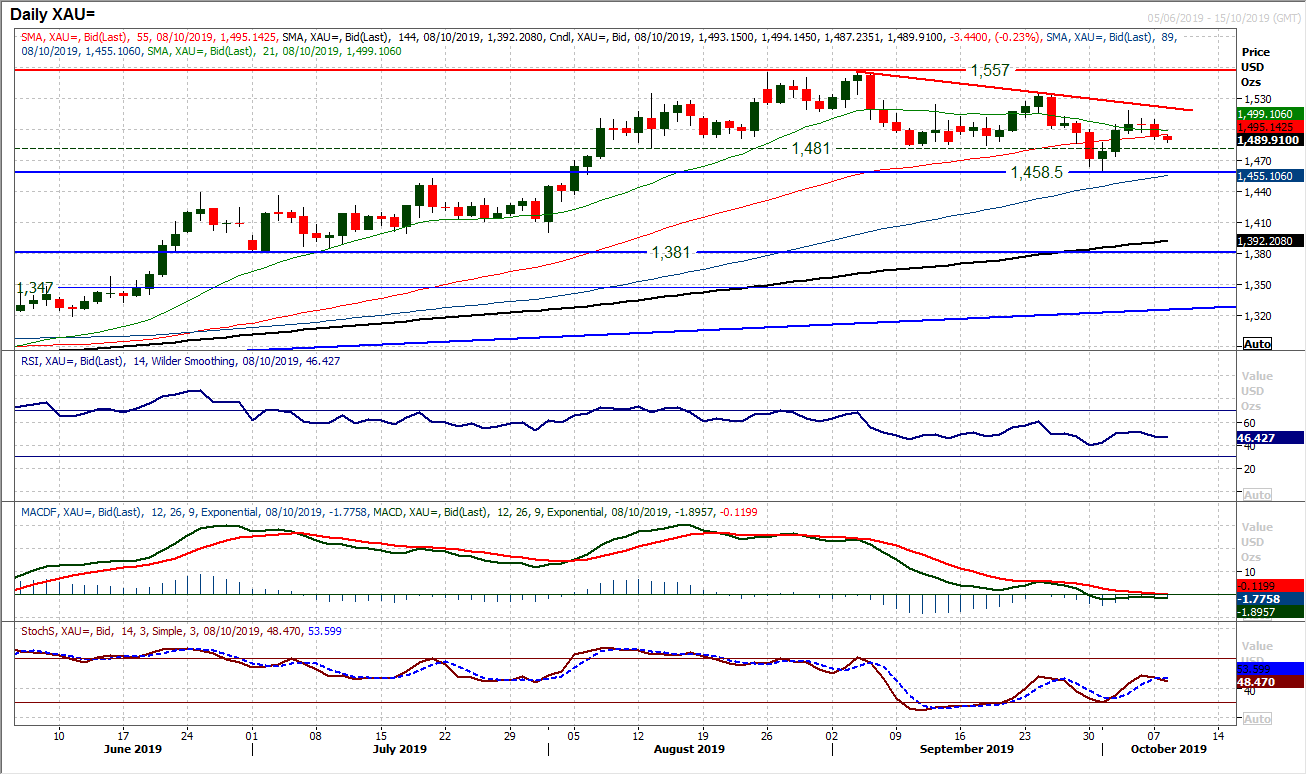
As this week progresses we are likely to see some more decisive candles and volatility becoming elevated. For now, there is a mild drift, but the move is away from the safe havens, and that is pulling on gold lower. A consolidation ended last week and now yesterday’s -$10 loss is threatening to put a corrective outlook back on gold. A close back under $1500 is becoming a concern now, whilst the momentum indicators are beginning to roll over again. The RSI back under 50, Stochastics bear crossing, and MACD lines back below neutral. There is not enough conviction in this move yet, but it does reflect a mild risk positive bias that is entering into major markets surrounding the US/China negotiations. The hourly chart shows pivot support at $1487 and then $1475. Initial resistance at $1495/$1497 as the importance of $1518.50 as resistance grows.
WTI Oil
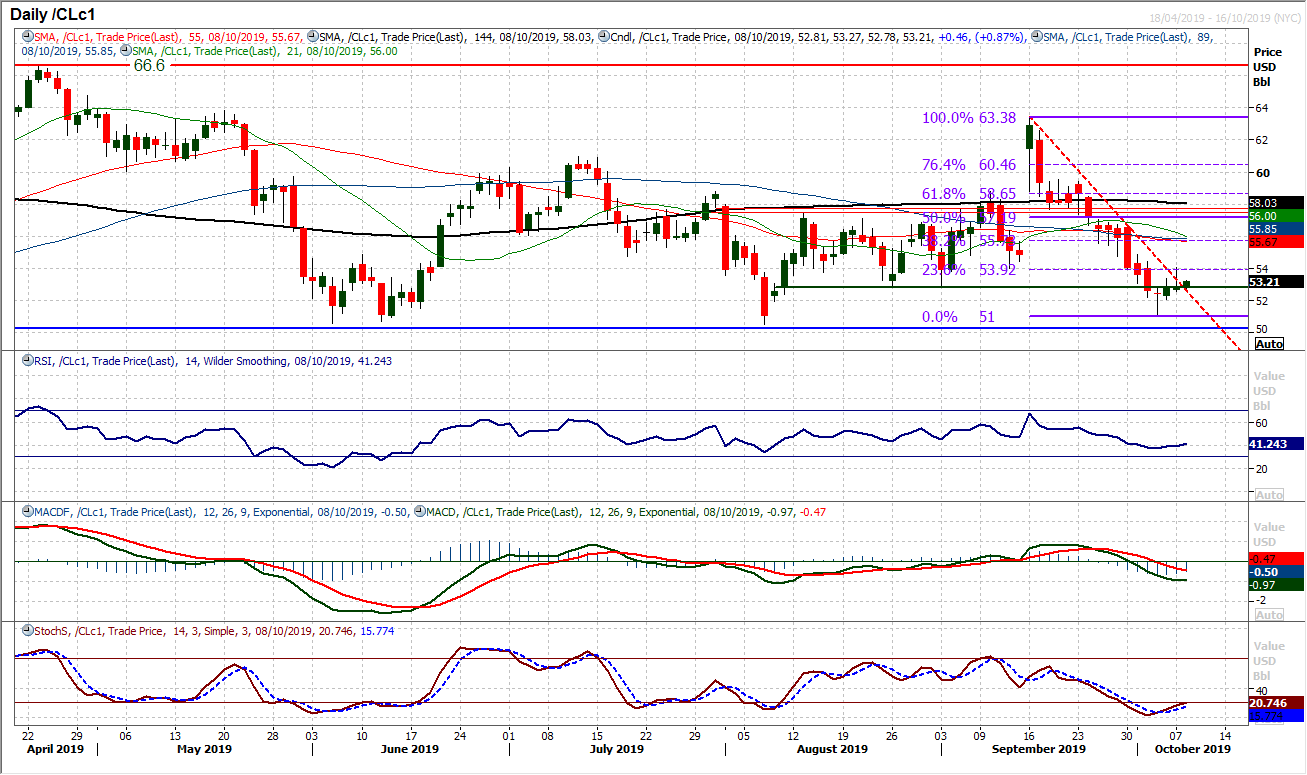
The bulls had a bit of a false start yesterday as the market dropped away into the close. Despite this, they go again today and recovery potential is growing. Another positive open today leaves the market testing the resistance band $52.85/$54.00. A broken three week downtrend, along with a mild improvement in momentum (or at least stabilisation) also adds to a sense that something is building for the bulls. It is still far too early yet, but a close above $54.00 would be a significant sign of recovery. The hourly chart shows far more positively configured momentum now, as intraday rallies are now being bought into (RSI above 40, MACD lines above neutral). Initial support of a higher low at $52.05.
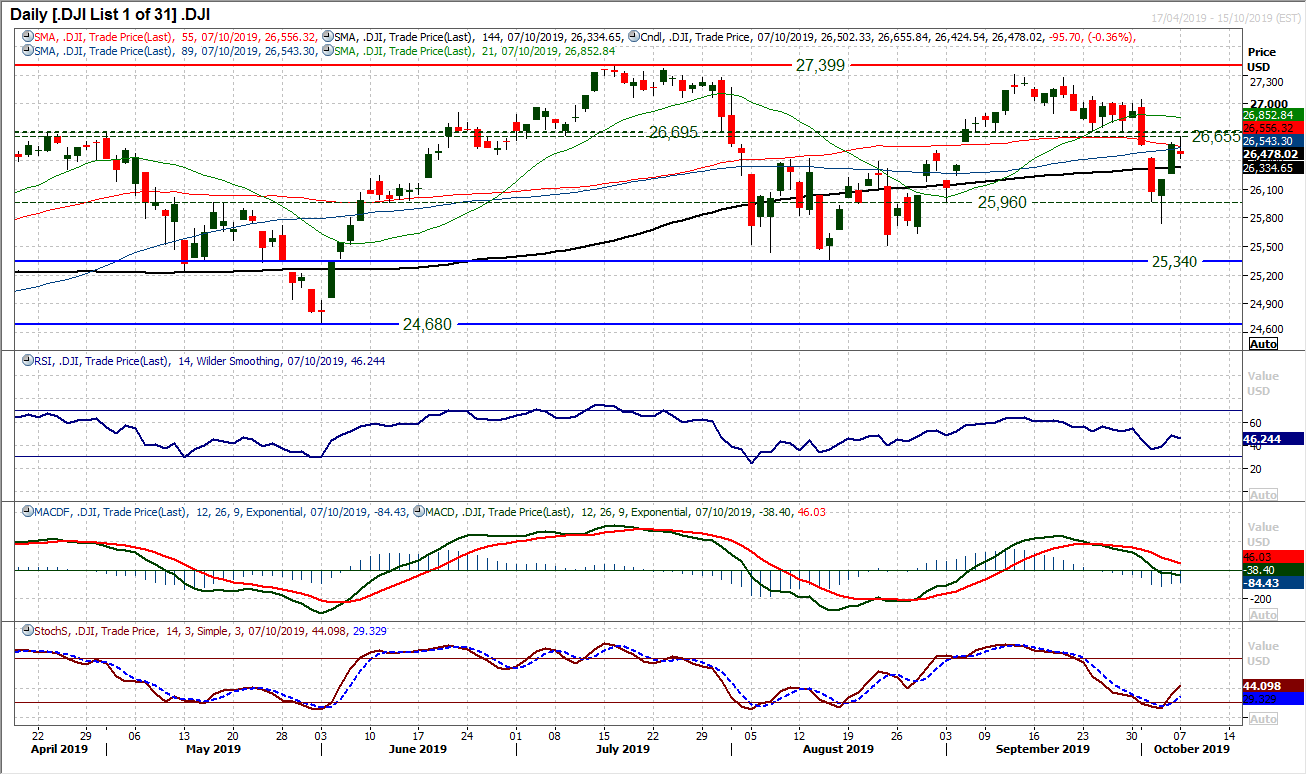
The bulls will have been a little disappointed to start the week in such a drab manner. Closing the session solidly lower on the day and also an initial bull failure too. This move has just taken some of the wind out of the sails of the recovery, dragging on previously improving momentum signals. However, given the caution surrounding the US/China trade negotiations this week, this is a candlestick in keeping with a market in wait and see mode. However, the hourly chart shows the market bumping up against resistance around the 26,650/26,700 area and failing. The hourly RSI is also turning over around the 60 mark and MACD lines threatening to cross lower again. The bulls need to respond to prevent these from being sell zones. Under 26,450 there is support at 26,100 and then the low at 25,745.
"""DISCLAIMER: This report does not constitute personal investment advice, nor does it take into account the individual financial circumstances or objectives of the clients who receive it. All information and research produced by Hantec Markets is intended to be general in nature; it does not constitute a recommendation or offer for the purchase or sale of any financial instrument, nor should it be construed as such.
All of the views or suggestions within this report are those solely and exclusively of the author, and accurately reflect his personal views about any and all of the subject instruments and are presented to the best of the author’s knowledge. Any person relying on this report to undertake trading does so entirely at his/her own risk and Hantec Markets does not accept any liability. """
