Market Overview
The number of deaths from the Coronavirus has passed 900 and the virus is now officially more deadly than SARS. However, there are also suggestions that perhaps the virus is beginning to peak, as the number of new cases may be starting to decelerate. Although this was only one day (and may still be an anomaly), there is a sense of greater optimism in markets this morning. This has allowed an early consolidation, with a bias towards a traditional “risk-on” swing of flow back out of safety and into higher risk being seen.For the safe havens, Treasury yields are rebounding again (the 10 year is a few basis points higher), whilst the yen is falling back again across the majors. This mild risk bounce is also helping the Chinese yuan and the Aussie higher.Chinese inflation for January coming in higher than expected and may also be playing into this, with China CPI at +5.4% (+4.9% exp, +4.5% last), whilst China PPI was in line at +0.1% (+0.1% exp, -0.5% last). There is also a degree of stability on equity futures today after Friday’s corrective session (even if European markets are playing a bit of catch-up early today following the US falls from Friday). However, there is still much uncertainty over the market fluctuations and little confidence that a real turning point can be called quite yet. In this environment, the US dollar remains a currency of choice, furthermore, gold also seems to be well supported.It is a very quiet day to start to the week on the economic calendar, with no key economic releases due.There are a couple of Fed speakers to keep an eye on. Michelle Bowman (board member voter, mild hawk) is speaking at 1315GMT, whilst Patrick Harker (regional voter, mild hawk) is speaking at 2015GMT
Chart of the Day – AUD/JPY
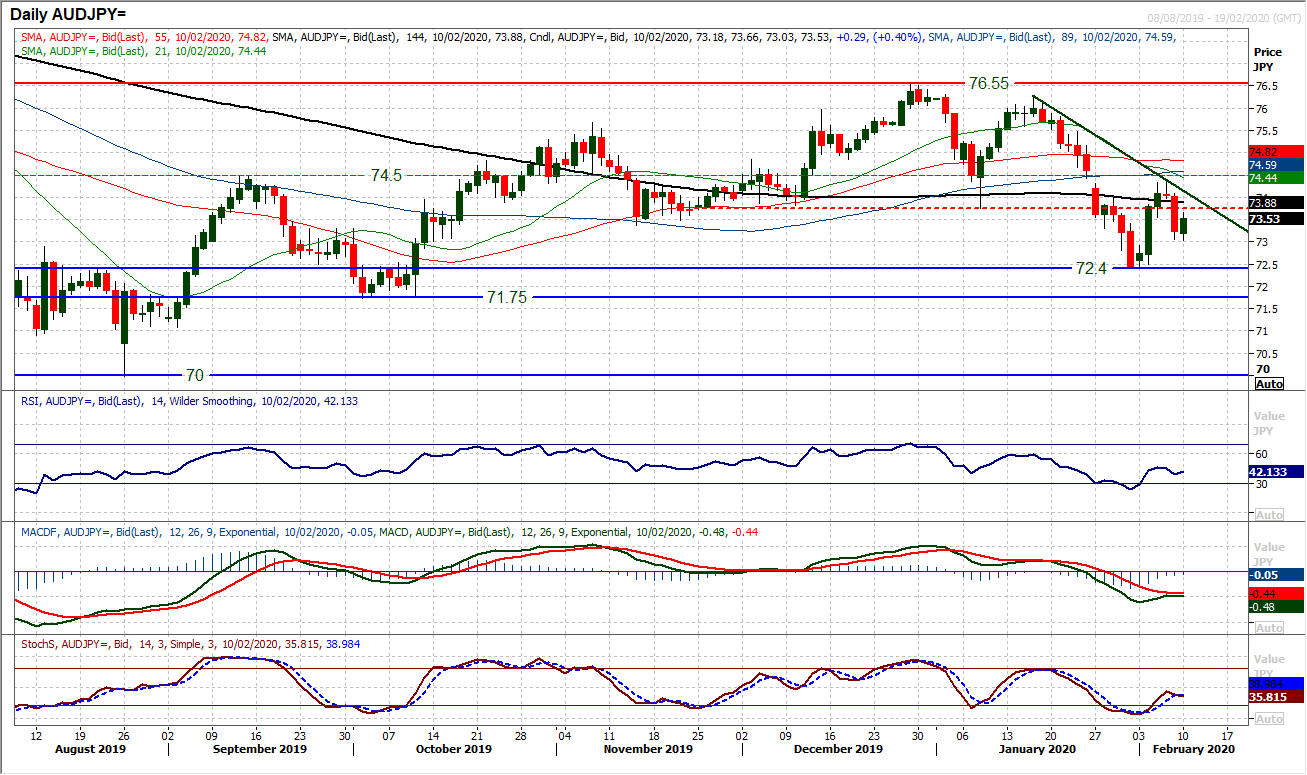
Aussie/Yen always tends to be a good gauge of risk appetite. We saw risk aversion decisively coming back into the market on Friday and this is positive for the yen, but also negative for the Aussie too. Subsequently, AUD/JPY formed a sharp bear candle and puts the market back on a corrective path. A three week downtrend has re-asserted and it means that the early February recovery from 72.40 has left a lower key high at 72.40. The bulls will notice some worrying indicators. A three week downtrend adds to resistance now in the band 73.75/74.40 and today’s early rally looks to be a selling opportunity. Momentum indicators look to be unwinding from bearish configuration but to renew downside potential. The RSI is faltering under 50, whilst Stochastics and MACD lines prepare for renewed negative patterns. Whilst this three week downtrend is intact the outlook will remain corrective. So we look to use intraday rallies as a chance to sell and bias is towards pressure on 72.40 to come in the next few days, whilst a breach opens the October low at 71.75. Above 74.40 would change the outlook.
EUR/USD
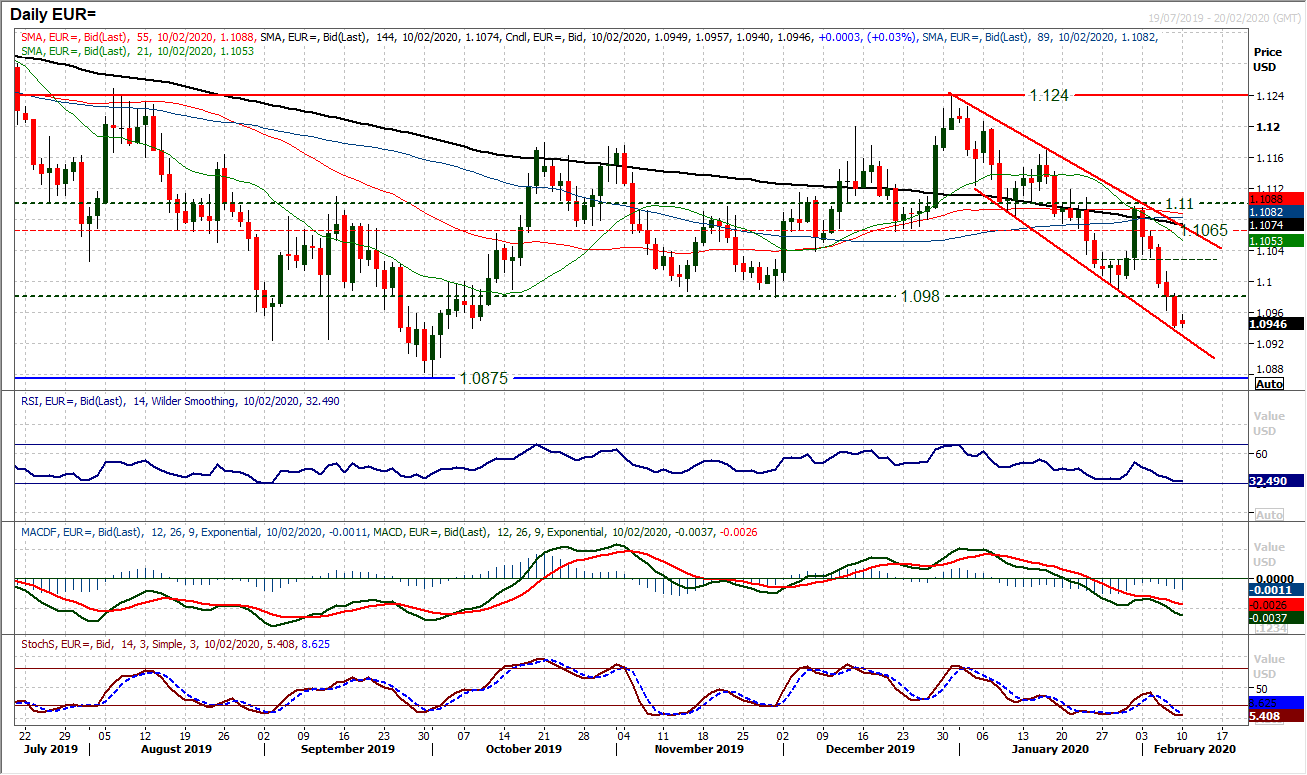
Having broken decisively below $1.0980 key support, the outlook is increasingly turning towards a retest of the key low around $1.0875. The downtrend channel is firmly intact and momentum indicators negatively configured. After five consecutive decisive bear candles have taken the market to within touching distance of the channel lows (today at $1.0930), and momentum indicators deep towards their bearish positioning, there has been a mild technical rally this morning. We look for near term rallies to be sold into. The overhead supply is strong around $1.0980/$1.1000 but as we saw with the late January rally, if a rebound sets in, it can reach the channel high again (around $1.1065 today). There is scope for another technical rally near term, but we would only see it as counter to the trend channel and be another chance to sell.
GBP/USD
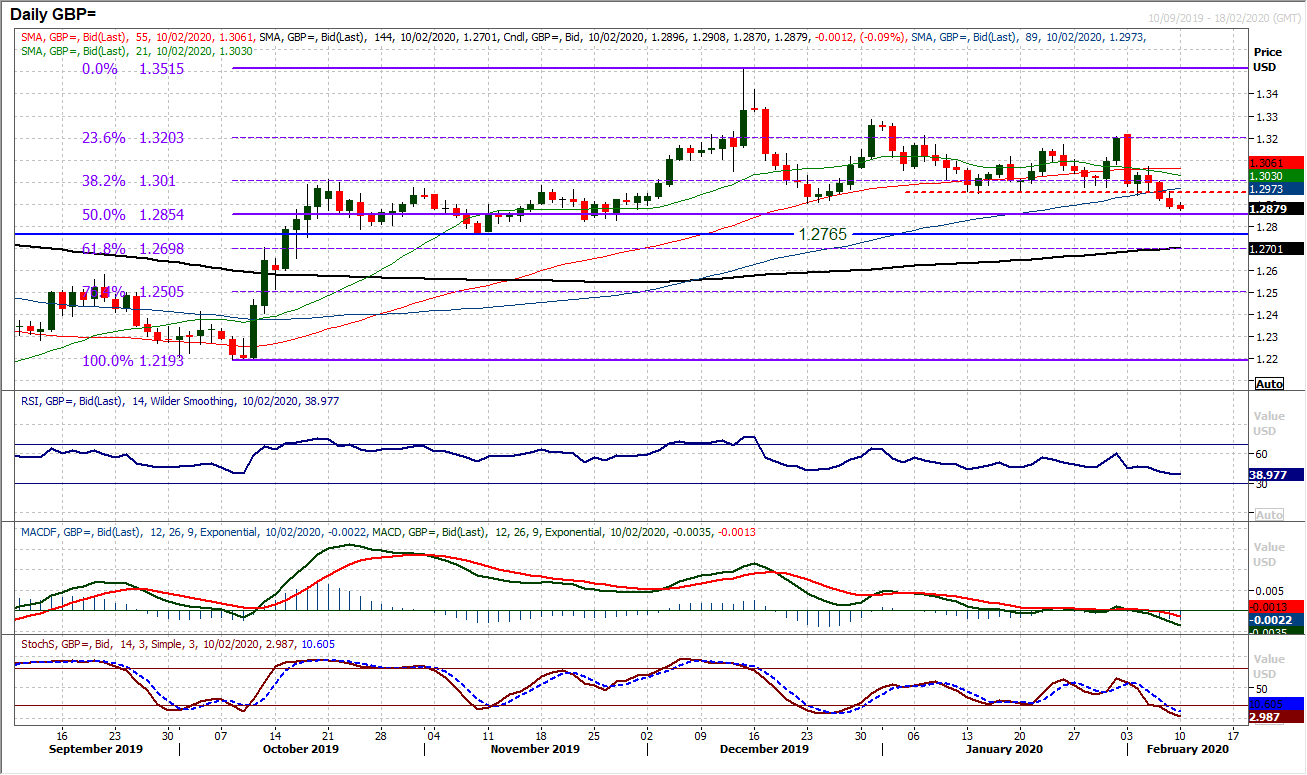
Our positive medium term outlook has taken a hit in recent sessions. With the US dollar continuing to be the currency of choice as market fear of the Coronavirus plays out, Cable has now broken down. Losing the support of the floor at $1.2900 (late December low) on Friday is a two month low and now risks weakness towards the key November low at $1.2765. Momentum indicators have shifted in their configuration. The RSI and MACD lines both confirm the two month lows and suggest pressure mounting lower. How the market responds now to the old January floor of lows between $1.2940/$1.2960 will be telling. An early rebound today needs to gather quick recovery momentum back through $1.3000 otherwise a more entrenched corrective outlook will take hold.
USD/JPY
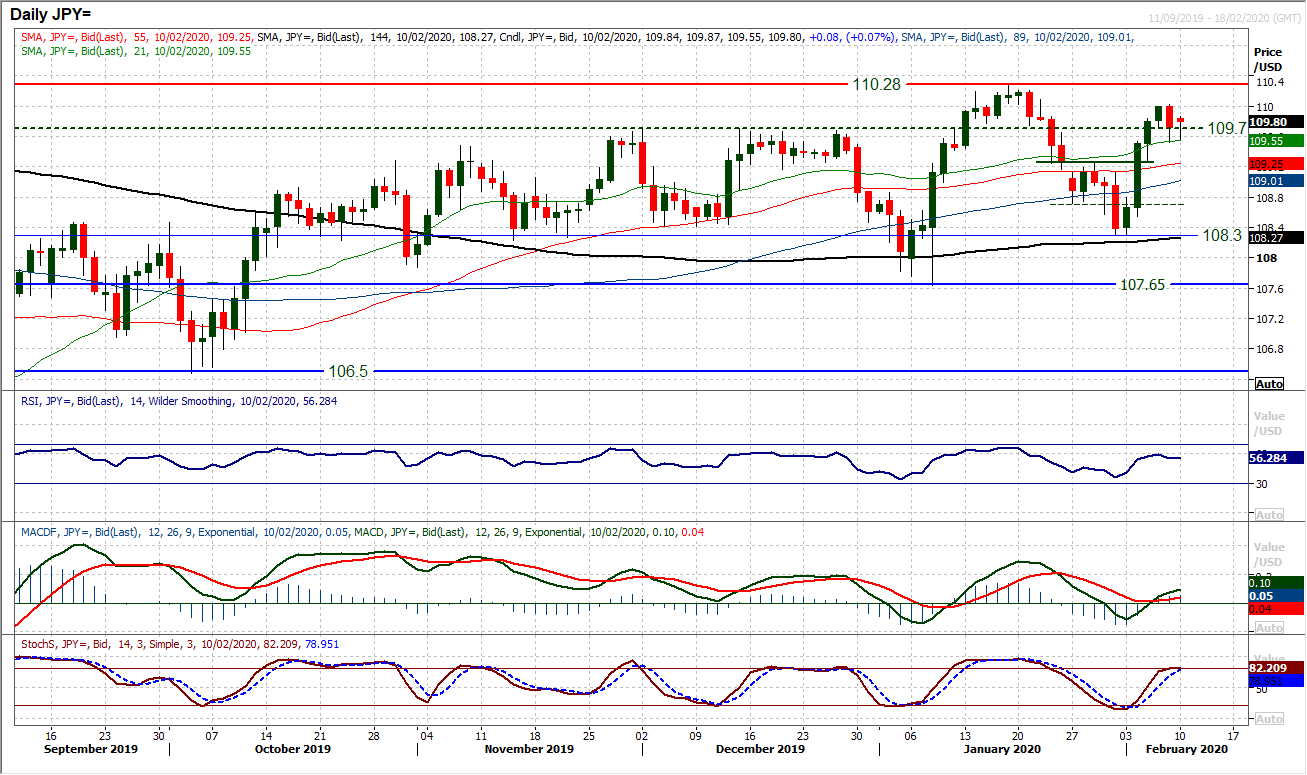
The yen spent much of Friday’s session trying to maintain renewed strength, however the broad outperforming dollar trend of the past week looks to be reasserting again into the new week. The negative candle for Friday suggests the dollar bulls do not have it all their own way, and there are question marks over the prospects of a retest of 110.30 now. However, Dollar/Yen is trading above all rising moving averages, with momentum indicators positively biased (RSI, MACD, Stochastics all rising above their neutral points). This suggests that near term weakness is still a chance to buy. Whilst the pivot at 109.25 remains intact (Friday’s low of 109.50 helps to bolster this) then the outlook will remain positive. Friday’s high of 110.00 is initial resistance.
Gold
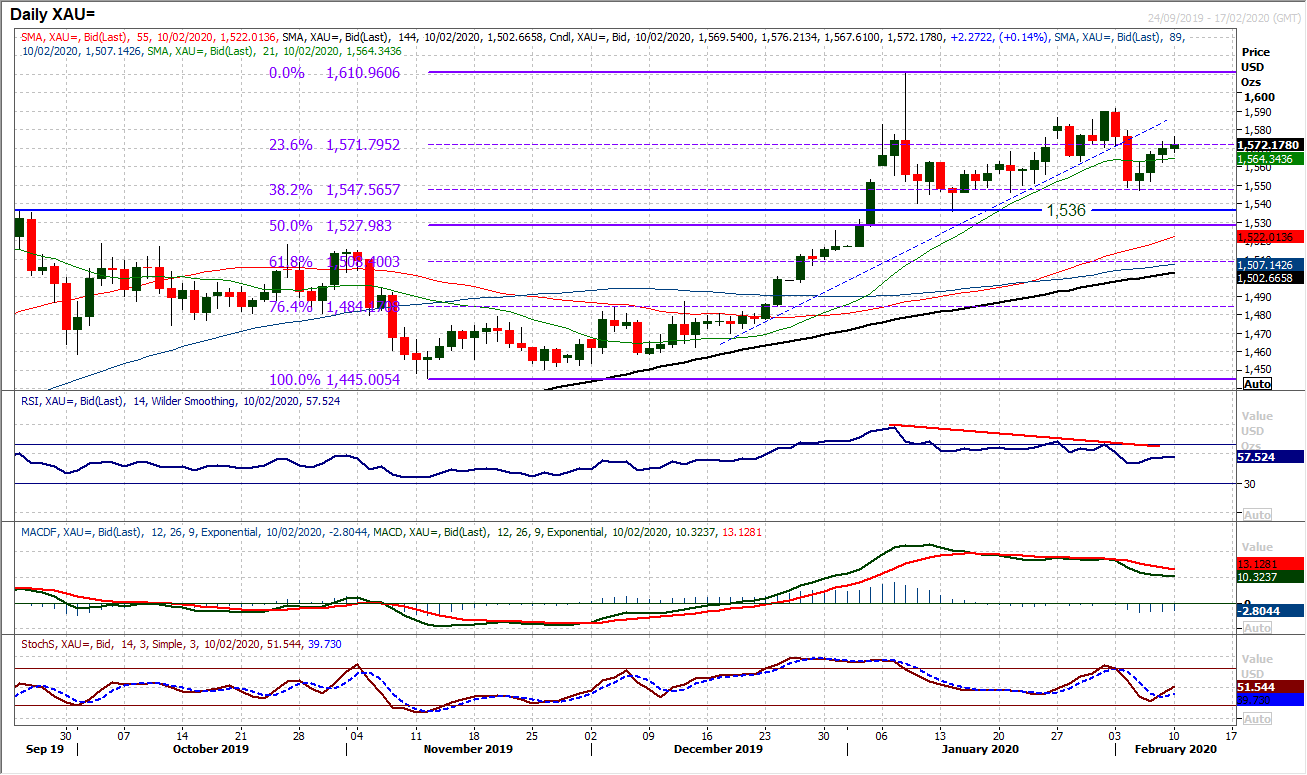
The outlook on gold remains mixed after Friday’s small-bodied candlestick. Although the pressure is beginning to build once more for a positive bias, given the corrective signals still present on MACD and RSI, we are still mindful that the bulls are no longer in control of the market. This makes for what is likely to be an ongoing period of uncertainty on gold (impacted by risk-on/risk-off newsflow of the Coronavirus). The Fibonacci retracements of the November to January bull run (from $1445/$1611) maintain an important role in the near term outlook. 38.2% Fib is supportive at $1548 whilst 34. 6% at $1572 is a basis of resistance. Whilst the market trades within these bounds, there is a mixed outlook. However, with another early mild positive move, a renewed positive bias is threatening, and a close above $1572 would re-open the recent high of $1581 as resistance.
WTI Oil
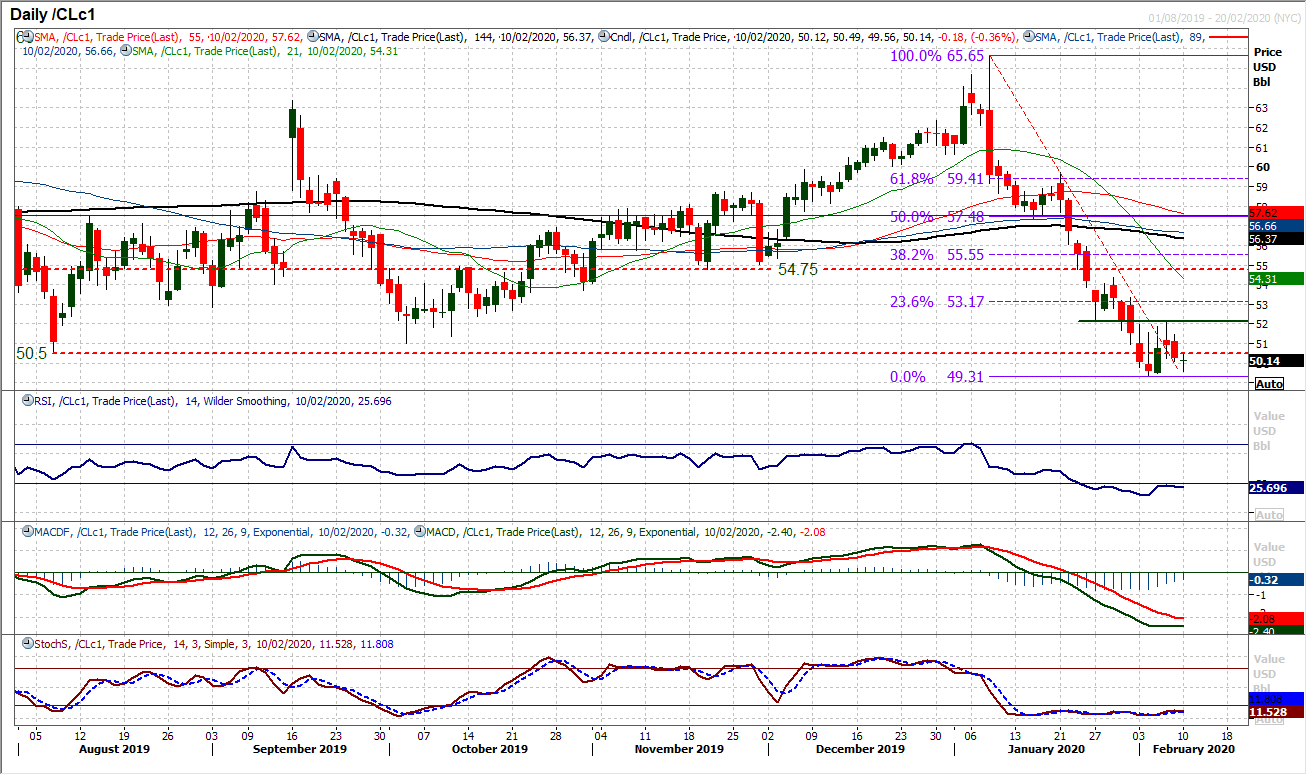
The bulls just could not quite get going in the recovery last week, however, there are signs that the market is at least happier to support weakness. Has a floor at $49.30 been reached, at least for now? Another early slip back lower has held on to this support this morning. Momentum indicators remain strongly negatively configured, but there is also a sense that momentum indicators are looking to develop some sort of low, but the prospect of this turning into a sustainable recovery is still some way off. Watch for two consecutive positive candles, the RSI above 30 and Stochastics above 20 to be initial signals of recovery. The resistance at $52.00/$52.15 is also key to this. Until then the bears remain in control. Below $49.30 continues the negative track lower.
Dow Jones Industrial Average
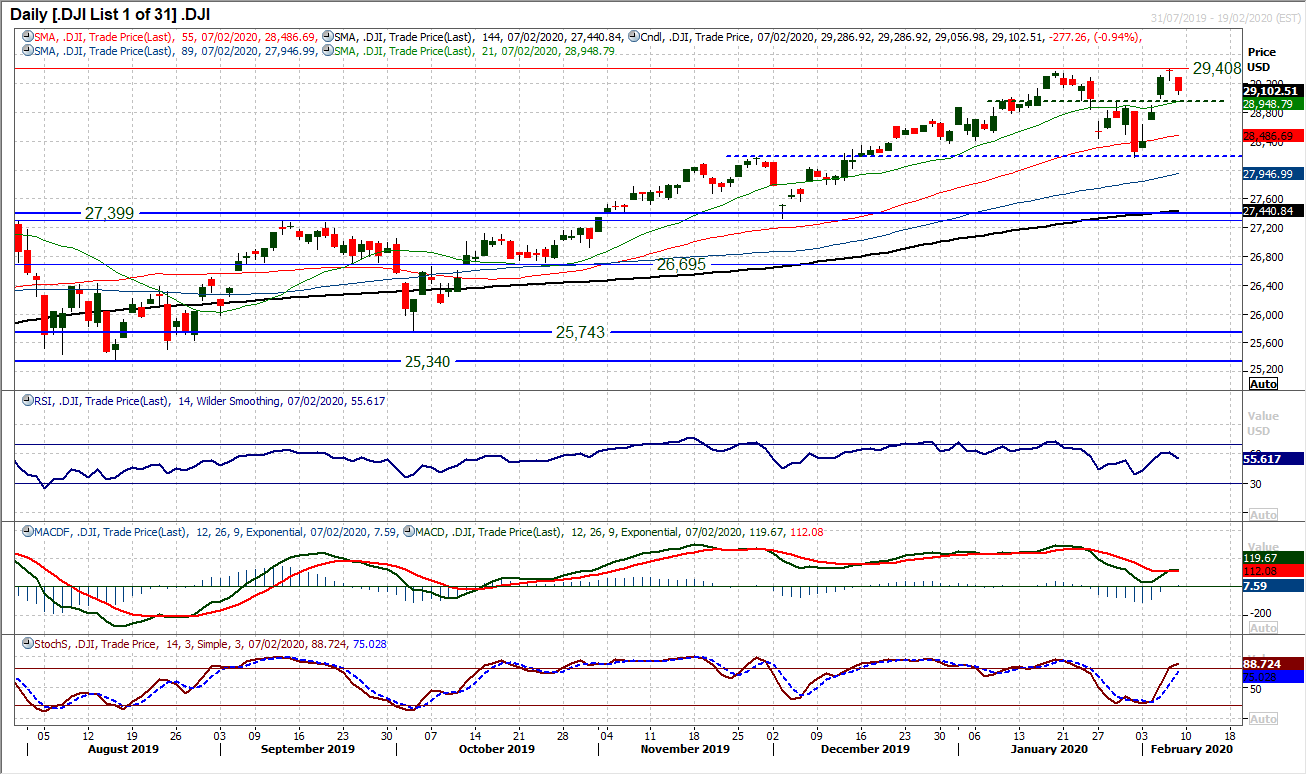
A warning for the bulls. An “evening star” three candlestick set up is a corrective signal. The run goes: solid bull candle, gap higher (filled) on a near doji candle, with finally a solid bear candle. A failure at an all-time high adds to concern, there was an intraday gap down at the open on Friday. This pattern comes amidst great uncertainty surrounding how the market reads the Coronavirus on a day-to-day basis. However, if there were to be a close back under the pivot support around 28,900/28,950 support then the corrective calls would grow. For now, our near term outlook becomes a little more cautious but are not turning negative quite yet. Momentum is looking increasingly uncertain on a near term basis, as RSI again turns lower and MACD lines are losing their direction higher. However, there needs to be more than just ranging signals for us to turn outright corrective. Resistance is clear now at the all-time high of 29,408 whilst Friday’s high of 29,286 should also be watched. We turn near term corrective under 28,900 however the bulls need to re-assert themselves quickly.
"""DISCLAIMER: This report does not constitute personal investment advice, nor does it take into account the individual financial circumstances or objectives of the clients who receive it. All information and research produced by Hantec Markets is intended to be general in nature; it does not constitute a recommendation or offer for the purchase or sale of any financial instrument, nor should it be construed as such.
All of the views or suggestions within this report are those solely and exclusively of the author, and accurately reflect his personal views about any and all of the subject instruments and are presented to the best of the author’s knowledge. Any person relying on this report to undertake trading does so entirely at his/her own risk and Hantec Markets does not accept any liability. """
