Market Overview
Although a Brexit deal has finally been agreed between the EU and UK, market sentiment is cautious today. The overnight disappointment in Chinese GDP is certainly playing a role here. Economic growth for Q3 slipped to a 27 year low at +6.0% and below the consensus of +6.1%. Although there was a glimmer of light coming from better than expected September Industrial Production (Retail Sales and Fixed Asset Investment were as expected), the Chinese economy is slowing more than expected. This of course raises the prospect of additional stimulus to manage the slowdown, but the immediate impact is to leave markets a tad cautious. This is likely to continue through today as good news regarding the newly agreed Brexit deal is likely to be in short supply as focus turns from Brussels (although the EU-27 still needs to rubber stamp the deal) to a rather more toxic Westminster. Prime Minister Johnson’s political opponents (and even some more friendly) have been quick to denounce his deal.
Parliament is set to debate the Brexit deal and likely vote tomorrow, but the chances of the deal passing are looking shaky after the DUP (Northern Irish unionists) came out in opposition. There are still a raft of permutations on how this will play out, but there will likely be a significant reaction across sterling markets for Monday’s trading. Sterling is slipping back initially today, although not decisively so yet. Positive newsflow is unlikely to feature today either, so this is adding to a tentative look across major markets today.
Wall Street closed a shade higher with the S&P 500 +03% at 2998, however, US futures are giving this all back initially today. Asian markets were mixed, with the Nikkei +0.3%, but the Shanghai Composite was -1.3% in the wake of the Chinese GDP disappointment. European equities look under pressure in early moves, with the FTSE futures -0.5% and DAX futures -0.4%.
In forex, there is a continuation of the slippage on USD, whilst the underperformance of GBP is the main mover. NZD is the main outperformer.
In commodities, there is a mixed outlook on gold and silver trading around the flat line, whilst oil is giving back some of yesterday’s rebound and again lacks sustained direction.
It is a light economic calendar to finish the week. The EU Current Account for August is at 0900BST and is expected to once more see the surplus increase to +€21.3bn (from €20.6bn in July).
The final batch of Fed speakers for the week comes with Esther George (voter, major hawk) at 1500BST and FOMC vice chair Richard Clarida (voter, mild dove) at 1630BST. There will also be a speech by the Bank of England Governor Carney at 1845BST.
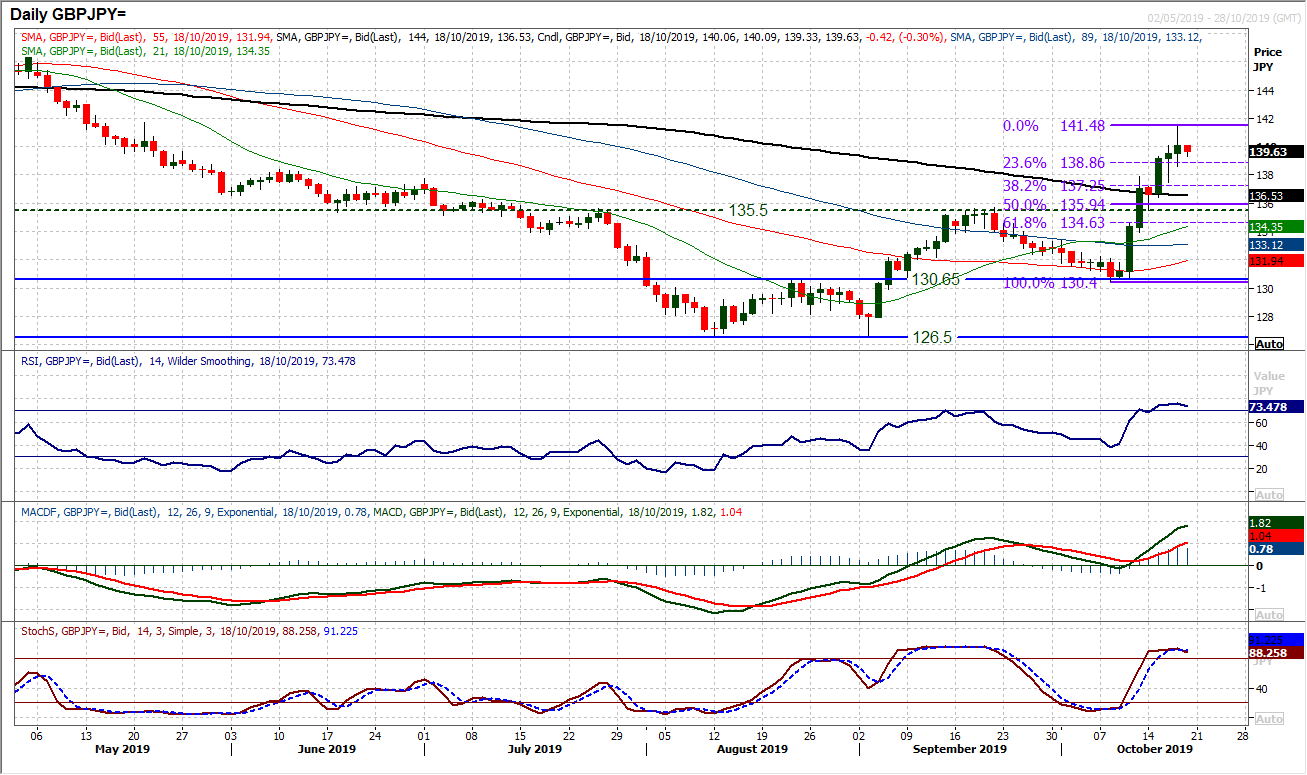
Chart of the Day – GBP/JPY
The pair of the biggest major outperformer (GBP) and underperformer (JPY) has added a huge rally since the middle of last week. At this week’s 141.48 high, the market has added over 1100 pips since the key low at 130.40 and the volatility is not likely to end there. Political wrangling now in Westminster (especially on Saturday) will be a key factor and the market will move on the newsflow today too. Taking yesterday’s spike high at 141.48 and yesterday’s rather uncertain candle could means that the 23.6% Fibonacci retracement at 138.85 becomes a support to note. The 38.2% Fib level at 137.25 but more importantly the 50% Fib at 135.95 become key retracements on any signs of disappointment over the Brexit deal. Give the importance of the breakout at 135.50 (medium term pivot) which also caught Monday’s higher low (hit almost to the tick) this is a key confluence area of support now. The hourly chart today shows a five day uptrend and the 55 hour moving average as a near term basis of support to watch today. A breach of 138.60 (yesterday’s low) would be a corrective signal, but the real action will be on Monday where gaps are highly likely. A market to trade not for the feint hearted.
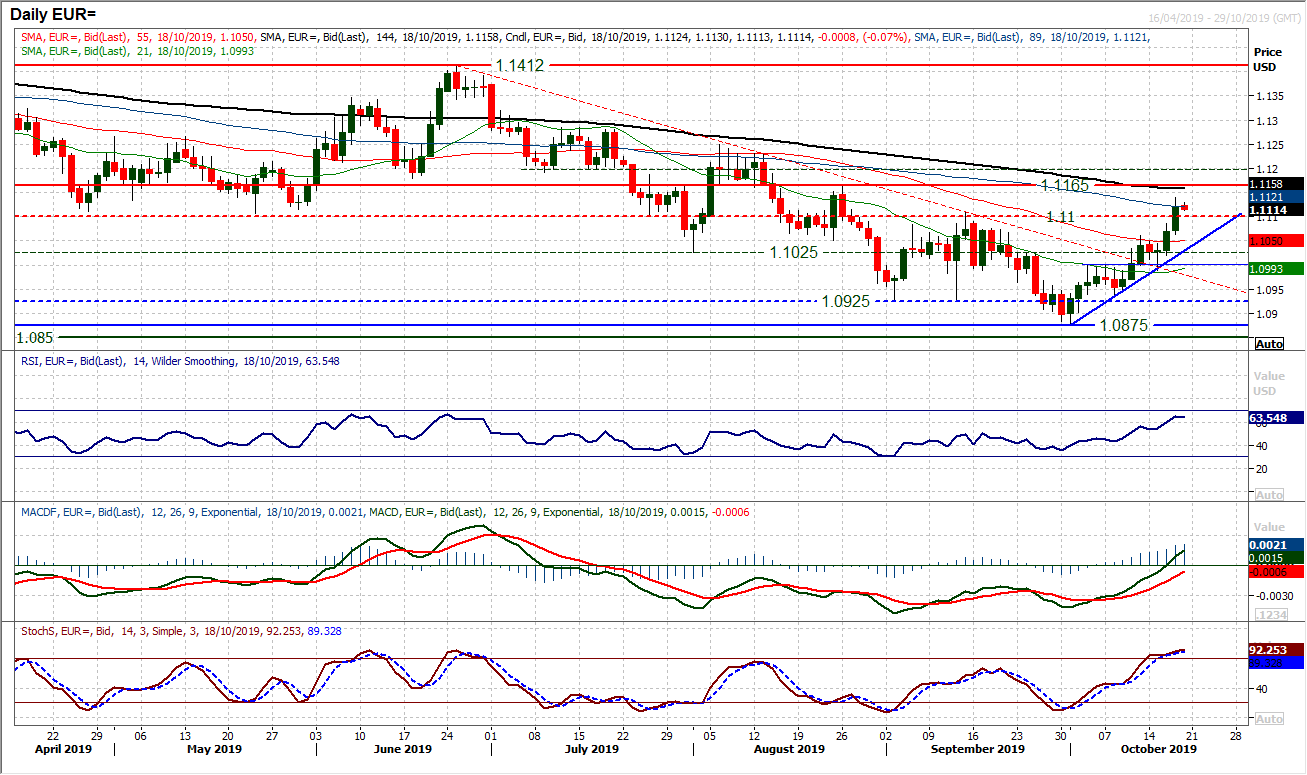
Getting on with life in a post Brexit world would clear sit well with the euro. Another solid and strong positive candle has taken EUR/USD through a series of resistance levels in recent days, but the decisive closing breakout above $1.1100 is the most important. This clears the September high which takes the market to a new seven week high, but more importantly clears the first key lower high of the mid-year sell-off. This is an outlook changing move now. There is plenty more old resistance and overhead supply for the euro to overcome but for the first time in months, the outlook is looking positive. Momentum is increasingly positive (RSI into mid-60s, MACD lines close to pushing above neutral and Stochastics rising above 80). Furthermore, moving averages are turning around. The market is a becoming a little stretched near term and how the bulls react to any adversity will be key. The breakouts this week are supportive, initially at $1.1100 and then $1.1060 and the key higher low at $1.0990. The euro is a buy into supported weakness with a view to testing further resistance at $1.1165 and the next key lower high at $1.1250.
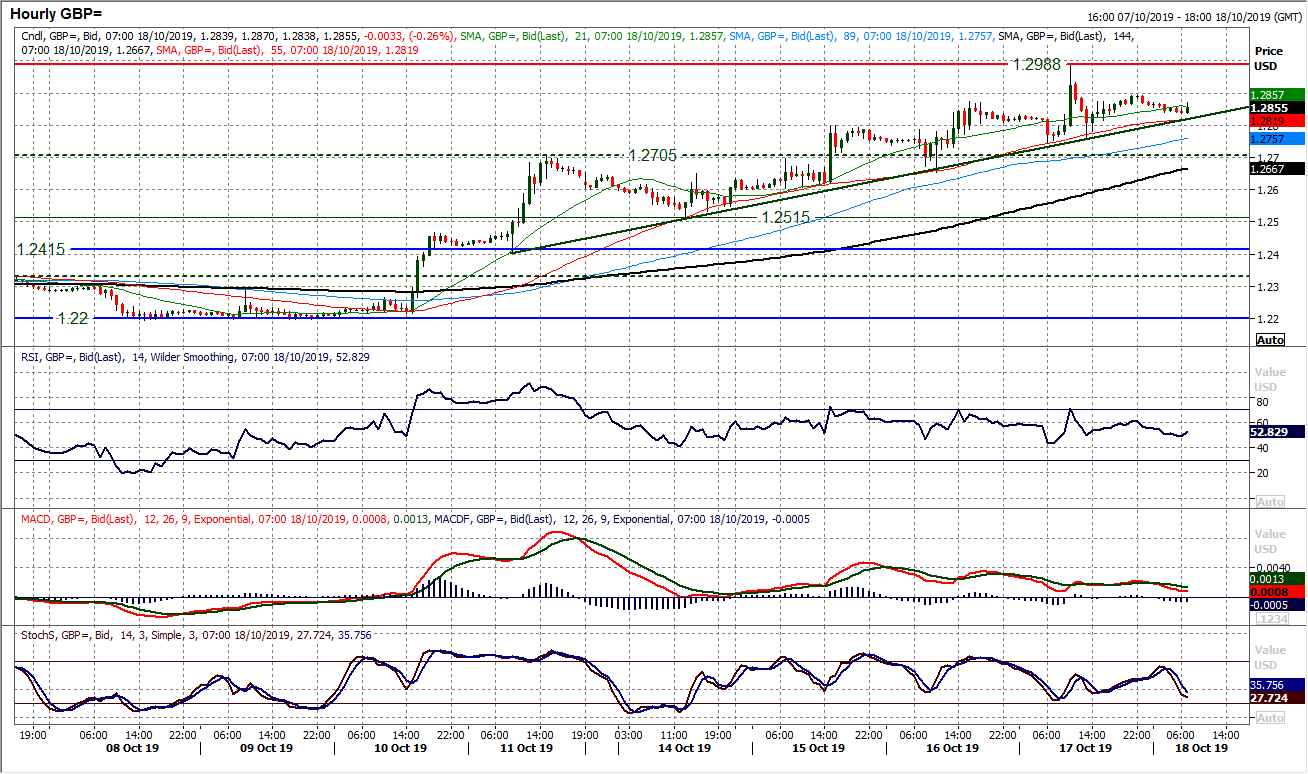
It has been extremely difficult to consider a technical outlook for a market that is running on pure newsflow in recent days. Cable has been choppy, but intraday weakness has repeatedly been bought into as progress has been made this week. However, with a deal now achieved on an EU level, there may be little good news to prevent Cable slipping back today (the UK Parliament arithmetic does not look great for passing a deal on Saturday). For now the technicals (for what they are worth) remain positive. The hourly chart is intriguing too, with the market repeatedly supported by both a rising 55 hour moving average and a five day uptrend. The support of a higher low at $1.2750 will give an indication of where the market is at. Failure of this low would suggest the market is losing hope of securing a deal. The high of $1.2988 is resistance now, with a mini lower high at $1.2890. The volatile ride is not over yet and the biggest move (highly likely to be a significant gap) will be on Monday morning (Sunday night depending on where traders reside).
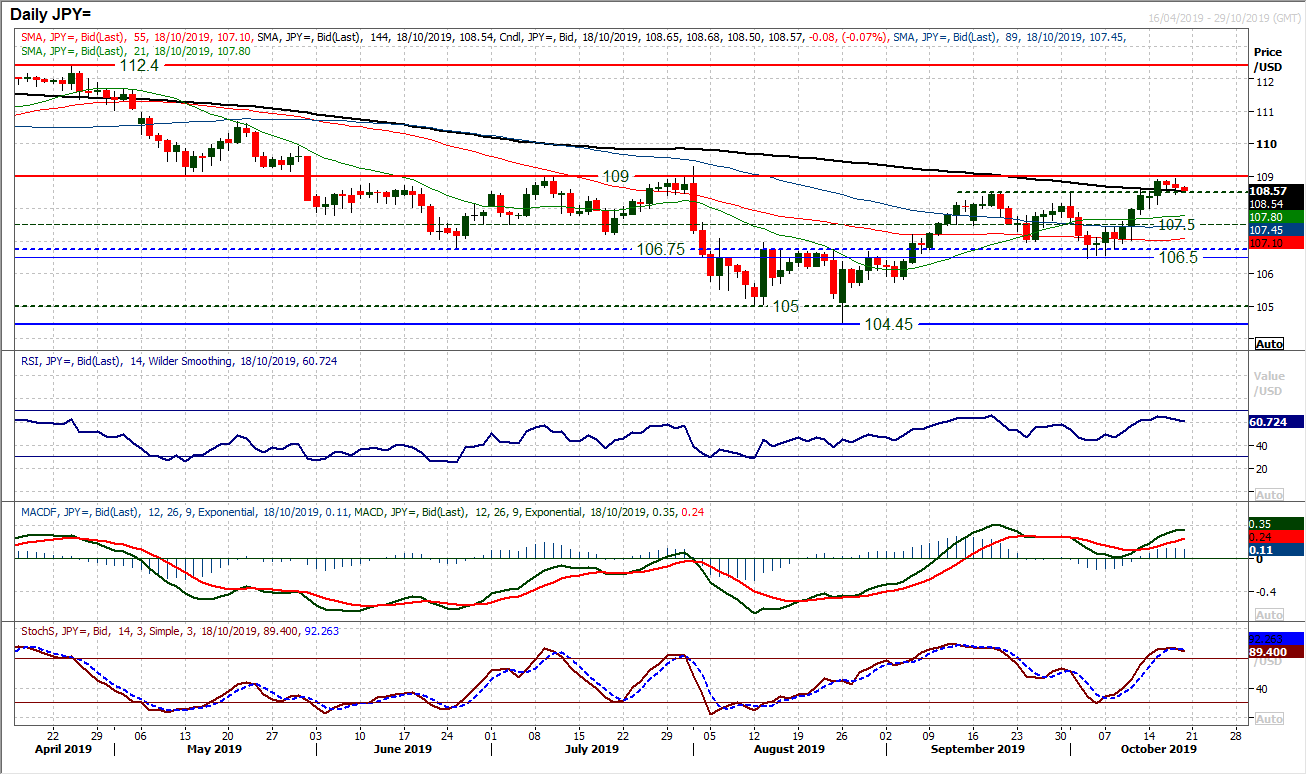
Finally the signs of dollar weakening are spreading to Dollar/Yen. Yesterday we were arguing the importance of the resistance around 109.00 was considerable and that momentum (given the dollar underperformance across majors) may struggle. A second negative candle in two days begins to question the positive outlook on USD/JPY nw. With the market also breaking the support of Wednesday’s higher low, the impetus of the rally is dissipating. Breakout support between 108.40/108.60 from te hourly chart is an important gauge today, but a move below 108.00 would be a confirmation that the bulls had lost control. Already there are signs of the Stochastics and RSI rolling over. A move back under 108.00 opens 107.50 and the September/October support 106.50/106.95 comes back into play. There is dwindling expectation that a closing breakout above 109.00 will be achieved (at least on this bull leg).
Gold
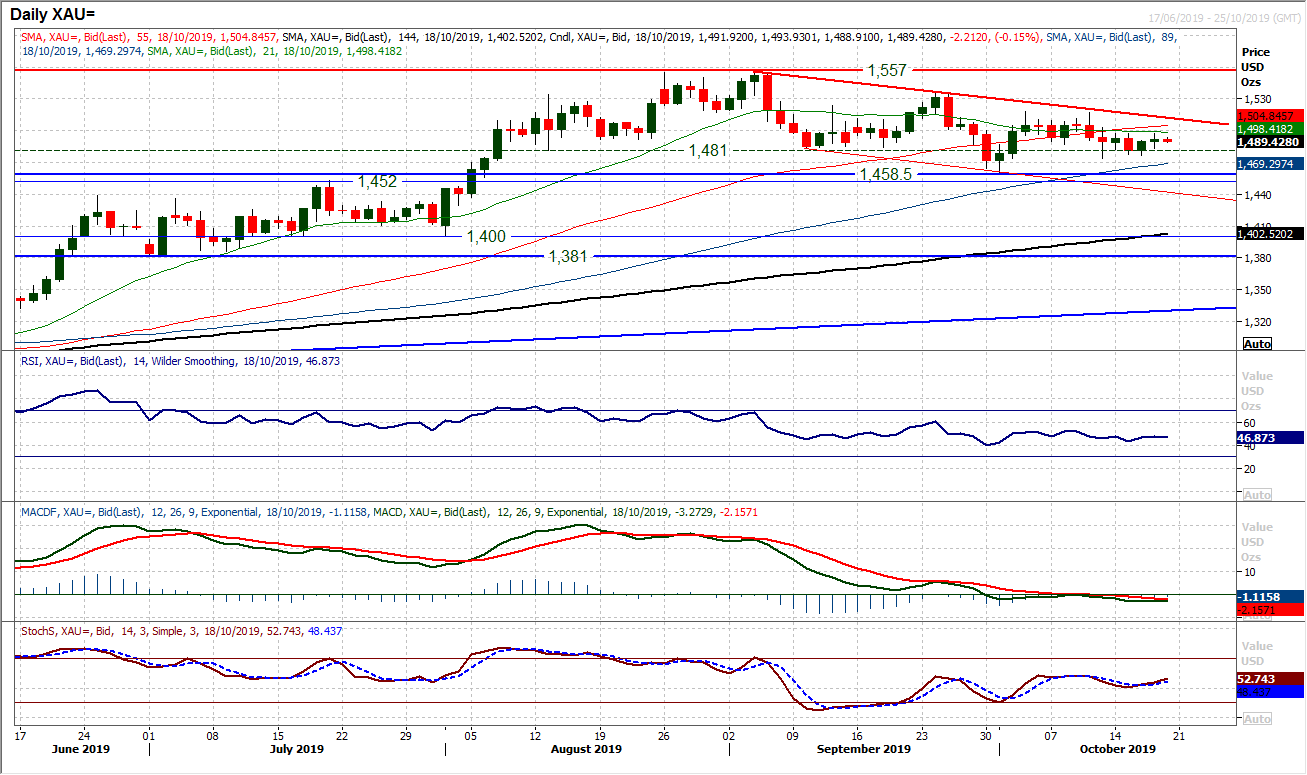
The outlook for gold remains one of uncertainty. Even the very mild negative drift that has been a feature of recent moves has just stalled again in the past couple of sessions. A positive candle on Wednesday was followed by consolidation yesterday and this has continued into today. With momentum indicators now almost entirely devoid of direction, the outlook for gold is incredibly clouded now. Taking a step back though, there is a downtrend of the past six weeks and the market is trading under $1497/$1500 near term resistance. This does leave a slight negative bias still the preferred strategy. However, there is very little conviction in market moves right now. Support at $1474 above the $1458 key low.
WTI Oil
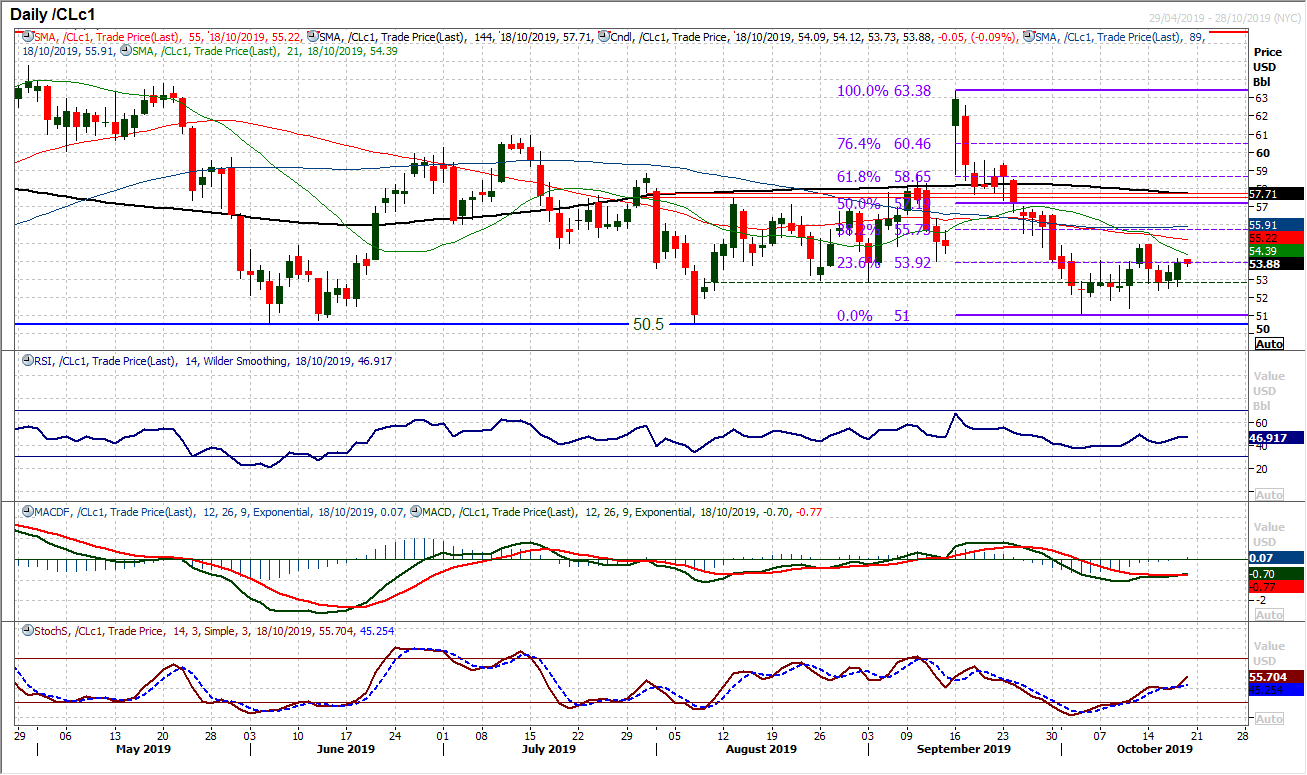
Although WTI ticked higher to leave a bull candle yesterday, there is still little real direction of any conviction in the market right now. There is a mild improvement in the Stochastics, but this is a market still throwing off a range of signals. It means that it is very difficult to take yesterday’s positive candle on trust. This is a market trading between the key support starting at $51.00 and up towards last week’s high of $54.95. The hourly chart shows that yesterday’s run higher has been dragged back overnight to leave initial resistance at $54.15. Hourly momentum also reflects ongoing ranging conditions. Support is forming at $52.80 but the bulls have a lot of work to convince about any sustainable recovery.
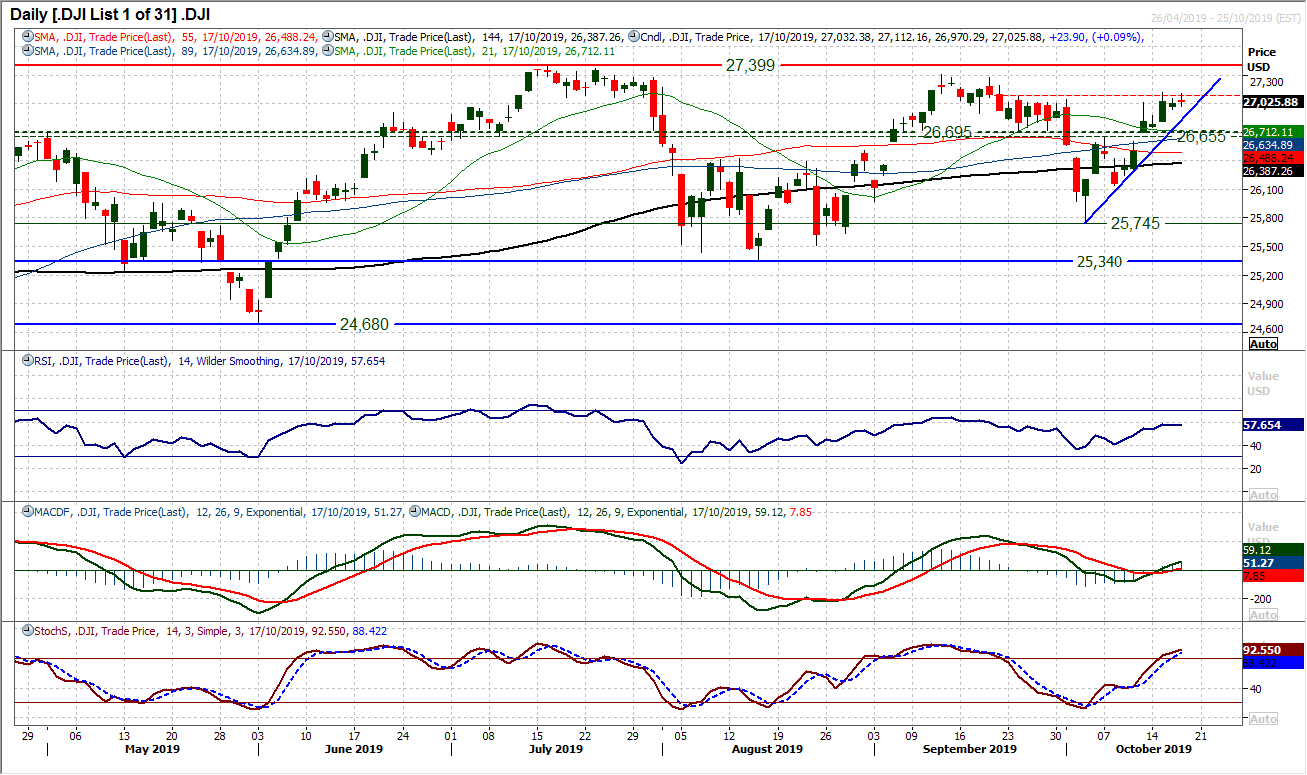
The Dow is just looking a little bit cautious suddenly as the rally has stalled over the past couple of sessions. The resistance band 27,045/27,120 has held up the market for the past week now, but this is still for now just a consolidation within the developing two week uptrend. Momentum indicators are still progressing in a positive configuration with MACD lines rising above neutral (just) and Stochastics above 80. However the RSI is getting a little stuck in the high 50s and the market now needs to push through this resistance band 27,045/27,120 otherwise this rally will become a little stale. Futures are again a shade lighter today, so there is no imminent breakout, however, we remain positive on the Dow whilst the market trades above the 26,655/26,695 multi-week pivot. A close above 27,120 opens the all-time highs again at 27,399. The near term uptrend comes in to support the market at 26,940 today. The hourly chart suggests that this is just a pause in the run higher and the bulls are still in control to buy into weakness.
"""DISCLAIMER: This report does not constitute personal investment advice, nor does it take into account the individual financial circumstances or objectives of the clients who receive it. All information and research produced by Hantec Markets is intended to be general in nature; it does not constitute a recommendation or offer for the purchase or sale of any financial instrument, nor should it be construed as such.
All of the views or suggestions within this report are those solely and exclusively of the author, and accurately reflect his personal views about any and all of the subject instruments and are presented to the best of the author’s knowledge. Any person relying on this report to undertake trading does so entirely at his/her own risk and Hantec Markets does not accept any liability. """
