
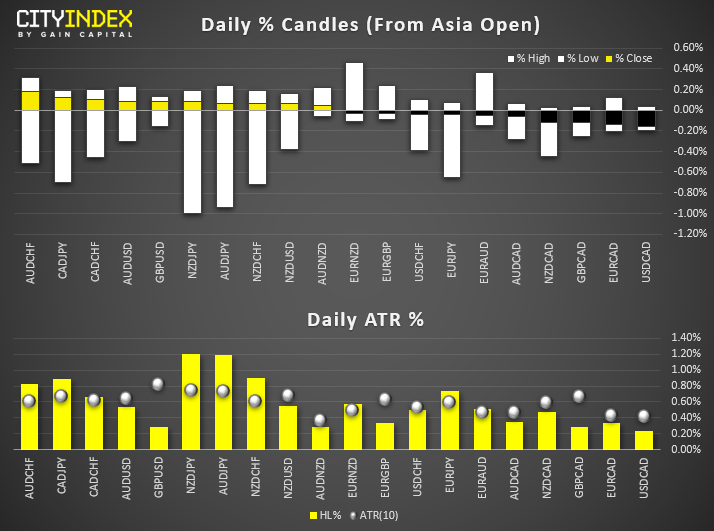
FX Brief:
Price Action:
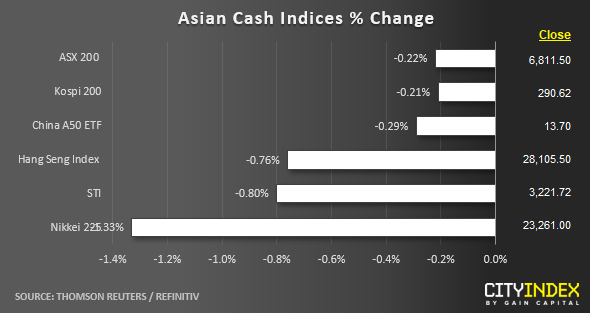
Equities Brief:
Price Acton (derived from CFD indices):
"Disclaimer: The information and opinions in this report are for general information use only and are not intended as an offer or solicitation with respect to the purchase or sale of any currency or CFD contract. All opinions and information contained in this report are subject to change without notice. This report has been prepared without regard to the specific investment objectives, financial situation and needs of any particular recipient.
Any references to historical price movements or levels is informational based on our analysis and we do not represent or warrant that any such movements or levels are likely to reoccur in the future. While the information contained herein was obtained from sources believed to be reliable, the author does not guarantee its accuracy or completeness, nor does the author assume any liability for any direct, indirect or consequential loss that may result from the reliance by any person upon any such information or opinions."