Market Overview
Market Overview
Markets can shift in sentiment very quickly. What had looked to be a growing sense of optimism surrounding the trade dispute is now being scaled back. Not only are the two sides at loggerheads over tariff roll-back, but also Congressional legislation concerning Hong Kong has hit the ability of an amicable agreement. In an act of incredible timing, Congress is also now looking to take a further jab at China with a potential bill that would scrutinise China’s internal human rights. The prospects of a “phase one” agreement seem to be dissipating now. It is arguably an admirable stance for Congress to be taking, but it certainly threatens any improvement in relations between the two countries.
The impact of the trade dispute was also laid out in the ISM Manufacturing data yesterday as the PMI suggested a move into deeper contraction for the sector.
The services sector data is more meaningful for the economy as a whole, but traders will now question the spillover into the consumer were “phase one” to hit the rocks. For markets this morning, the dollar bulls have dragged themselves to their feet after yesterday’s knockdown, however, it may take a look at the ISM Non-manufacturing data tomorrow before we see whether a decisive shift has set in.
The Reserve Bank of Australia sat on its hands in its monetary policy decision today (no change expected at +0.75%) opting for more of a wait and see approach. However, with the Australian Current Account surplus at +A$7.9bn in Q3 (+A$6.3bn exp, +A$5.9bn in Q2) there has been a decent move higher for the Aussie this morning.
On Wall Street there was a decisive turn lower with the S&P 500 -0.9% at 3114. However, there is a degree of stabilisation with a tick back higher on US futures today +0.2%. This is helping to pull a more mixed outlook on Asian markets than may have been anticipated, with the Nikkei -0.6% and Shanghai Composite +0.3%. European markets are cautiously positive in early moves with FTSE 100 Futures+0.2% and DAX Futures +0.4%.
In forex, there is a mild recovery in risk appetite, whilst USD is also looking to find its feet again after being significantly shaken yesterday. The big movers are AUD and NZD with decent outperformance, whilst JPY is slipping back again. In commodities, this improved risk element is seeing mixed moves on gold (around the flat line), whilst oil is a shade higher as traders begin to look towards this week’s OPEC meeting.
In a hectic week of data, Tuesday’s economic calendar is somewhat light of market moving announcements. The UK Construction PMI is at 09:30 GMT and is expected to improve marginally to 44.5 (from 44.2) which is still deeply contractionary but accounts for only around 7% of the UK economy.
Chart of the Day – USD/NZD
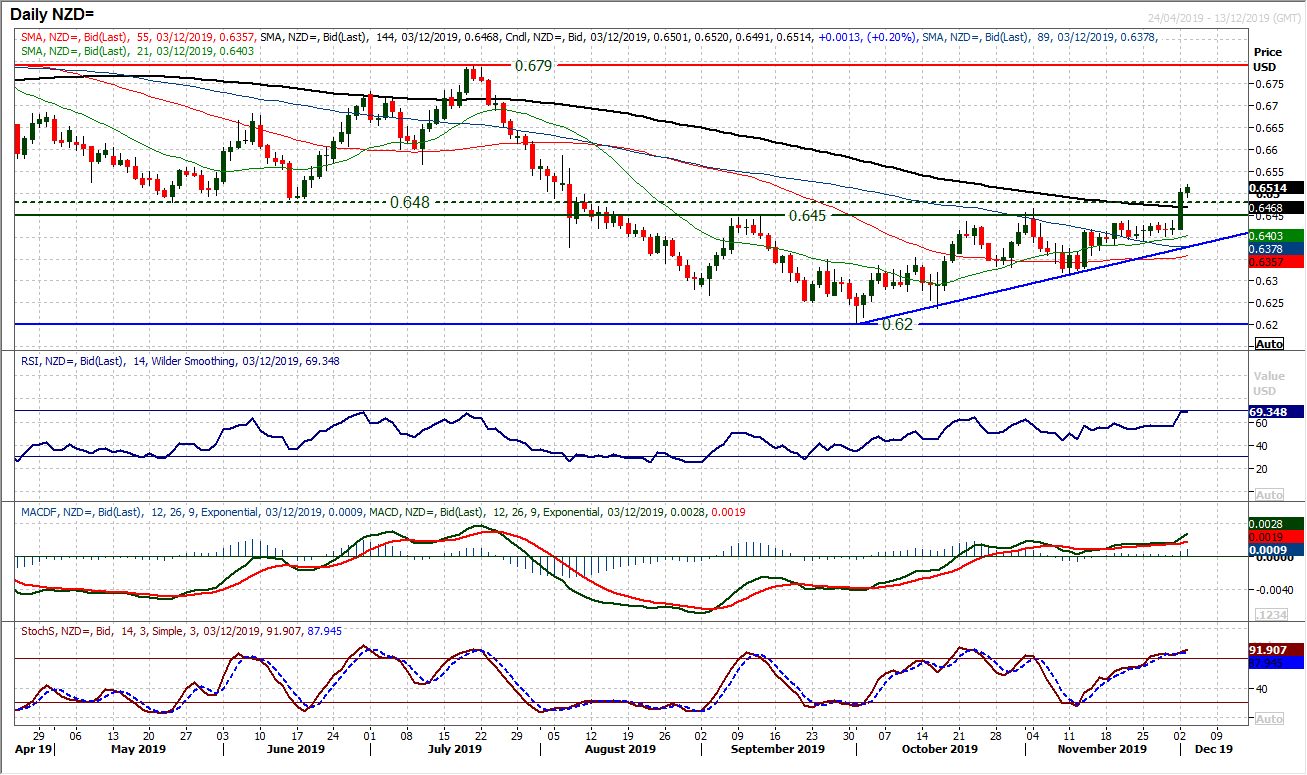
We have been talking about a relative strong outperformance of the Kiwi in recent sessions. However, this was taken to a whole new level with a huge breakout yesterday on a decisive bull candle. The resistance at $0.6450/$0.6480 has been a key pivot area over recent months, but with the Kiwi performance and momentum improving in recent weeks, the bulls have been holding the Kiwi up well. With risk appetite strengthening and then the dollar hit by weaker ISM data, the Kiwi has broken the shackles. RSI confirms the breakout at multi-month highs in the high 60s, whilst MACD and Stochastics are also strongly configured. It now means that the breakout pivot $0.6450/$0.6480 is now a basis of support. The hourly chart is overbought near term but any move that looks to unwind back towards 0.6835/$0.6865 (November resistance) which is now supportive should be seen as an opportunity. The overnight low is $0.6490. Effectively a two day closing breakout above 0.6450 confirms a three month base pattern and opens for a bigger recovery and +250 pips of further recovery in the coming months. Next resistance is $0.6565/$.0.6585.
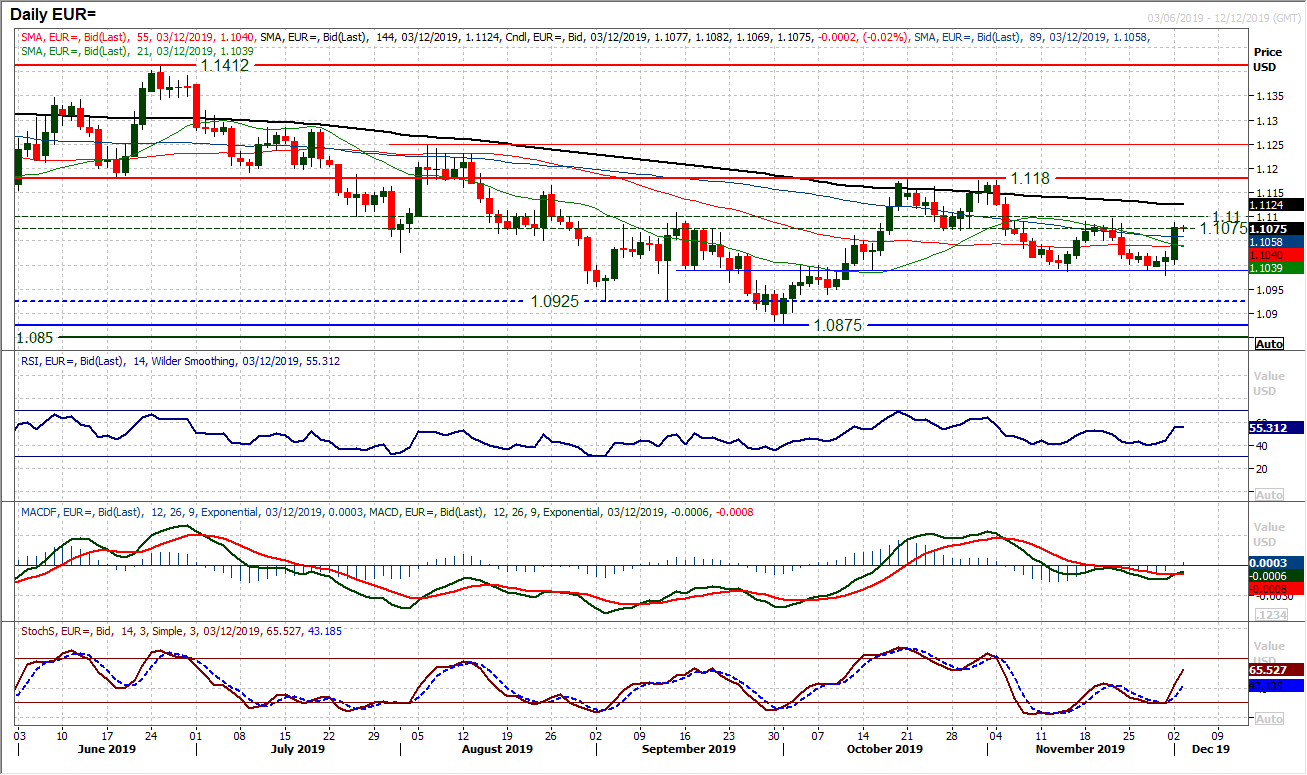
The dollar has come under big corrective pressure in the wake of the disappointing ISM manufacturing data. We have been focusing a lot on the $1.0990/$1.1000 support area recently, which has come under considerable scrutiny. However, a decisive positive candle was the biggest one day upside move since mid-September. Taking the market back into the medium term pivot band $1.1075/$1.1100 this now neutralizes the corrective outlook again. Momentum indicators have reacted, with the MACD lines just crossing slightly higher, whilst Stochastics and RSI have swung higher into neutral areas again. We see this zone of around 25 pips between $1.1075/$1.1100 as being neutral now between the growing support at $1.0990/$1.1000 and resistance at $1.1180. Closing higher through $1.1100 would suggest the bulls taking on the momentum of yesterday’s move for a test of $1.1180. However, it is interesting to see that the overnight move has been one of consolidation with a lack of follow through. Can this knee jerk move out of the dollar start a trend? We believe that EUR/USD will remain choppy rangebound for the time being.
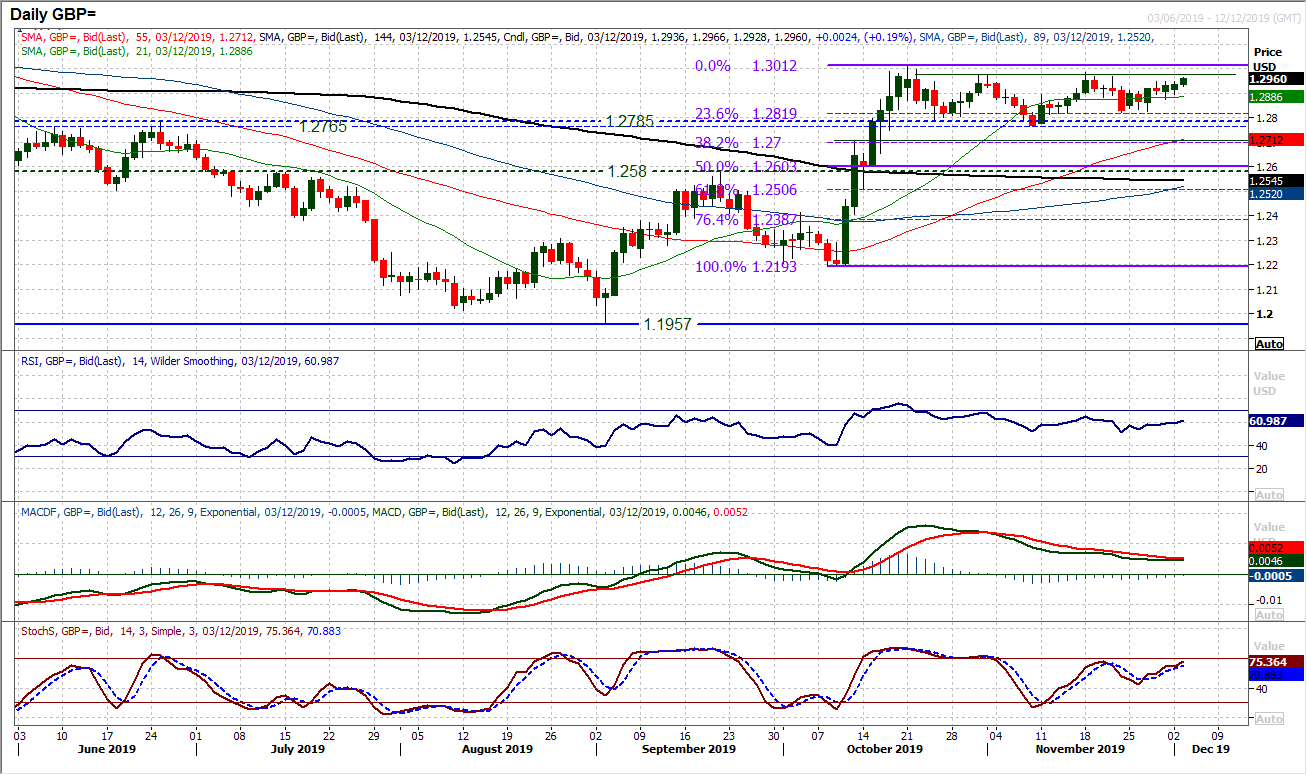
The dollar got hit hard across the major pairs yesterday, with one main exception, on Cable. A 55 pip daily range with only a marginal gain on the day just shows how the dollar is not the primary concern for traders. The UK election is far more of a concern right now, and with the polls tightening, chasing Cable higher is seen as a bit of a risky game. We expect to see the c.250 pip band between $1.2765/$1.3010 to continue until the election (on 12th December), with rallies towards the range highs $1.2975/$1.3010 fading. There is an ongoing medium term positive bias (with the near term unwind on momentum seemingly having played out). It is interesting to see on the hourly chart that whilst an edge higher was seen yesterday, the momentum indicators point to an ongoing range trade. The hourly RSI continues to oscillate between 35/65 whilst MACD lines fluctuate around neutral. $1.2950 is initial resistance, with $1.2880 supportive above $1.2820 which is a more considerable floor around the lows of the range. With significant uncertainty surrounding the identity of the next government in the UK, expect this range to continue.
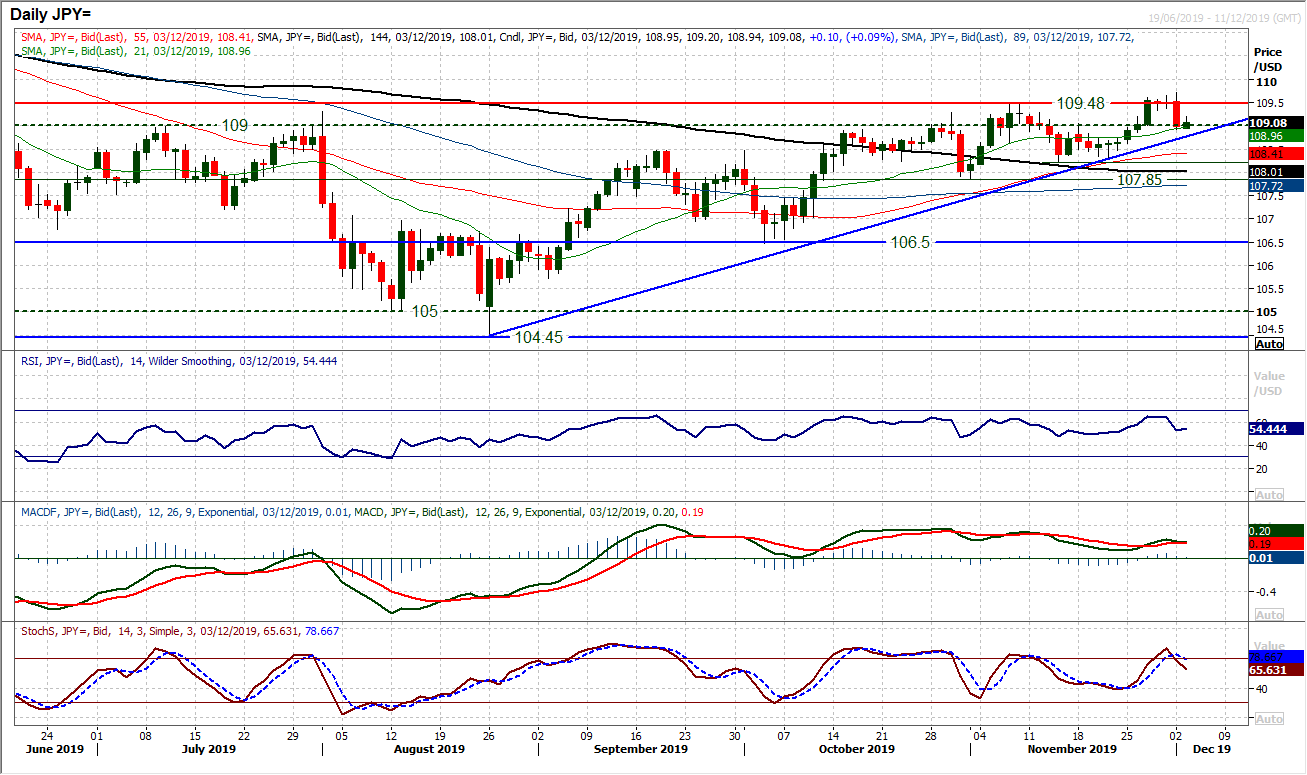
How the bulls react today could be a really significant moment for Dollar/Yen. Until the ISM Manufacturing data yesterday, there was a move to hold on to the breakout above 109.50. Has yesterday’s subsequent corrective candle changed the outlook? A bearish engulfing candle needs a bull reaction to settle the nerves. We believe that Dollar/Yen will be continuing higher in the coming weeks, but that weakness is a chance to buy. Yesterday’s move lower was a warning shot, but no significant technical damage to the bull case yet. However, the RSI needs to hold above 45/50, and Stochastics also hold up. A bull candle holding above 109.00 would be important today as the last time (in early November) that a breakout above 109.00 failed, there was a deeper correction in the coming days. The uptrend is at 108.75 today and 108.25 is a key higher low. A close back above 109.50 would confirm the bulls back in the driving seat.
Gold
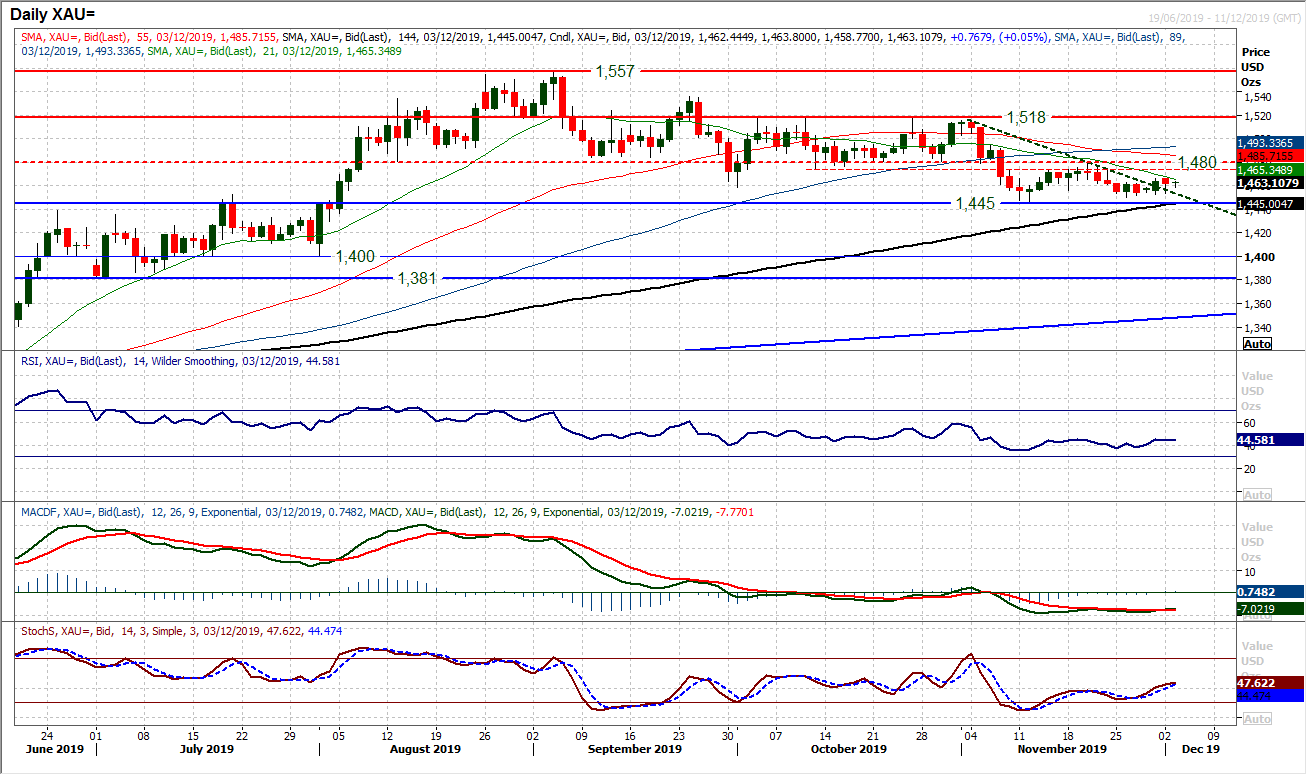
The selling pressure through the US dollar into yesterday afternoon allowed gold to claw back much of the earlier lost ground. It turned what looked to be a renewed corrective session into a move which now just further clouds the outlook for gold. In recent sessions, we have been considering the reaction of traders as they returned from Thanksgiving. The fact that support at $1450 continues to build and $1445 has not been tested for three weeks, suggests that the selling pressure just cannot build momentum right now. The key will now be how far the bulls can take a recovery. The resistance around $1480 which houses a large batch of overhead supply from August through to October will be a crucial factor in how the near to medium term outlook develops. There is still a corrective configuration on momentum indicators with the RSI and Stochastics still below their neutral lines, but they are now beginning to pick up again. Previously, in recent months, the bulls have faltered in a recovery and rallies have been sold into. Already we see that could be again happening, as the market just begins to drop back again. We retain our negative bias and still believe that rallies will fade. It is just that the selling pressure is also inadequate right now to drive a breakdown.
WTI Oil
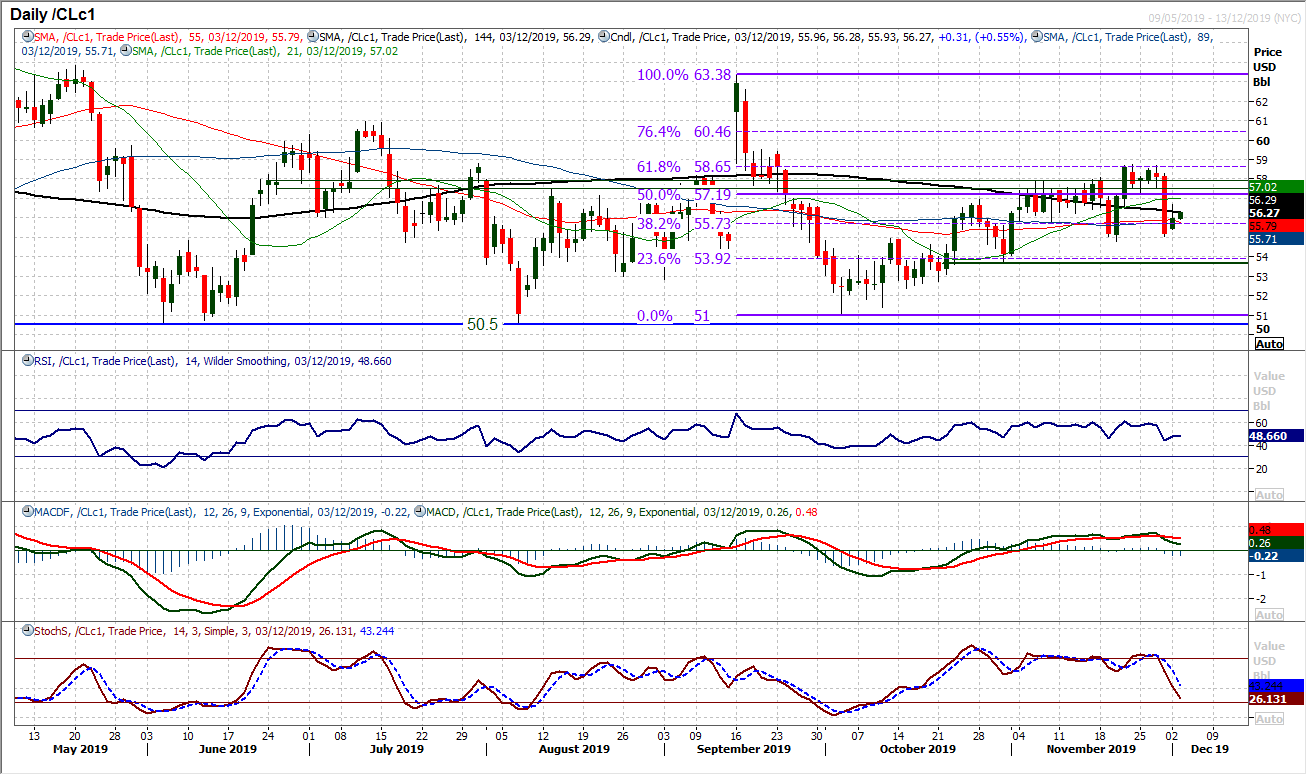
In the wake of Friday’s sharp sell-off of over -4%, the bulls will have been looking for a decisive and solid reaction. There was a close higher, but the bulls lost much of their good work into the close. The result was a tentative retracement candle. Holding to the support of Friday’s low at $55.00 was important (as it maintains the higher low at $54.75) but there is a deterioration on momentum indicators now which questions whether the bulls have already played out this recovery. RSI has oscillated between the low 40s and 60 for the last six weeks, whilst MACD and Stochastics have now rolled over. The momentum of the bulls run is really being lost now, with a more ranging look to oil. The hourly chart shows resistance around $57.30 as a pivot and failure to reclaim this would add to the growing sense of consolidation now.
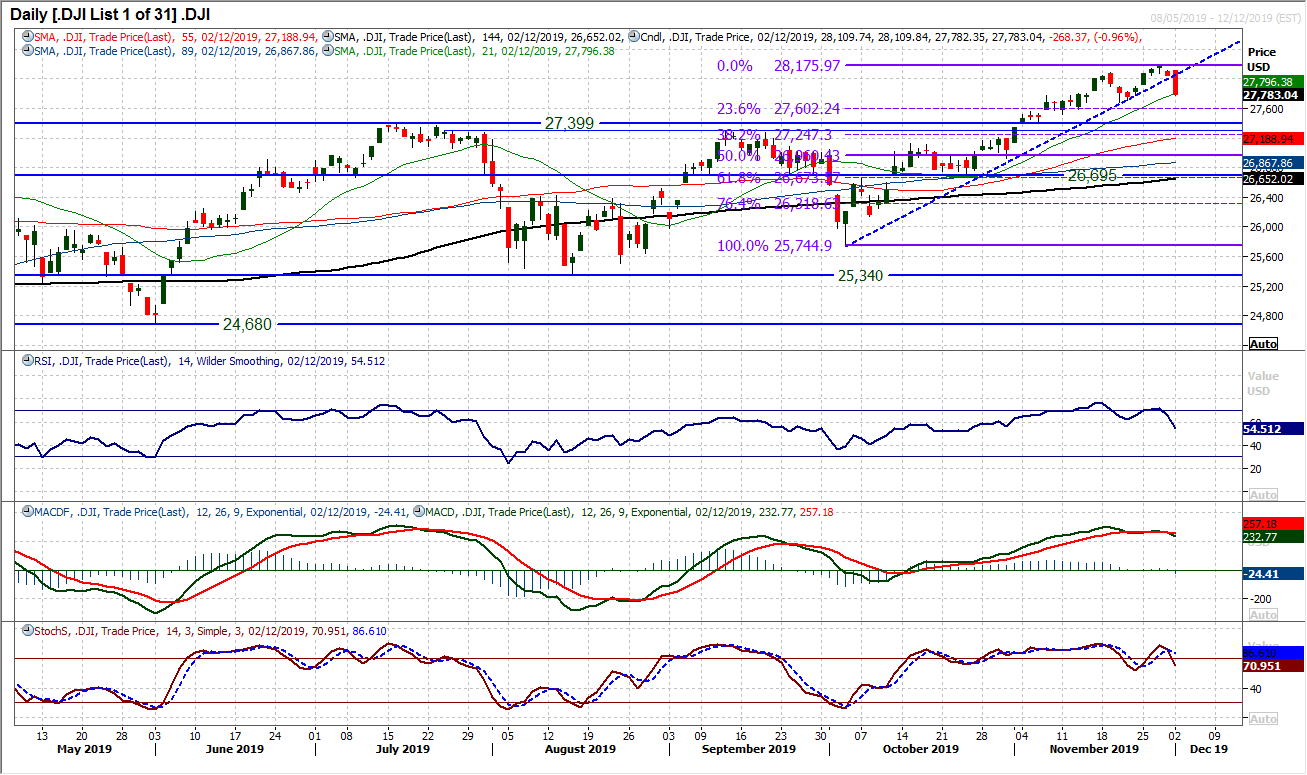
So apparently the Dow can also go down. After weeks of trending higher where any weakness was limited to just minor losses, the Dow has posted a -1% decline in a move that now threatens a corrective leg. The uptrend of two months has been decisively broken and we are now seeing near term negative signals forming across momentum indicators. The RSI now has a bearish divergence, whilst MACD lines and Stochastics are crossing lower (although the latter two are not showing confirmed sell signals yet). This is now a key moment. The support at 27,675 was a higher low from a couple of weeks ago. If this is breached it would confirm a building corrective move. There is key support with the old medium to longer term breakout at 27,310/27,399 which could now be an unwind target. This would also be around the 38.2% Fibonacci retracement (of the bull run of 25,745/28,175) around 27,250. The all-time high of 28,175 is now key resistance.
"""DISCLAIMER: This report does not constitute personal investment advice, nor does it take into account the individual financial circumstances or objectives of the clients who receive it. All information and research produced by Hantec Markets is intended to be general in nature; it does not constitute a recommendation or offer for the purchase or sale of any financial instrument, nor should it be construed as such.
All of the views or suggestions within this report are those solely and exclusively of the author, and accurately reflect his personal views about any and all of the subject instruments and are presented to the best of the author’s knowledge. Any person relying on this report to undertake trading does so entirely at his/her own risk and Hantec Markets does not accept any liability. """
Markets can shift in sentiment very quickly. What had looked to be a growing sense of optimism surrounding the trade dispute is now being scaled back. Not only are the two sides at loggerheads over tariff roll-back, but also Congressional legislation concerning Hong Kong has hit the ability of an amicable agreement. In an act of incredible timing, Congress is also now looking to take a further jab at China with a potential bill that would scrutinise China’s internal human rights. The prospects of a “phase one” agreement seem to be dissipating now. It is arguably an admirable stance for Congress to be taking, but it certainly threatens any improvement in relations between the two countries.
The impact of the trade dispute was also laid out in the ISM Manufacturing data yesterday as the PMI suggested a move into deeper contraction for the sector.
The services sector data is more meaningful for the economy as a whole, but traders will now question the spillover into the consumer were “phase one” to hit the rocks. For markets this morning, the dollar bulls have dragged themselves to their feet after yesterday’s knockdown, however, it may take a look at the ISM Non-manufacturing data tomorrow before we see whether a decisive shift has set in.
The Reserve Bank of Australia sat on its hands in its monetary policy decision today (no change expected at +0.75%) opting for more of a wait and see approach. However, with the Australian Current Account surplus at +A$7.9bn in Q3 (+A$6.3bn exp, +A$5.9bn in Q2) there has been a decent move higher for the Aussie this morning.
On Wall Street there was a decisive turn lower with the S&P 500 -0.9% at 3114. However, there is a degree of stabilisation with a tick back higher on US futures today +0.2%. This is helping to pull a more mixed outlook on Asian markets than may have been anticipated, with the Nikkei -0.6% and Shanghai Composite +0.3%. European markets are cautiously positive in early moves with FTSE 100 Futures+0.2% and DAX Futures +0.4%.
In forex, there is a mild recovery in risk appetite, whilst USD is also looking to find its feet again after being significantly shaken yesterday. The big movers are AUD and NZD with decent outperformance, whilst JPY is slipping back again. In commodities, this improved risk element is seeing mixed moves on gold (around the flat line), whilst oil is a shade higher as traders begin to look towards this week’s OPEC meeting.
In a hectic week of data, Tuesday’s economic calendar is somewhat light of market moving announcements. The UK Construction PMI is at 09:30 GMT and is expected to improve marginally to 44.5 (from 44.2) which is still deeply contractionary but accounts for only around 7% of the UK economy.
Chart of the Day – USD/NZD
We have been talking about a relative strong outperformance of the Kiwi in recent sessions. However, this was taken to a whole new level with a huge breakout yesterday on a decisive bull candle. The resistance at $0.6450/$0.6480 has been a key pivot area over recent months, but with the Kiwi performance and momentum improving in recent weeks, the bulls have been holding the Kiwi up well. With risk appetite strengthening and then the dollar hit by weaker ISM data, the Kiwi has broken the shackles. RSI confirms the breakout at multi-month highs in the high 60s, whilst MACD and Stochastics are also strongly configured. It now means that the breakout pivot $0.6450/$0.6480 is now a basis of support. The hourly chart is overbought near term but any move that looks to unwind back towards 0.6835/$0.6865 (November resistance) which is now supportive should be seen as an opportunity. The overnight low is $0.6490. Effectively a two day closing breakout above 0.6450 confirms a three month base pattern and opens for a bigger recovery and +250 pips of further recovery in the coming months. Next resistance is $0.6565/$.0.6585.

The dollar has come under big corrective pressure in the wake of the disappointing ISM manufacturing data. We have been focusing a lot on the $1.0990/$1.1000 support area recently, which has come under considerable scrutiny. However, a decisive positive candle was the biggest one day upside move since mid-September. Taking the market back into the medium term pivot band $1.1075/$1.1100 this now neutralizes the corrective outlook again. Momentum indicators have reacted, with the MACD lines just crossing slightly higher, whilst Stochastics and RSI have swung higher into neutral areas again. We see this zone of around 25 pips between $1.1075/$1.1100 as being neutral now between the growing support at $1.0990/$1.1000 and resistance at $1.1180. Closing higher through $1.1100 would suggest the bulls taking on the momentum of yesterday’s move for a test of $1.1180. However, it is interesting to see that the overnight move has been one of consolidation with a lack of follow through. Can this knee jerk move out of the dollar start a trend? We believe that EUR/USD will remain choppy rangebound for the time being.

The dollar got hit hard across the major pairs yesterday, with one main exception, on Cable. A 55 pip daily range with only a marginal gain on the day just shows how the dollar is not the primary concern for traders. The UK election is far more of a concern right now, and with the polls tightening, chasing Cable higher is seen as a bit of a risky game. We expect to see the c.250 pip band between $1.2765/$1.3010 to continue until the election (on 12th December), with rallies towards the range highs $1.2975/$1.3010 fading. There is an ongoing medium term positive bias (with the near term unwind on momentum seemingly having played out). It is interesting to see on the hourly chart that whilst an edge higher was seen yesterday, the momentum indicators point to an ongoing range trade. The hourly RSI continues to oscillate between 35/65 whilst MACD lines fluctuate around neutral. $1.2950 is initial resistance, with $1.2880 supportive above $1.2820 which is a more considerable floor around the lows of the range. With significant uncertainty surrounding the identity of the next government in the UK, expect this range to continue.

How the bulls react today could be a really significant moment for Dollar/Yen. Until the ISM Manufacturing data yesterday, there was a move to hold on to the breakout above 109.50. Has yesterday’s subsequent corrective candle changed the outlook? A bearish engulfing candle needs a bull reaction to settle the nerves. We believe that Dollar/Yen will be continuing higher in the coming weeks, but that weakness is a chance to buy. Yesterday’s move lower was a warning shot, but no significant technical damage to the bull case yet. However, the RSI needs to hold above 45/50, and Stochastics also hold up. A bull candle holding above 109.00 would be important today as the last time (in early November) that a breakout above 109.00 failed, there was a deeper correction in the coming days. The uptrend is at 108.75 today and 108.25 is a key higher low. A close back above 109.50 would confirm the bulls back in the driving seat.

Gold
The selling pressure through the US dollar into yesterday afternoon allowed gold to claw back much of the earlier lost ground. It turned what looked to be a renewed corrective session into a move which now just further clouds the outlook for gold. In recent sessions, we have been considering the reaction of traders as they returned from Thanksgiving. The fact that support at $1450 continues to build and $1445 has not been tested for three weeks, suggests that the selling pressure just cannot build momentum right now. The key will now be how far the bulls can take a recovery. The resistance around $1480 which houses a large batch of overhead supply from August through to October will be a crucial factor in how the near to medium term outlook develops. There is still a corrective configuration on momentum indicators with the RSI and Stochastics still below their neutral lines, but they are now beginning to pick up again. Previously, in recent months, the bulls have faltered in a recovery and rallies have been sold into. Already we see that could be again happening, as the market just begins to drop back again. We retain our negative bias and still believe that rallies will fade. It is just that the selling pressure is also inadequate right now to drive a breakdown.

WTI Oil

In the wake of Friday’s sharp sell-off of over -4%, the bulls will have been looking for a decisive and solid reaction. There was a close higher, but the bulls lost much of their good work into the close. The result was a tentative retracement candle. Holding to the support of Friday’s low at $55.00 was important (as it maintains the higher low at $54.75) but there is a deterioration on momentum indicators now which questions whether the bulls have already played out this recovery. RSI has oscillated between the low 40s and 60 for the last six weeks, whilst MACD and Stochastics have now rolled over. The momentum of the bulls run is really being lost now, with a more ranging look to oil. The hourly chart shows resistance around $57.30 as a pivot and failure to reclaim this would add to the growing sense of consolidation now.
So apparently the Dow can also go down. After weeks of trending higher where any weakness was limited to just minor losses, the Dow has posted a -1% decline in a move that now threatens a corrective leg. The uptrend of two months has been decisively broken and we are now seeing near term negative signals forming across momentum indicators. The RSI now has a bearish divergence, whilst MACD lines and Stochastics are crossing lower (although the latter two are not showing confirmed sell signals yet). This is now a key moment. The support at 27,675 was a higher low from a couple of weeks ago. If this is breached it would confirm a building corrective move. There is key support with the old medium to longer term breakout at 27,310/27,399 which could now be an unwind target. This would also be around the 38.2% Fibonacci retracement (of the bull run of 25,745/28,175) around 27,250. The all-time high of 28,175 is now key resistance.

"""DISCLAIMER: This report does not constitute personal investment advice, nor does it take into account the individual financial circumstances or objectives of the clients who receive it. All information and research produced by Hantec Markets is intended to be general in nature; it does not constitute a recommendation or offer for the purchase or sale of any financial instrument, nor should it be construed as such.
All of the views or suggestions within this report are those solely and exclusively of the author, and accurately reflect his personal views about any and all of the subject instruments and are presented to the best of the author’s knowledge. Any person relying on this report to undertake trading does so entirely at his/her own risk and Hantec Markets does not accept any liability. """
