Market Overview
An apparent significant de-escalation in the immediate geopolitical risk has reversed the flow out of safe haven assets again. Iran’s foreign minister is suggesting that its response to the Soleimani killing has been “concluded”. US President Trump has also struck very much of a reserved tone too. The hyperbolic threat of World War III has been averted. Both sides can “stand down” with face saving positions. The primary move has been out of Treasuries, gold and the yen; with flow back into the Chinese yuan (at a five month high versus the dollar), US dollar and equities. The intraday swing back lower on oil (more than 10%) reflects how overexcited markets had become by this situation in recent days. The dust is yet to fully settle, however, traders can begin to focus once more on the US/China trade dispute which is still due to see phase one of an agreement being signed next week. Risk appetite has seen a renewed boost this morning and this is reflected through major markets. Equities are stronger, whilst the yen is still underperforming as the slide on gold continues. Chinese inflation underwhelmed slightly overnight , with China CPI remaining at +4.5% (+4.7% exp, +4.5% in November), whilst China PPI improved to -0.5% (-0.4% exp, m-1.4% in November).
Wall Street closed solidly higher with the S&P 500 hitting another all-time as it rallied +0.5% at 3253. US futures are a further +0.3% higher today. This has helped strength through Asian markets with the Nikkei +2.3% and Shanghai Composite +0.9%. European indices show FTSE futures +0.5% and DAX futures +0.9%. In forex, as traders begin to look past geopolitical factors, there is a settling down of the recent USD strength today with JPY underperformance continuing, AUD finding support along with EUR and GBP. In commodities the action still seems to be with gold which is another -$10 lower, whilst oil seems to be settling down after the huge volatility of yesterday’s session.
Eurozone Unemployment for November is the main data announcement for the economic calendar in the European morning, at 1000GMT. Forecasts expect no change to the 7.5% in October. US Weekly Jobless Claims at 1330GMT are expected to remain around recent levels at 220,000 (222,000 last week).
There are several central bank speakers on the agenda today. The Bank of England’s Governor Carney speaks at 0930GMT, which will be interesting being the first communication of the year. Of the Fed speakers, vice-chair Richard Clarida speaks at 1300GMT (permanent voter, mild dove). Neel Kashkari (voter, dovish) is at 1430GMT, whilst John Williams (NYSE:WMB) (voter, centrist) is at 1630GMT.
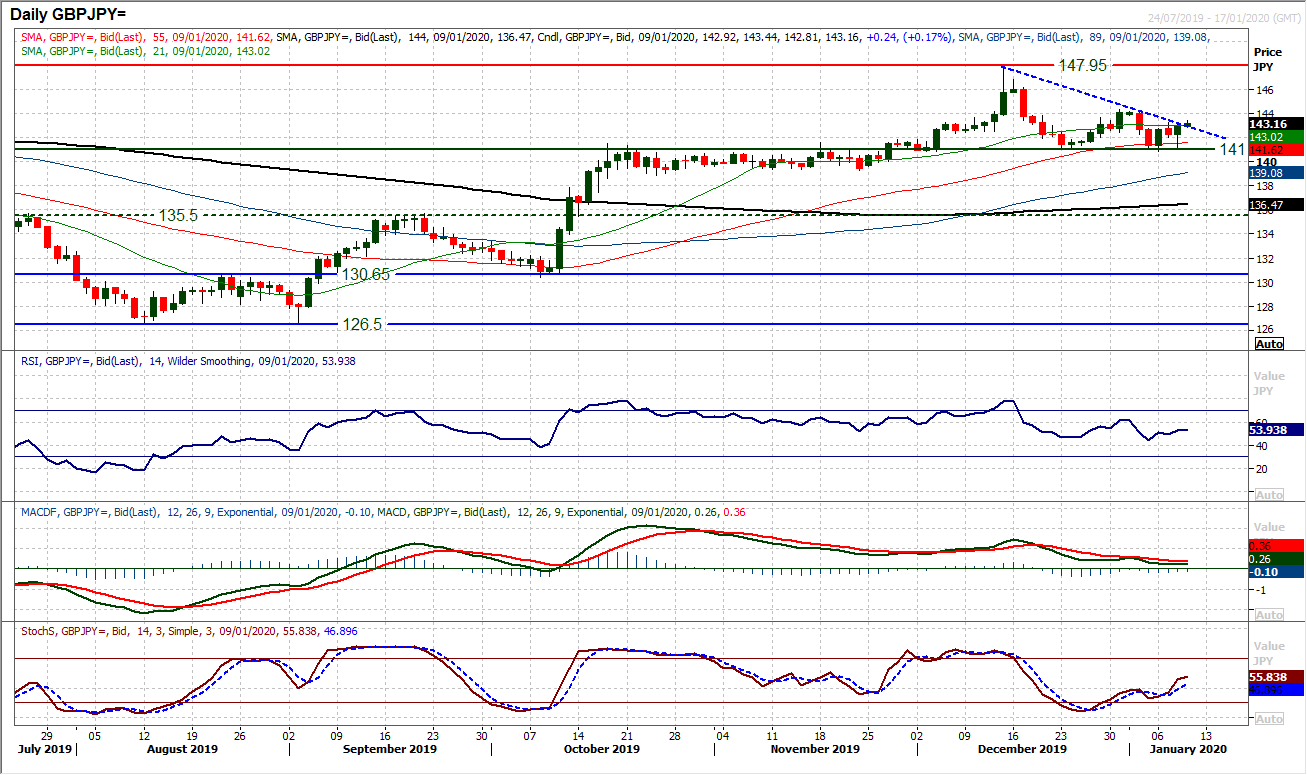
Chart of the Day – GBP/JPY
In recent sessions there has been a growing sense of traders losing faith in the yen. This mood strengthened yesterday afternoon and has driven a rebound on Sterling/Yen and ar arguable bull hammer candlestick. What makes this move interesting is that it once more bolsters the breakout (and now pivot support) at 141.00. The correction back from the mid-December high of 147.95 has built a corrective downtrend, but with yesterday’s bounce continuing into today’s early move higher, this trend is being breached. A closing break above 143.30 resistance wold confirm the downtrend broken (today around 142.90) but also a move above Tuesday’s high. This comes with improving momentum too. A positive recovery formation on Stochastics is gaining impetus, whilst the RSI and MACD lines have both recently unwound to medium term buying opportunity levels. This could be the chance the bulls have been waiting for. A move above 144.35 would be a near term breakout and suggest recovery traction once more on sterling. A close below 141.00 would be a key breakdown of the bullish argument.
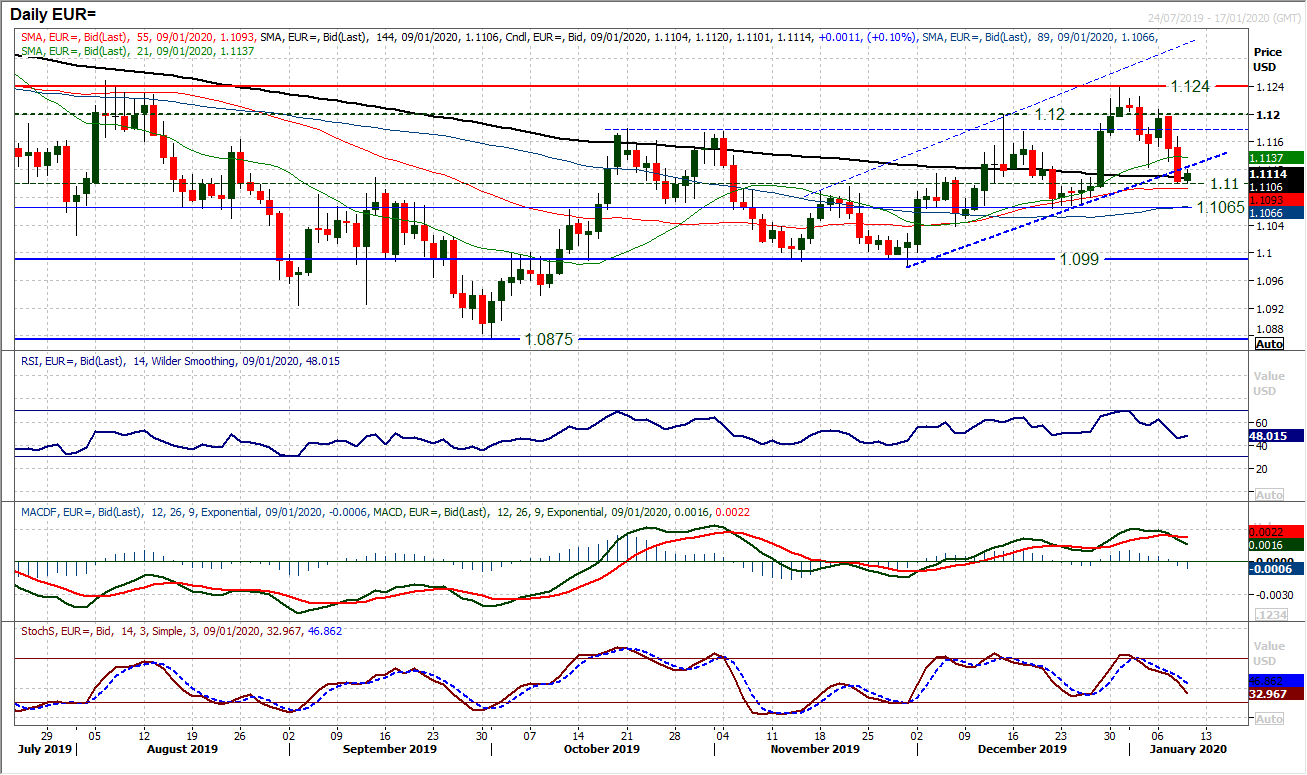
The early trading sessions of 2020 show that the euro bulls are likely to have another tough year ahead. The recovery for the dollar in the past couple of days has pulled EUR/USD back by over -100 pips to break what looked to be an encouraging uptrend channel. We have previously talked at length about the pivot around $1.1100 and once more it is coming into play as a gauge for the market. This is effectively the mid-point of a three month range (between $1.0980/$1.1240) and a move below would begin to leave a more corrective bias once more to the range. An initial pick up from $1.1100 today is encouraging for the bulls, and helps to protect the key higher low at $1.1065. Although the market has broken the five week channel, no explicit technical breakdown (formal support) has been broken. This is why $1.1065 is important. Looking at momentum indicators there is a corrective slip but this is into an important moment. The RSI is falling a shade below 50 and MACD lines have crossed lower as Stochastics decline. Another negative candle today below $1.1100 would be a real suggestion that the bulls have lost control. For now, this is still just holding up around mid-point of the range, but the bulls are under growing pressure. Initial resistance $1.1125/$1.1130.
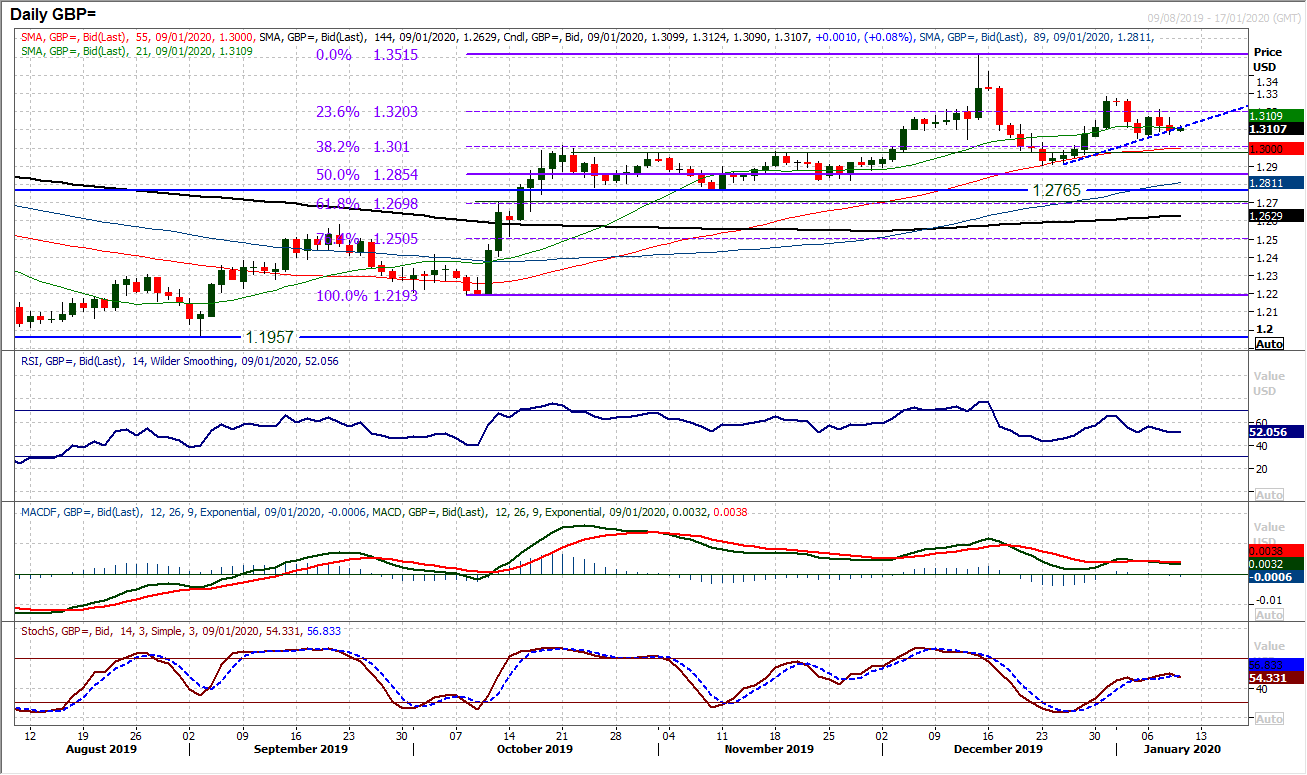
The US dollar has had a strong run in recent days, but it is interesting to see that it has had little real impact on Cable. A very mild negative drift has been seen, but technically this is a very contained move. Momentum indicators are settling a shade above their neutral points and whilst support of this week’s low at $1.3050 holds intact, there is little that is impacting the chart from a negative standpoint. A mild uptrend of the past couple of weeks is creaking this morning and is likely to be broken, however, this is a period of consolidation more than anything. The 23.6% Fibonacci retracement around $1.3200 is a basis of resistance. We are still buyers into weakness on Cable and see the support band $1.2900/$1.3000 as increasingly key on a medium term basis.
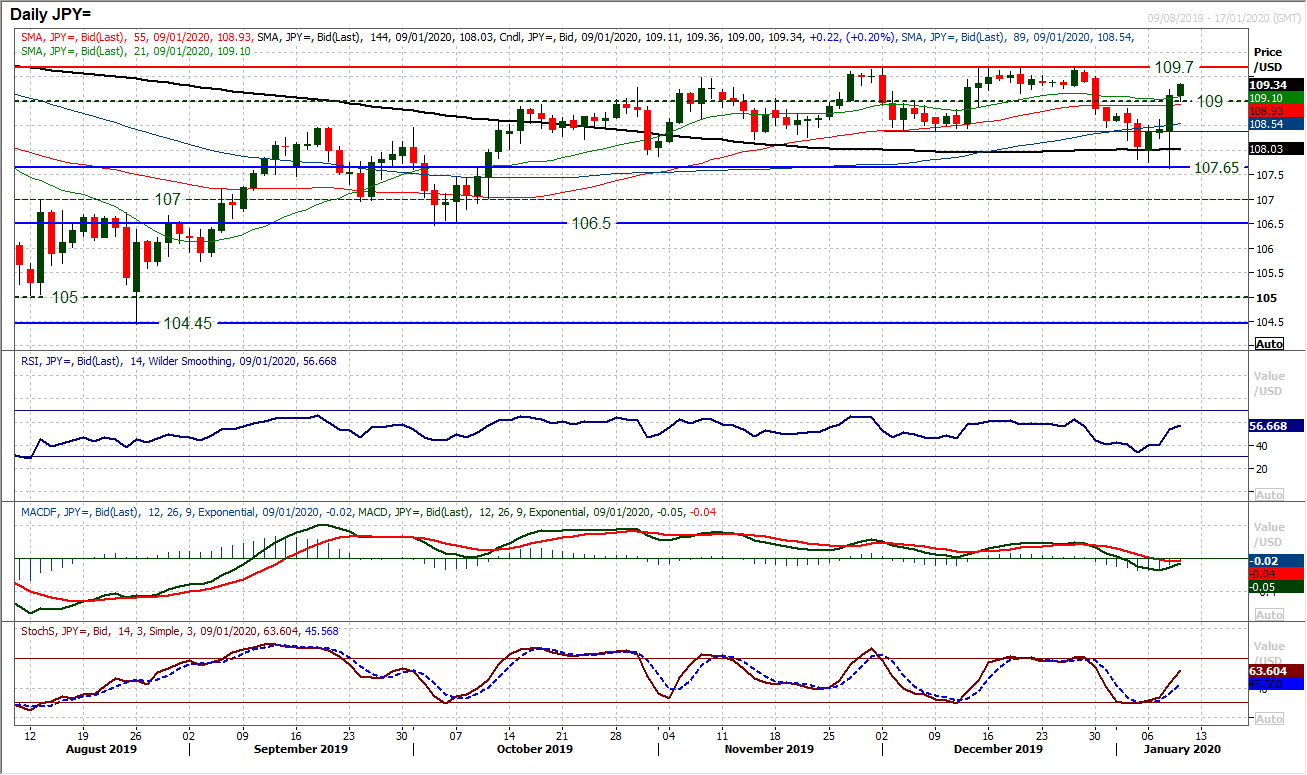
We were discussing recovery potential of Dollar/Yen yesterday morning, but the move really got going as the session developed. A huge intraday rebound from 107.65 not only bolstered what is now a band of key support 107.65/107.85 but also formed a huge bullish engulfing candlestick. With the posting of three positive candles in a row, this suggests that positive momentum is driving the market higher within the three month trading band again. The bulls have also broken the market decisively through 108.85 now (the first lower high of the January correction) and above the old 109.00 pivot. This is a strong indication of a continued move back towards the 109.70 band high will be developing now. Momentum has also shifted, with the Stochastics posting a buy signal (at least one per month for the past three months) which has tended to be the precursor to a move towards the range highs again. A near term support band is between 108.85/109.00.
Gold
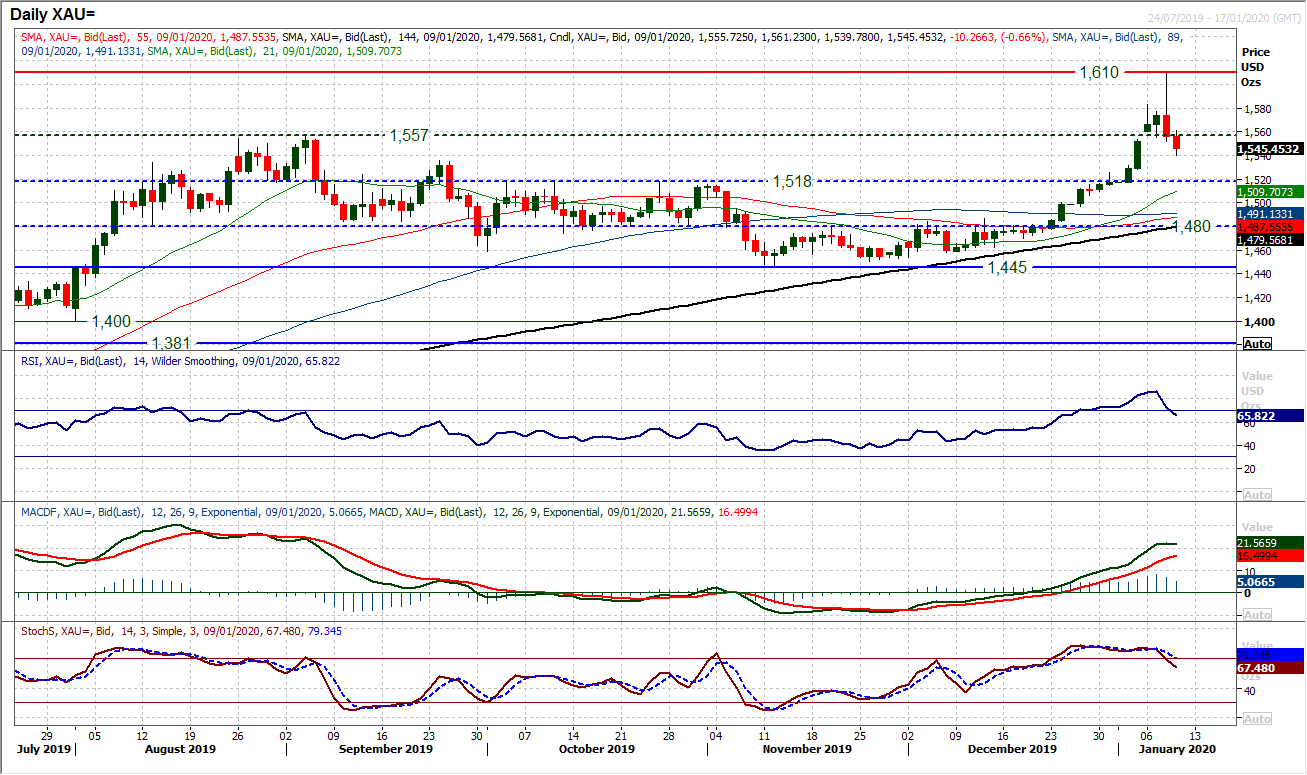
With a huge intraday turnaround the gold bull run is being massively retraced now. Having spiked early yesterday up to $1610, gold retreated over -$50 into the close, but is seemingly not stopping there either. This has left a big shooting star candlestick. Coming at the end of a huge run higher, the corrective potency of this candle will now be a big concern for the bulls. For a couple of days now we have been wary of exhaustion signals that could usher in a correction in gold. We now have then in full view. The gap at $1553 has been filled (but not closed yet) but as we move into the European session today the selling pressure is resuming. This is driving sharp signals on RSI (below 70 is a basic sell signal) and a bear cross on Stochastics. A closing below $1553 today would mean the next corrective targets come in at $1536 and $1518. The bulls need a response and the hourly chart shows resistance now $1553/$1561.
WTI Oil
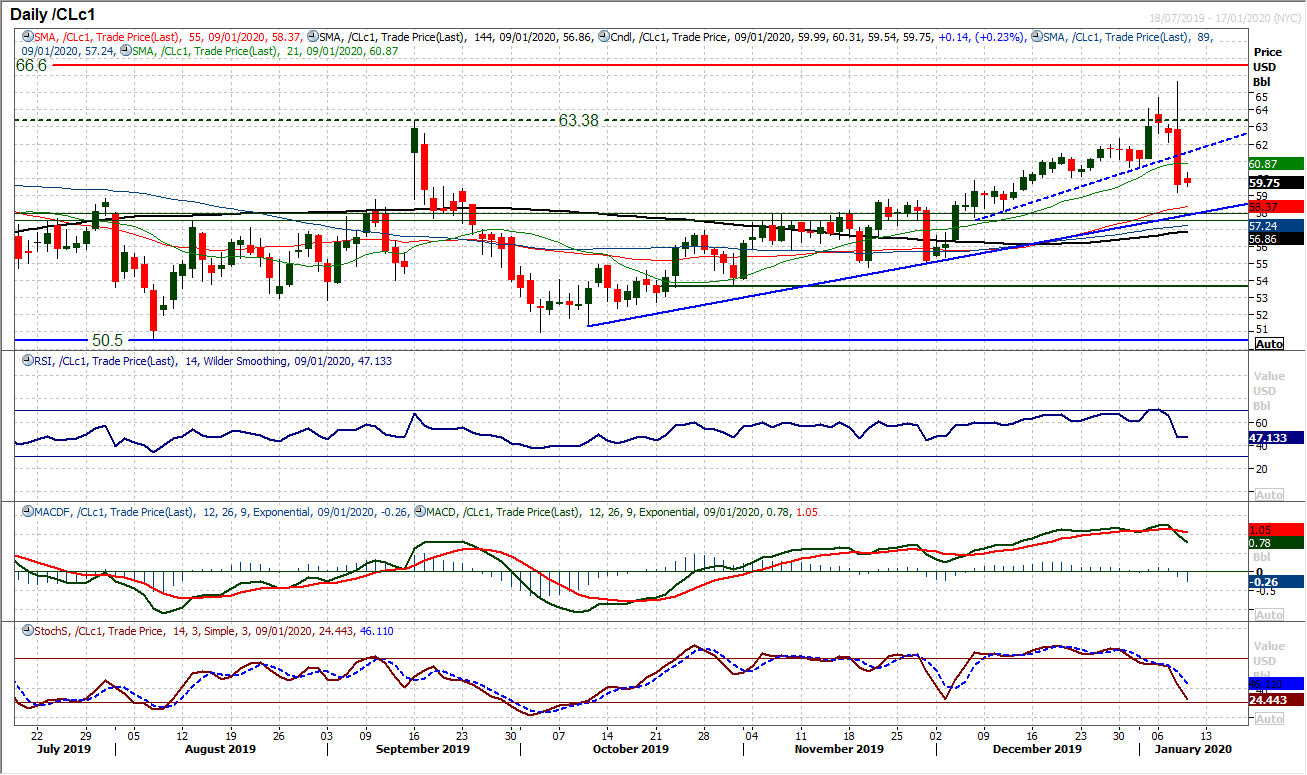
An enormous intraday turnaround with a $6.50 daily range (c. 10% where the Average True Range is c. $1.55) shows what huge volatility is playing out on oil right now. This massive bearish engulfing candle drives the potential for a continued move lower now. A close under $60 now leaves overhead supply $60.00/$60.65 into today’s session, which is already having an impact. Momentum signals are increasingly corrective now too and unless the bulls quickly regather themselves, the market could continue to retrace into the old pivot band $57.50/$57.85. This is also where the support of a three month uptrend comes in. We remain medium term positive outlook on oil, but the legacy of yesterday’s slide may still have some legs in it near term.
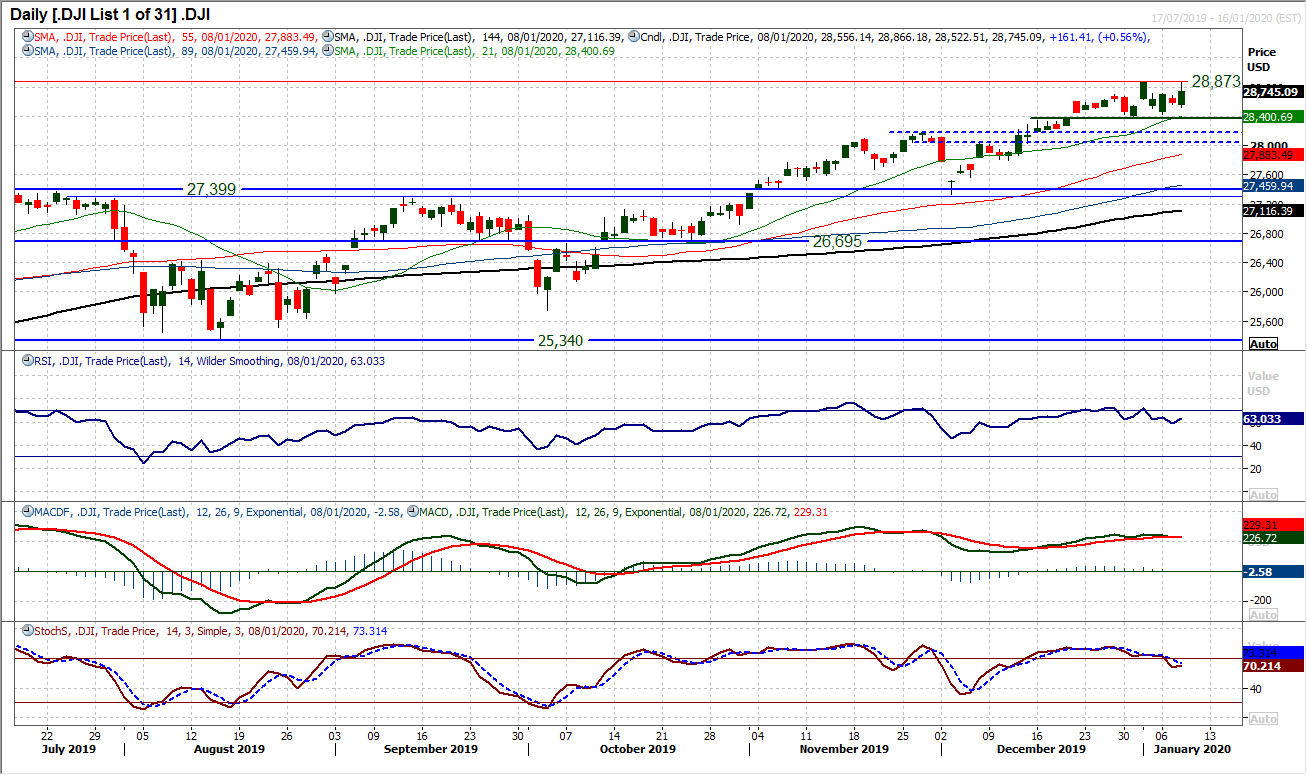
The bulls have held up well during the geopolitical tensions which have impacted markets through the past week. Another opening gap lower was quickly closed intraday to leave a strong positive candle. It shows that whilst the risk of a near term head and shoulders top is still present, there still seems to be an outlook to buy into weakness. There has been a mild moderating of momentum in recent sessions as the market has toyed with the idea of topping out, however, there is still a reasonably positive configuration. The RSI remains above 60, whilst MACD lines have only flattened. Stochastics are sliding but even this move is fairly well contained. In four of the five sessions in 2020, there has been a strong intraday reaction by the bulls, so with the geopolitical risks receding, we look for this to continue. A test of the all-time high at 28,873 did not quite succeed yesterday, but this is unlikely to be the last. Initial support at 28,522 above the key potential neckline at 28,376.
"""DISCLAIMER: This report does not constitute personal investment advice, nor does it take into account the individual financial circumstances or objectives of the clients who receive it. All information and research produced by Hantec Markets is intended to be general in nature; it does not constitute a recommendation or offer for the purchase or sale of any financial instrument, nor should it be construed as such.
All of the views or suggestions within this report are those solely and exclusively of the author, and accurately reflect his personal views about any and all of the subject instruments and are presented to the best of the author’s knowledge. Any person relying on this report to undertake trading does so entirely at his/her own risk and Hantec Markets does not accept any liability. """
