Market Overview
The improvement of risk appetite from the middle of last week, looked to be dissipating at the lack of progress towards a US/China trade agreement and reality taking over hope in the search for a Brexit deal. However, could it be that European politicians might actually cobble together a workable deal on Brexit that might put an end to (admittedly just the first stage of) this Brexit soap opera? As European traders get back to their desks this morning, news of overnight progress is awaited.
Another spike higher on Sterling yesterday (+175 pips in an hour versus the US dollar) reflected growing anticipation that some sort of workable deal could be given the green light for the EU-27 to debate at this week’s EU Council meeting. Michel Barnier (EU chief Brexit negotiator) is the man whose hands lie the hopes of a deal. It was notable yesterday that major markets really took reaction to this too. A move out of safe havens and into higher risk.
Weakening yen and gold were clear underperformers, whilst bond yields shot higher. It appears that Germany is the area to focus on for this, with 10 year Bund yields at two month highs and big gains on the DAX. FTSE remains a stock by stock play as domestic focused stocks jump at the expense of foreign revenue production. With around 70% of FTSE 100 earnings generated abroad, the spike higher on sterling remains a drag on the large cap index as a whole.
Wall Street closed strongly higher with the S&P 500 +1.0% at 2996, although there is a slight degree of caution back in the early US futures moves (-0.3%). Asian markets were broadly positive early today, with the Nikkei +1.2% whilst Shanghai Composite was -0.3%. European futures are looking a tad cautious with FTSE futures -0.4% and DAX futures -0.2%.
In forex, there is a marginal risk negative but also USD negative move initially, although little real conviction. GBP has unwound slightly from yesterday’s spike gains, but nothing to suggest any direction.
In commodities the mild risk negative and dollar negative move is helping to lend gold a degree of support whilst oil is consolidating.
Although it may not be at the forefront of traders’ minds, the UK tier one data keeps on rolling today, with inflation in focus. UK CPI for September is at 09:30 BST and is expected to show headline CPI increasing by +0.2% on the month which would take year on year to +1.8% (from +1.7% in August). Core UK CPI is also expected to tick higher in September, to +1.7% (from +1.5% in August).
Inflation is also in focus for Eurozone data, with the final reading of September Eurozone HICP at 10:00 BST which is expected to remain at +0.9% (+0.9% flash). Final Core Eurozone HICP is expected to be confirmed at +1.0% (+1.0% flash, up from +0.9% final in August). The US consumer is again the key today with US Retail Sales (ex-autos) at 13:30 BST which is expected to grow by +0.2% for the month of September (after a flat 0.0% in August).
Chart of the Day – German DAX
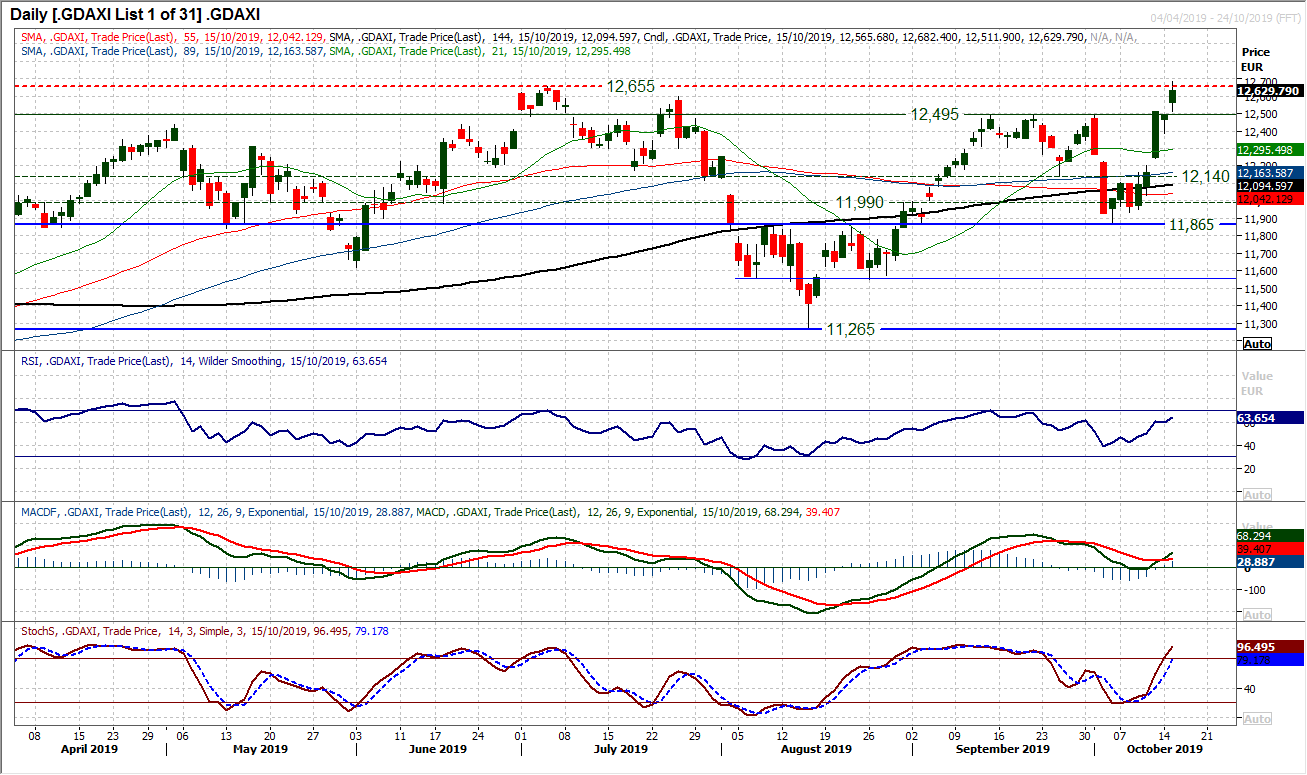
A massive rally on DAX in the past week has now seen a breakout (on an intraday basis) to new 2019 highs. It seems that the prospect of a Brexit deal has the DAX bulls all giddy, resulting in another strong bull candle as a breakout above 12,655 has come. Although futures are a shade lower initially today, intraday weakness is being bought into now. There is technical upside potential too, with the momentum indicators accelerating into strong configuration. The daily RSI into the mid-60s, whilst a bull cross on daily MACD and Stochastics pushing above 80. A 950 tick two week rally in late August shows that the buying pressure can take the DAX on a big run once momentum takes hold. The bullish filling of another gap from yesterday’s open reflects the strength in the market now. The next step is to close a breakout above 12,655, however, initially today, the hourly chart shows 12,590/12,655 is now a near term support band that the bulls will want to hold. Holding above the old gap at 12,511 (and previous breakout at 12,495) will maintain near term bull control. Above 12,655 opens 12,740 as initial support but the July 2018 high of 12,887 is the next key resistance.
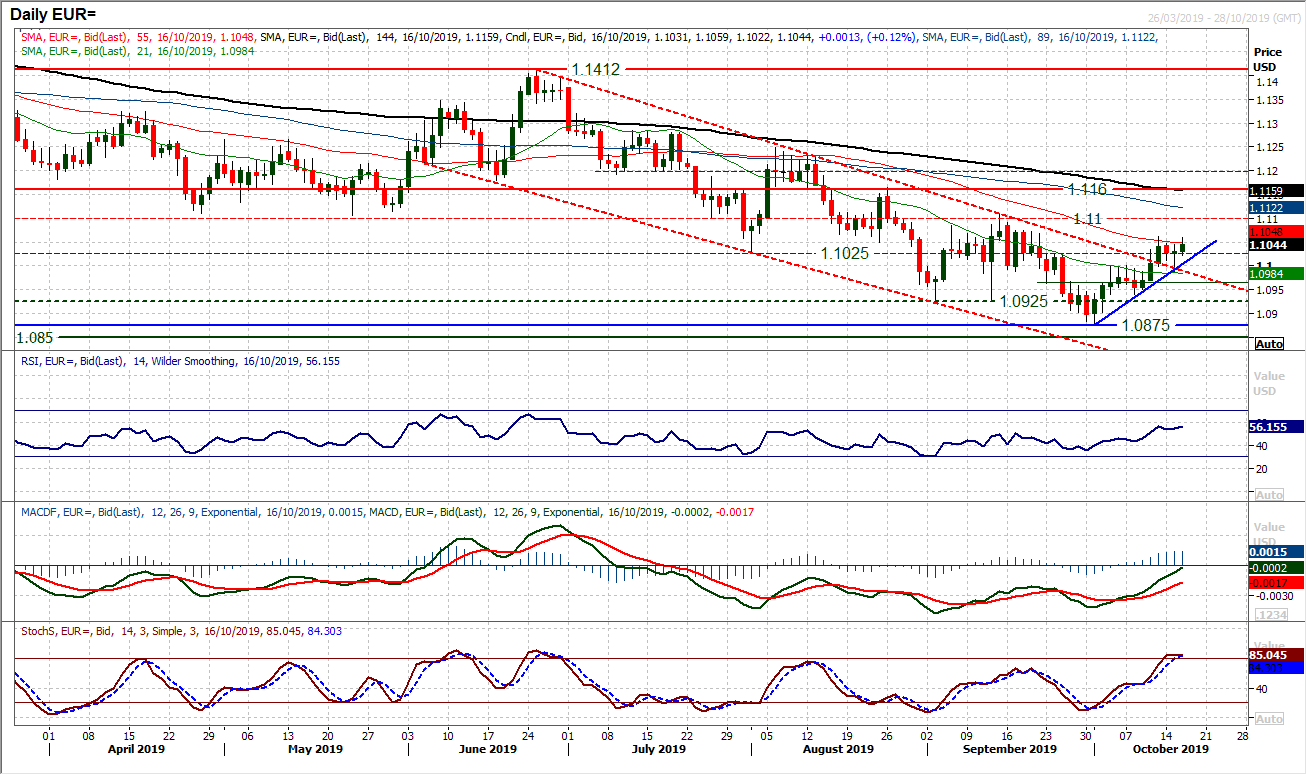
There was a decisive positive reaction on EUR yesterday to the news that a Brexit deal was progressing. The inference for the outlook on EUR/USD is that the recent recovery is on track. The two week uptrend was tested yesterday but just held on and with the market again closing above the $1.1000/$1.1025 breakout band, the outlook continues to improve. However, there is still a degree of consolidation to recent candles, which are hanging on rather than pressuring overhead supply. The strength of the medium term momentum configuration leaves a positive bias, but the need for a positive candlestick is growing now. Resistance at $1.1060 needs to be broken to open the next phase of recovery to then challenge the key resistance at $1.1100. Support is now in place with yesterday’s low at $1.0990 and a breach would begin to seriously question near to medium term recovery prospects.
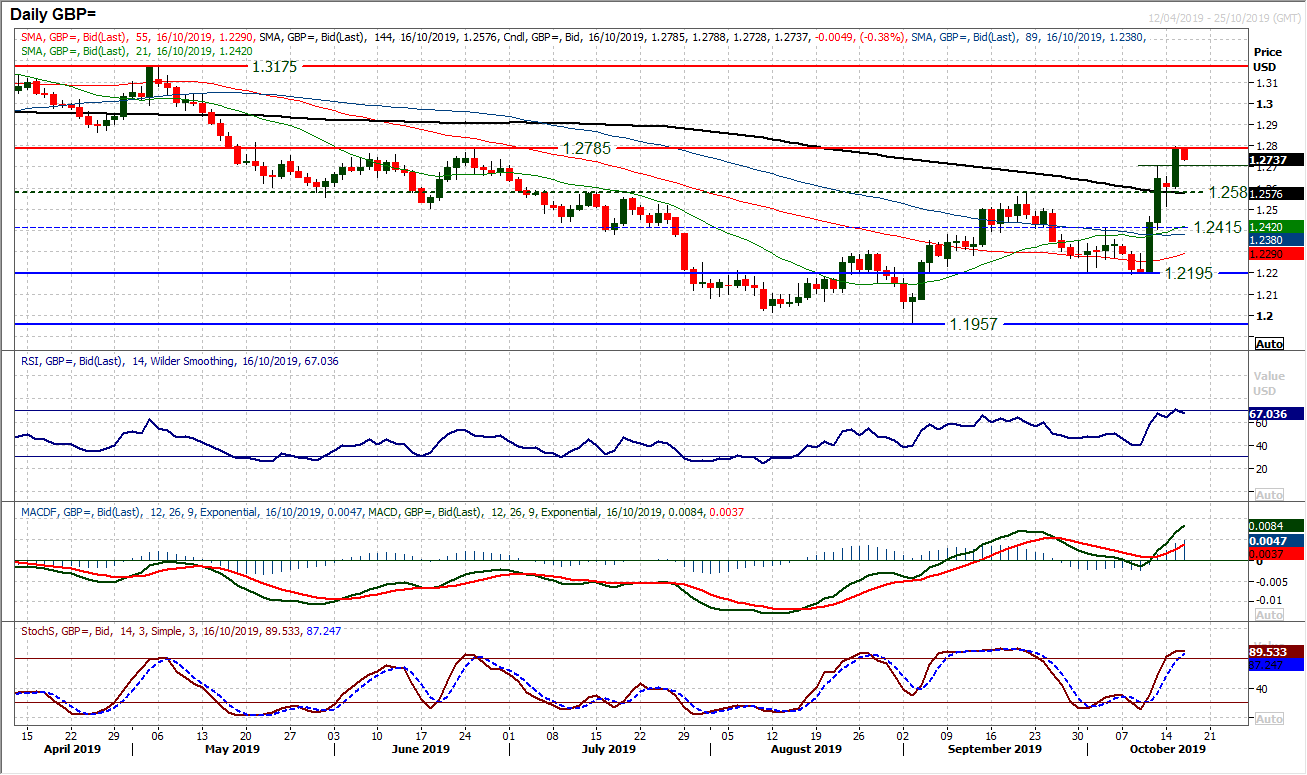
Newsflow on the progress of a Brexit deal is everything for sterling over the coming days. Once more the hourly chart shows that we saw little real direction until news broke of potential for a deal this week and bang, sterling shot 175 pips higher. The market is now consolidating again, waiting for the next snippet of progress or possibly lack of. Huge bull candles in the past few sessions show the pathway since Thursday and Cable has added over 600 pips at its peak. Resistance at $1.2785 is being tested, but a breakout would open $1.3000. The market has just drifted off in the Asian session (on a lack of expected update from Brexit negotiations overnight). There is likely to be the next move at some stage this morning, so strap yourselves in for the next twist and turn of the roller coaster ride. Initial support at $1.2705 but technicals matter little at this stage.
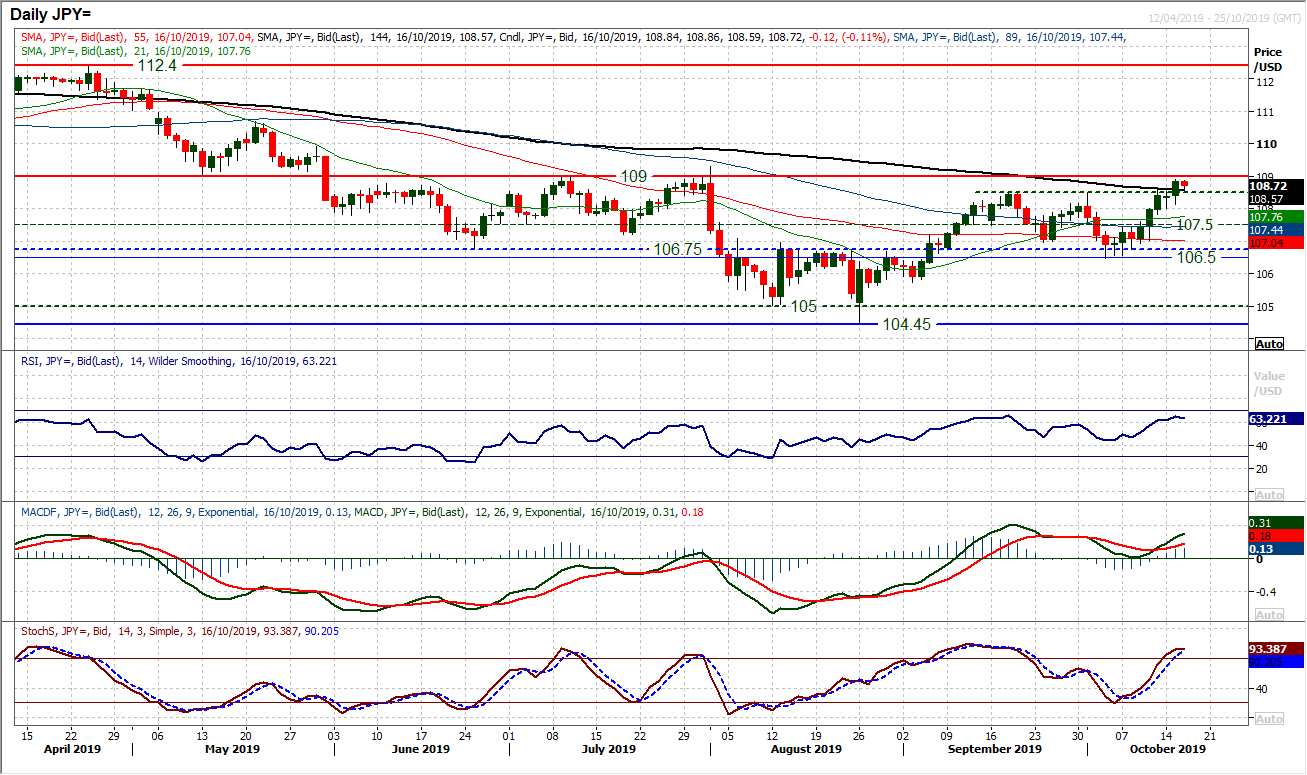
The elevate prospect of a Brexit deal is having a key impact on risk appetite. A key turnaround in the outlook for a deal has driven Dollar/Yen to a decisive breakout above 108.50. This now means that the more considerable resistance of the early summer pivot at 109.00 is now to be tested. This is continuing a run of higher daily lows over the past six sessions, showing that intraday weakness remains a chance to buy. Momentum is well positioned for a test of 109.00, even if there has been a minor slip back in the early moves this morning. Weakness remains a chance to buy. The hourly chart shows a band of initial support 108.45/108.60 today whilst the bulls remain in control above 108.00. The resistance at 109.00 is crucial on a medium term basis as a breakout would be a four month high, but also be a decisive signal of ongoing recovery potential.
Gold
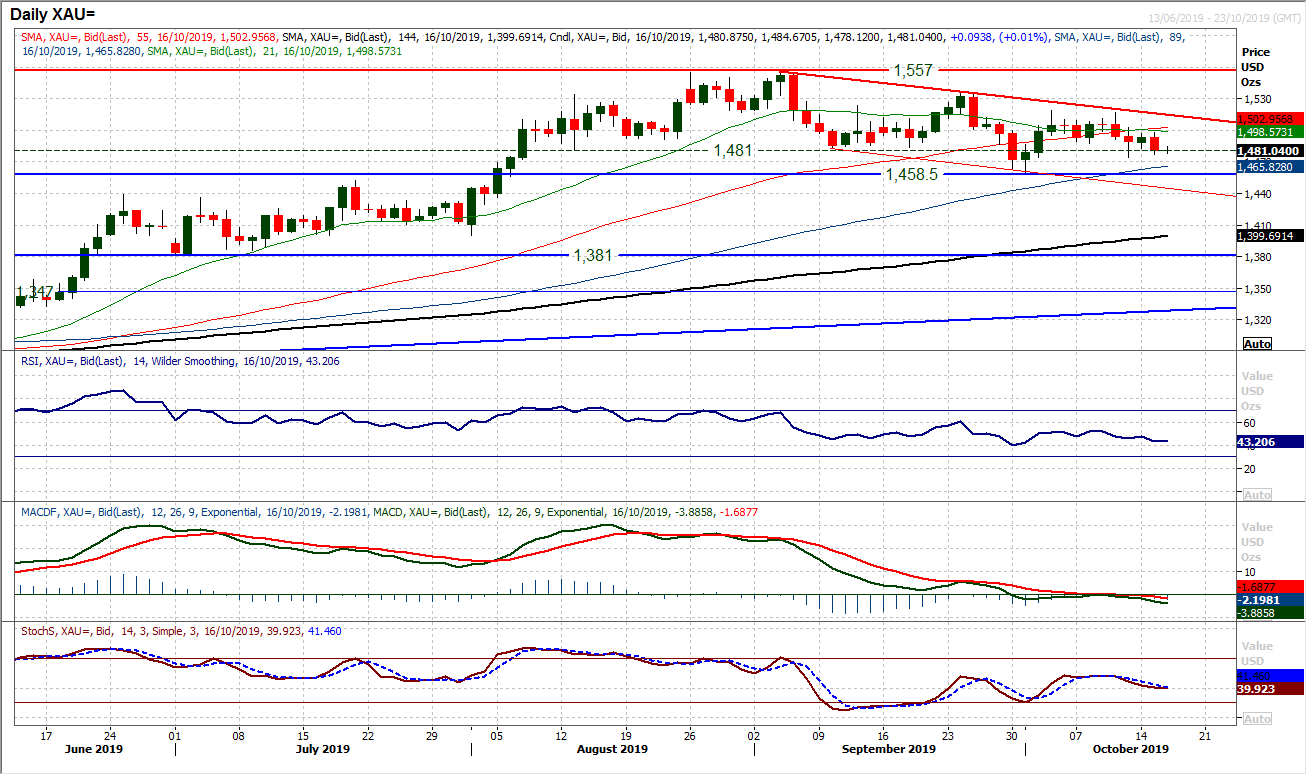
In keeping with moves across the major markets, yesterday’s news of progress towards a Brexit deal (which gave risk appetite a shot in the arm) has had an impact on gold. A solid negative candlestick and a -$17 move has reiterated the current negative bias that has been developing within the $1458/$1557 multi-month range. The drift lower on momentum indicators are reflective of this negative bias, but there is still a lack of conviction in the move. That is shown in the mild rebound this morning. A close at the old $1481 support shows that the market is on the brink and really testing lower now though. Breakdown signals could easily come if there is further progress towards a Brexit deal. Below $1474 would open the $1458 key low again. Resistance is now beginning to mount under $1500 with the last two session highs at $1497. The hourly chart shows corrective configuration on momentum, with the hourly RSI failing at 60 now, suggesting that intraday rallies are increasingly being sold into.
WTI Oil
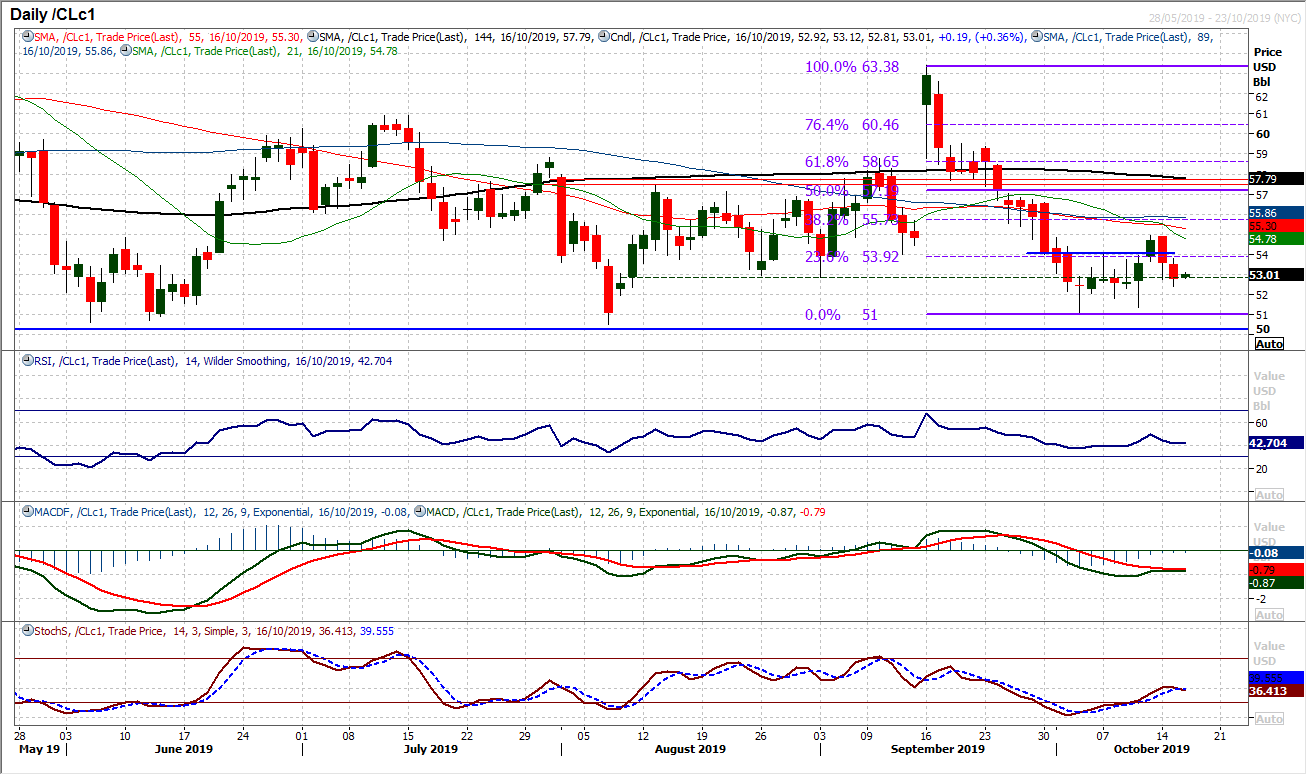
After the prospects for a recovery had been building last week, the selling pressure of the past couple of sessions shows how difficult the bulls continue to find the oil market. Losing -3.5% this week has flipped an improving outlook completely on its head and once more an old pivot of a couple of weeks ago at $52.85 is being tested. A decisive closing breach would re-open the crucial lows at $50.50/$51.00 again. The hourly chart shows initial resistance at $53.80 whilst negative configuration on near term momentum shows strength being sold into again.
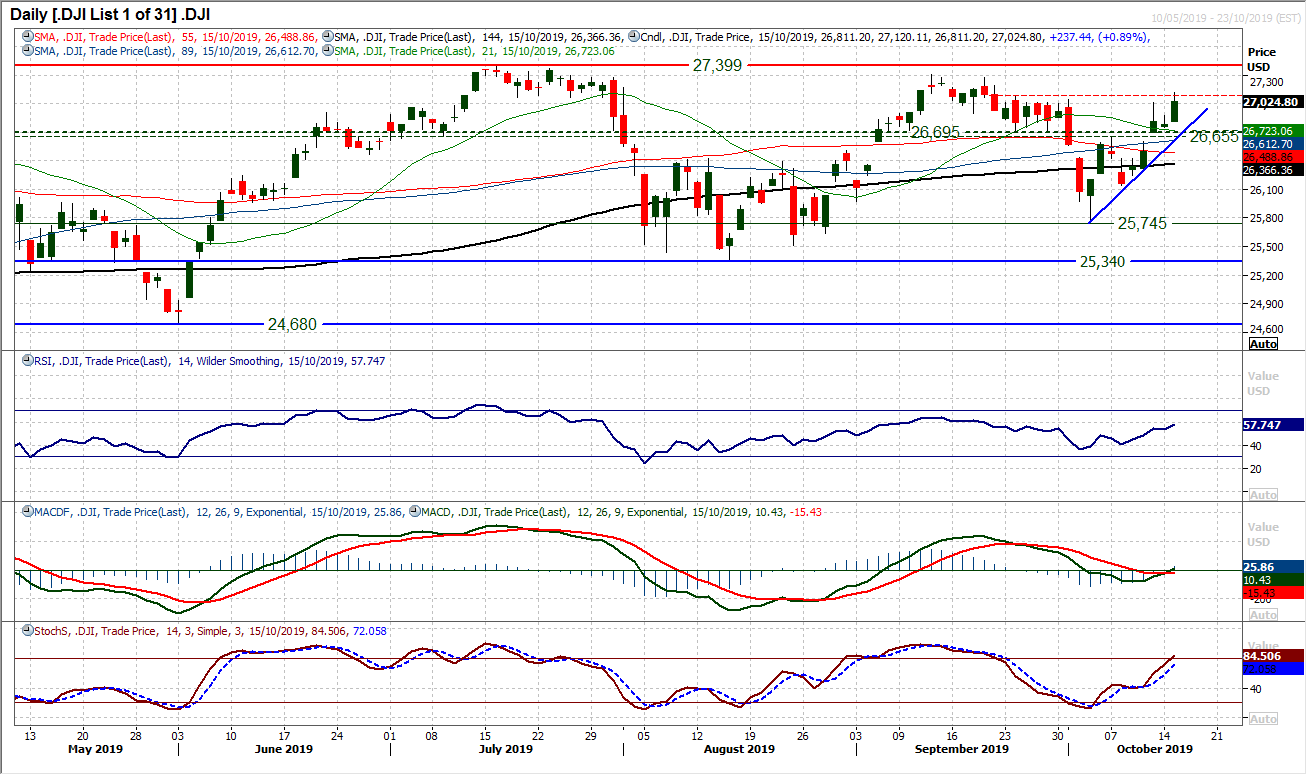
A broadly positive start to earnings season and the traction towards a Brexit deal served up a healthy helping of gains for the Dow yesterday. A decisively positive session added +0.9% to again test the resistance around 27.045/27,080. Although a break above could not be held into the close there is strong enough momentum to suggest that the bulls are in a good position to push through now. As the Stochastics push into bullish configuration and RSI into the high 50s, a bull cross on the MACD lines at neutral is a strong signal. The previous bull cross on MACD came in late August prior to a decisive two week rally. With the market running a burgeoning two week uptrend now, there is a confluence of support around the old pivot 26,655/26,695 which is underpinning the recovery now. The two week uptrend support is at 26,730 today. Resistance overhead comes in between 27,270/27,310 whilst the all-time high is 27,399. The hourly chart shows initial support 26,875/27,000.
"""DISCLAIMER: This report does not constitute personal investment advice, nor does it take into account the individual financial circumstances or objectives of the clients who receive it. All information and research produced by Hantec Markets is intended to be general in nature; it does not constitute a recommendation or offer for the purchase or sale of any financial instrument, nor should it be construed as such.
All of the views or suggestions within this report are those solely and exclusively of the author, and accurately reflect his personal views about any and all of the subject instruments and are presented to the best of the author’s knowledge. Any person relying on this report to undertake trading does so entirely at his/her own risk and Hantec Markets does not accept any liability. """
