Market Overview
As the clouds of uncertainty over the US/China trade dispute and UK political gridlock on Brexit have begun to lift, risk appetite has begun to improve again. However, with trade, the devil is always in the detail. Major markets have been thrown around in recent sessions on reaction to the US and China reaching agreement on “phase one” of a trade deal. Whilst moving on from phase one sounds great, there has been a lack of detail over the agreement and perhaps a few question marks over whether it is all that it is cracked up to be.
Thursday’s initial all-out positive reaction was followed by Friday’s caution. Spikes and retracements have been seen across key markets. However as the dust begins to settle this morning, there is a gradual suggestion that risk is still positive.
Traders have been eyeing 7.00 on the Dollar/Yuan rate as a line in the sand. Having seen yuan strength retraced sharply from 6.93 on Friday to close above 7.00, but we see the yuan edging tentative strength to almost bang on 7.00 today. Treasury yields have edged higher in early moves too. The yen and dollar are also seeing outflows resuming this morning. Equity markets still seem to be unencumbered this morning, with the falling VIX and European futures looking strong.
The surprisingly positive Chinese economic data for November is also playing a part. With China Industrial Production jumped to multi-month highs at +6.2% (+5.0% exp, +4.7% in October) with China Retail Sales at 8.0% (+7.6% exp, +7.2% in October). The strong advance on sterling seemed to be questioned on Friday but is once more back on track this morning. A large majority Conservative Government will create Brexit clarity at least for the first time in three and years, even if there is still much work to be done.
Wall Street closed a choppy session with the S&P 500 less than 1 tick higher at 3169, however, US futures are looking positive today at +0.3%. This has not helped a mixed session in Asian (Nikkei -0.3%, Shanghai Composite +0.6%) but European markets are pushing on today with FTSE 100 Futures +0.4% and DAX Futures +0.6%.
In forex, there is a curious position on risk forming. GBP continue to climb strongly in the wake of a large majority Conservative Government in the General Election. EUR is also gaining good ground today. There is a mixed mood elsewhere, with mild JPY weakness but little real direction other than CAD gains.
In commodities there is little real direction on gold whilst a mild unwinding slip on oil.
The late December data is always disrupted by the Christmas holiday period, so the flash PMIs are out early this month. The Eurozone flash PMIs are expected to show improvements across the board at 0900GMT. Eurozone flash Manufacturing PMI is expected to pick up to 47.3 (from November’s 46.9) whilst Eurozone flash Services PMI is forecast to tick higher to 52.0 (from a final November reading of 51.9). The Eurozone Composite PMI is expected to improve to 50.7 (from 50.6 final November). We also now get UK flash PMIs which are at 09:30 GMT and are expected to also improve across the series, albeit still in contraction.
UK Flash Manufacturing PMI is expected to improve to 49.3 (from 48.9), with UK flash Services PMI up to 49.5 (from 49.3) leaving the UK flash Composite PMI up to 49.6 (from 49.3).
The US flash Manufacturing PMI is at 14:45 GMT and is expected to be unmoved at 52.6 and the US flash Services PMI penciled in to improve to 52.0 (from 51.6).
Chart of the Day – EUR/JPY
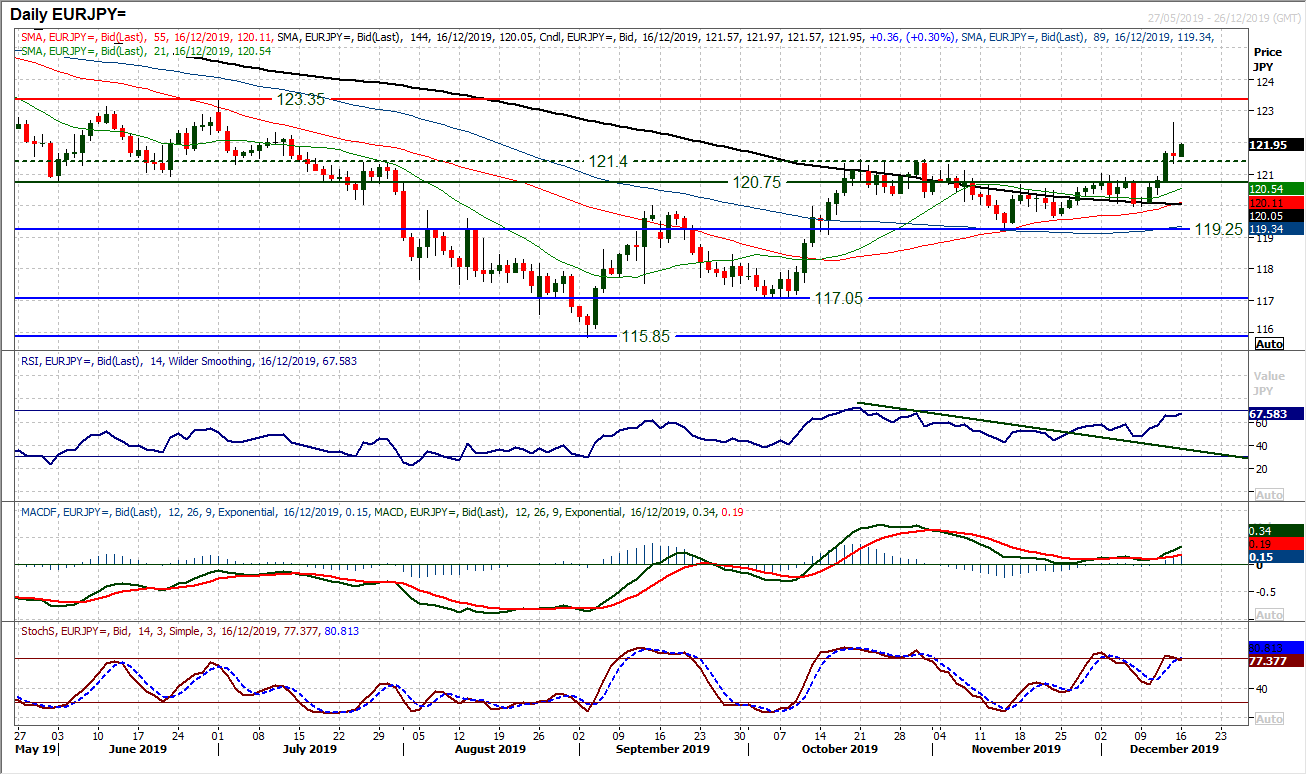
There is a developing underperformance of the yen and this is playing out through a breakout on EUR/JPY. There has been a pivot resistance at 120.75/121.40 which has capped the recovery potential in recent months. However, a shift in sentiment in recent sessions has breached this resistance, now on a two day closing basis. It has come with momentum indicators such as RSI (into mid-60s) and MACD lines (bull cross buy signal) improving. The reaction today to Friday’s intraday pullback will be key after Friday’s shooting star candle. A positive early response seems to be suggesting that the bulls are still in control but needs to be maintained to the close. The 120.75/121.40 band is now a basis of support. The hourly chart shows support building at the breakout which needs to be maintained. There is an immediate range breakout target around 123.50, with the July high of 123.35 a barrier. Initial resistance is at Friday’s high of 122.65.
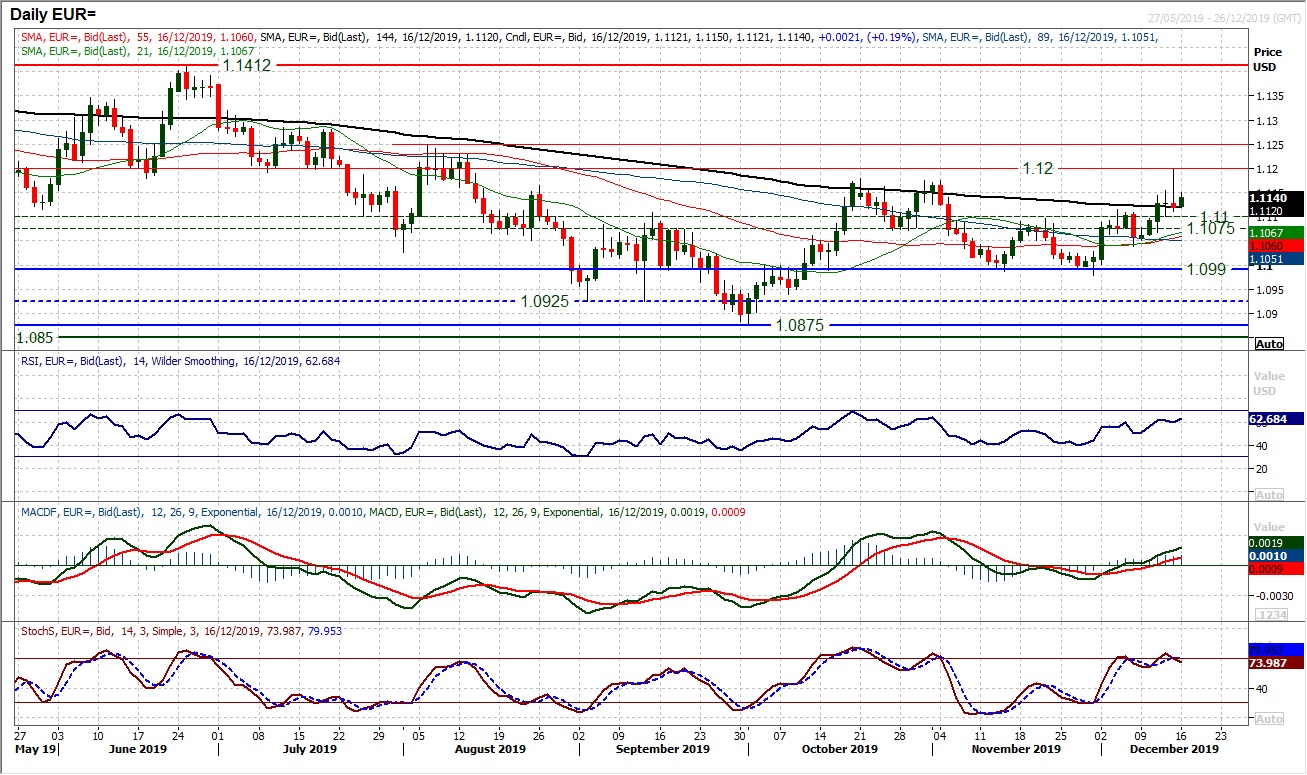
As last week progressed, the outlook on EUR/USD was developing into a more positive positioning within what is still a medium term range (between $1.0980/$1.1180). A mixed response to the newsflow on US/China trade relations left us with a shooting star candlestick on Friday. The fact that this candle included a failed test of the $1.1180 resistance will be of concern for the bulls (leaving a high at $1.1200). It means that the response early this week as the dust settles will be key. Initially, it seems that the bulls are positioning to continue supporting the market. There is a developing run of buying into weakness, with five consecutive higher daily lows (threatening a sixth today). Coming above $1.1100 (the top of the old mid-range pivot band) suggests that pressure is building towards another test of $1.1180/$1.1200. Momentum is positive and the hourly chart shows good upside potential now for the test higher. Closing back under $1.1100/$1.1110 would at least neutralise the market again.
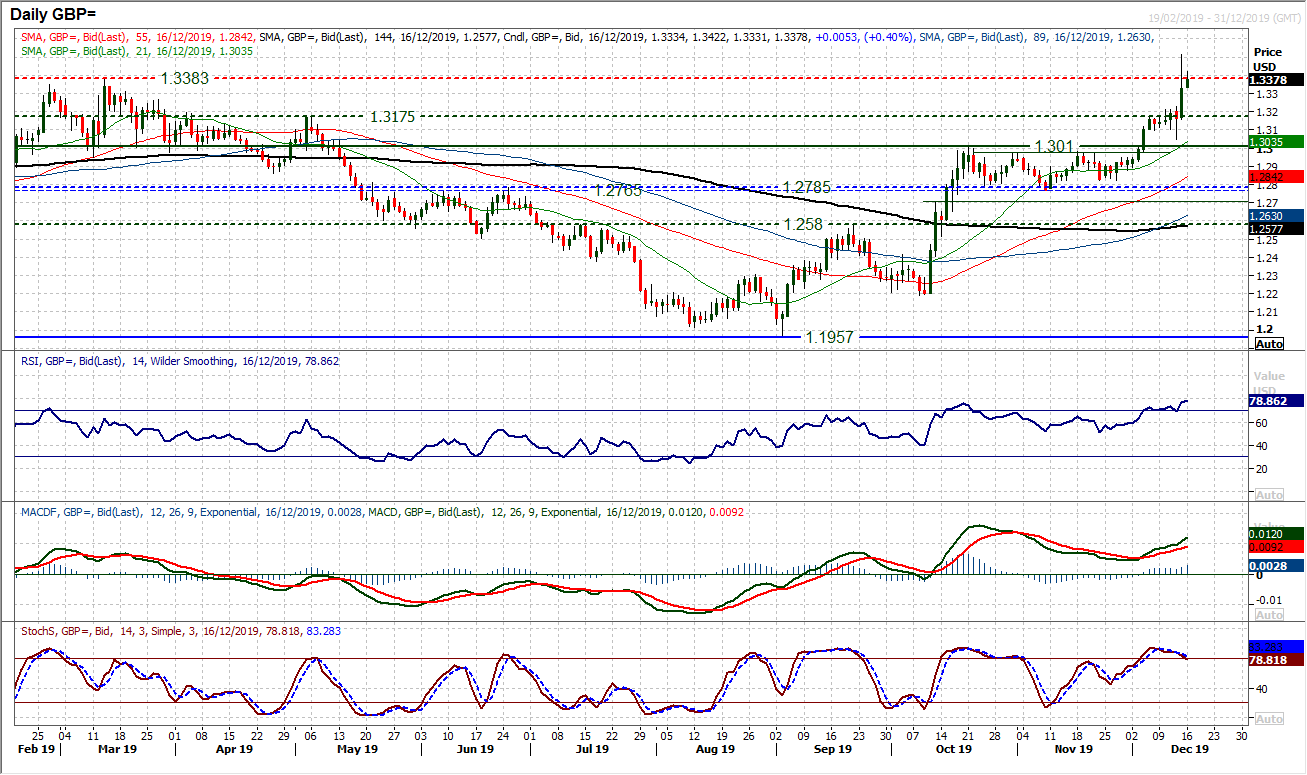
With volatility still elevated in the wake of the UK election, sterling has yet to settle down. Cable added around +160 pips on Friday but the intraday volatility of moves meant that Cable had a daily range of 360 pips. Closing around the mid-point of the session will leave the bulls a little curious as there was a rejection for a close -190 pips off the day high. How the market responds today after a weekend of contemplation will be key as volatility begins to settle. Initial signs are positive still, with an early intraday gap higher and continued gains, leaving initial support at $1.3325/$1.3330. We see the medium term trend still higher into Q1 2020 and that weakness is a chance to buy to test around $1.3500 (Friday’s high was $1.3515). Momentum remains strongly positive, and given the near term volatility, there could be some opportunity to buy again. Support is key between $1.3000/$1.3050 with breakout support around $1.3175/$1.3230.
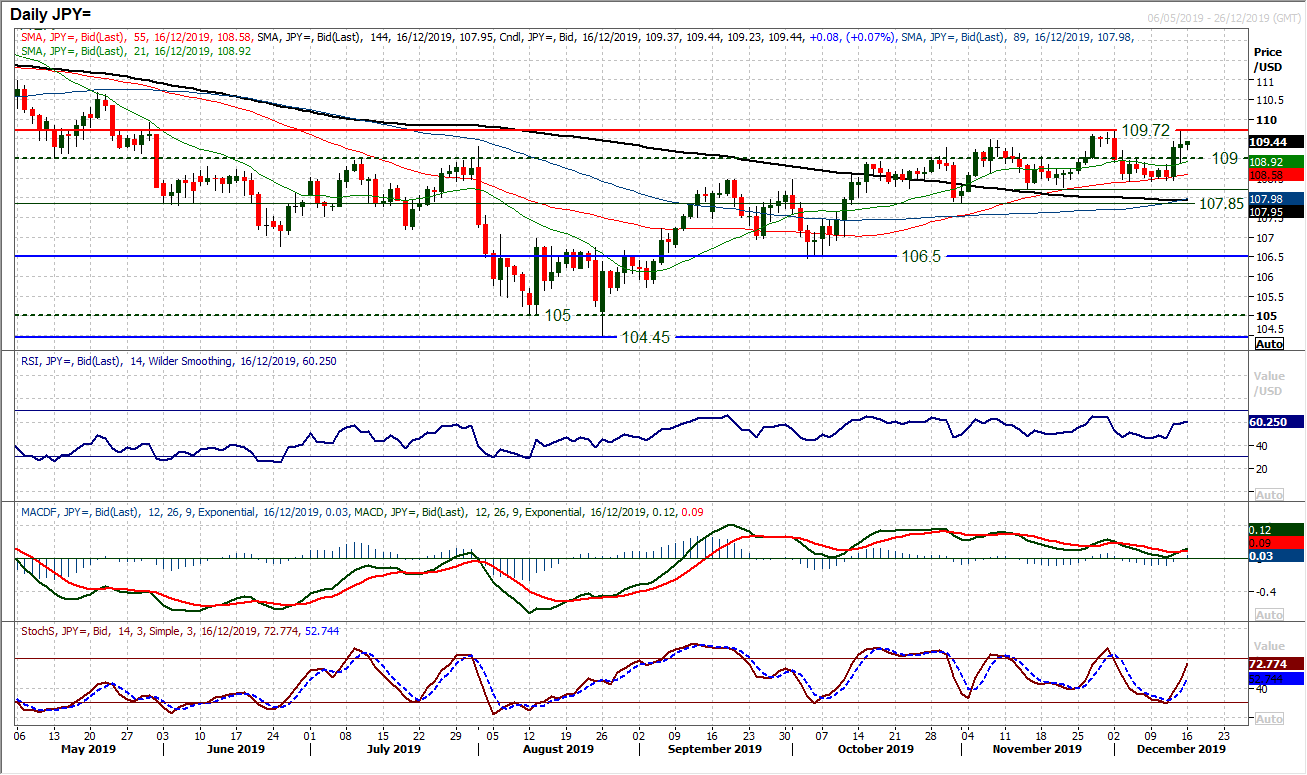
With the US and China seemingly coming to some sort of phase one agreement on trade, risk appetite is improving. This is hitting the yen. A strong bull candle on Thursday was followed by something more questionable on Friday, but the bulls on USD/JPY are far better positioned coming into the new week. Trading above 109.00 gives the chart a more positive outlook, whilst the momentum indicators are positively configured still. However, as so often with Dollar/Yen there is always a caveat. Friday’s high was again almost bang on resistance of 109.70 and the market looks tentative again today. Breakouts on this chart are never straight forward and initial rejections are commonplace. However, weakness is a chance to buy as the run of higher lows is ongoing. Continued closing above 109.00 will maintain a degree of bull confidence. A breakout above 109.70 would open 109.90 and more considerable resistance at 110.65. The importance of support at 108.40 is growing.
Gold
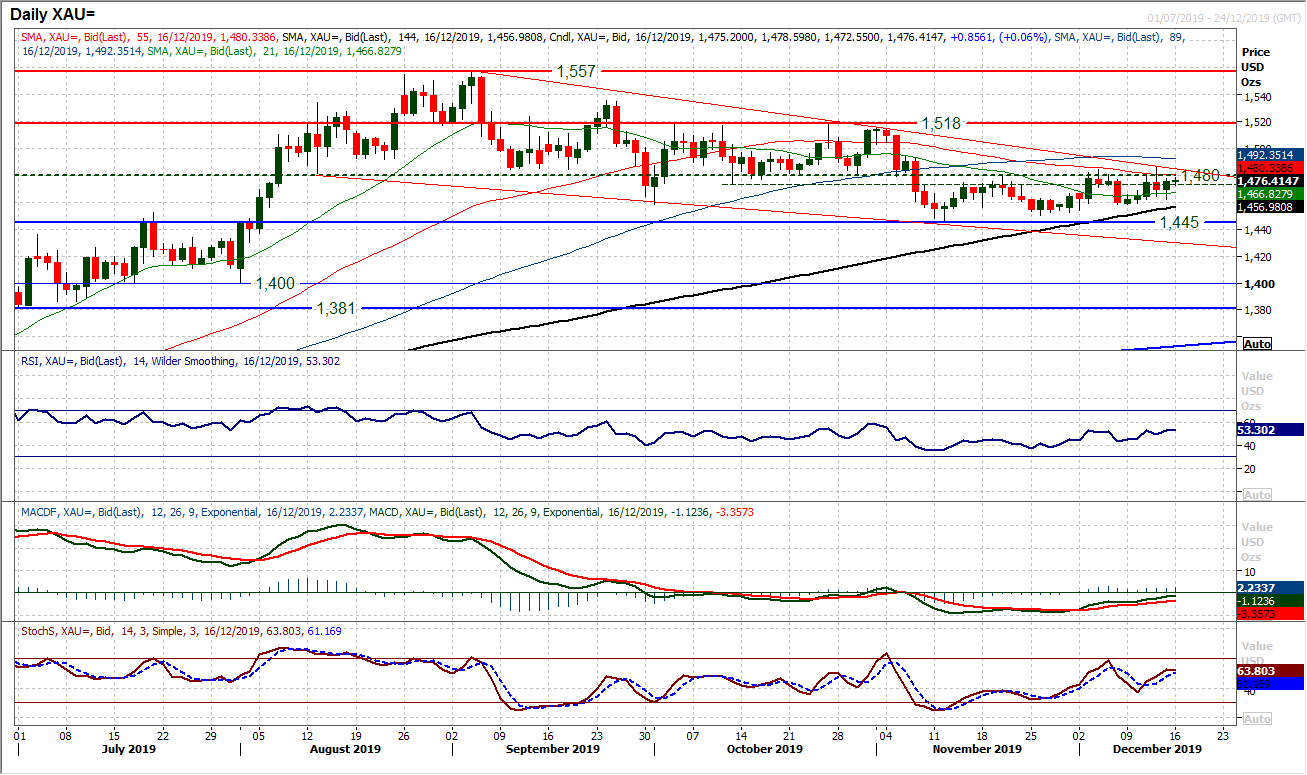
For weeks throughout November and into December there has been a lack of conviction on gold and trading volatility has been on the wane. Having formed a low at $1445 the market has since been unable to continue the drive lower as part of what still looks to be a medium term corrective trend. Equally though, the bulls have also been unable to grasp the initiative. Given the run of lower highs and lower lows, there is still a negative bias to the market. Once more there has been a test of the resistance of the overhead supply around $1480/$1484 as another rebound failed at $1487 on Thursday to close back under $1480. The rebound hit up against what is a growing downtrend channel of the past three months (at $1485 today). Once more, we see momentum indicators back around their neutral points (RSI into low 50s), suggesting that gold is once more testing around a crossroads. So many times the bulls have blinked and passed up the opportunity for a break higher to improve the outlook. A positive candle on Friday is again eyeing $1480 again today. A close above $1487 would suggest the bulls are grasping control. Support is growing at $1458, with the hourly chart showing a growing pivot band of initial support around $1465.
WTI Oil
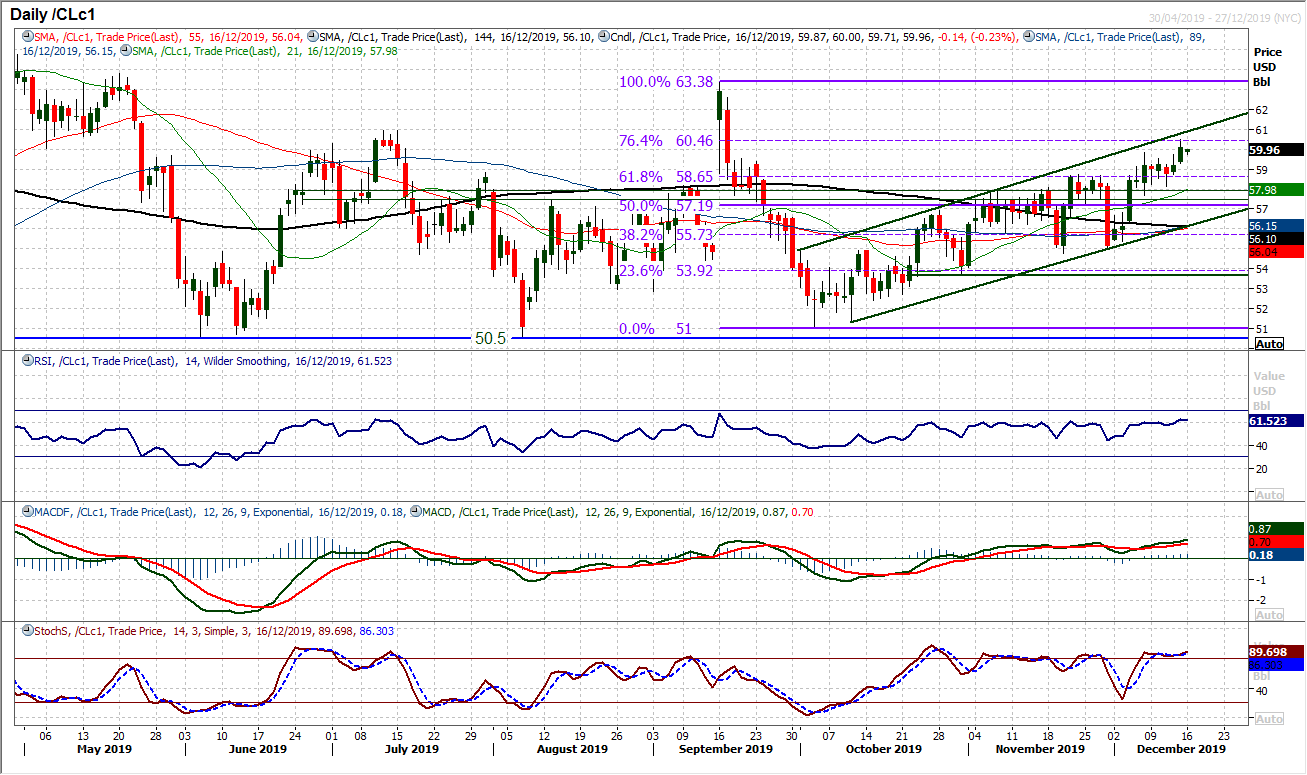
It may have needed to have been redrawn a couple of times, but there is still a growing medium term uptrend channel on WTI. There have been numerous attempts to push on with the channel that has been hit by sharp bear candles. However, time and again, these drops have been quickly supported. The latest breakout seems to be building from growing support around $57.70/$58.65. The positive newsflow surrounding the US/China trade talks have helped to boost oil higher for another break to multi-month highs on Friday. We see positive momentum (RSI into 60s and MACD lines rising at multi-month highs) to confirm the move. We are buyers into weakness. The Fibonacci retracements (of $63.40/$51.00) have often been near term consolidation or turning points, so the 76.4% Fib at $60.45 being hit on Friday is notable. Any near term retreat into support around $58.65 (also the 61.8% Fib) would be an opportunity to buy.
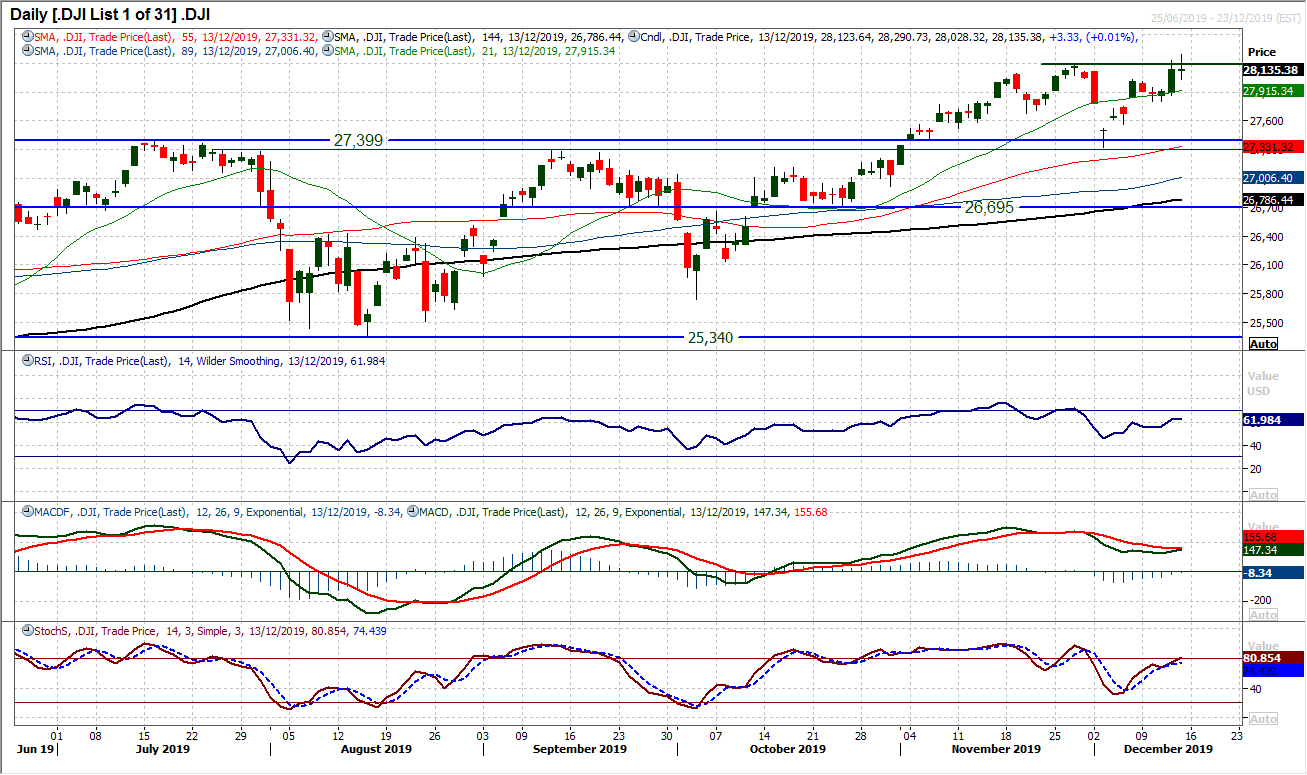
The Dow jumped higher on Thursday as the news of a phase one trade deal filtered through. An intraday all-time high has subsequently been hit on the past two sessions (the latest at 28,290. There is a positive technical set up too, with the RSI into the 60s and Stochastics edging into bullish configuration. However, there is still a sense of this being a market not fully convinced. Momentum may be positive but also slightly tentative (MACD lines are not confirming yet and need at least a bull cross). This is also shown in the fact that Friday’s candlestick was a very nervous positive close but also still lacking an all-time closing high. This could be an important session today after a weekend of more headlines and futures seem to be positive today. A decisive close clear of 28,175 would open the move higher. There is a near term buy zone between 28,035/28,175 and the bulls remain in control above 27,805.
"""DISCLAIMER: This report does not constitute personal investment advice, nor does it take into account the individual financial circumstances or objectives of the clients who receive it. All information and research produced by Hantec Markets is intended to be general in nature; it does not constitute a recommendation or offer for the purchase or sale of any financial instrument, nor should it be construed as such.
All of the views or suggestions within this report are those solely and exclusively of the author, and accurately reflect his personal views about any and all of the subject instruments and are presented to the best of the author’s knowledge. Any person relying on this report to undertake trading does so entirely at his/her own risk and Hantec Markets does not accept any liability. """
