Market Overview
Market Overview
The outlook for the dollar was well set until the ISM data this week which has deteriorated considerably on both manufacturing and services sectors. The data has shaken belief that the US economy can insulate itself from the global slowdown. Slowing to a three year low, the ISM Non-Manufacturing fell to 52.6, suggesting the manufacturing sector contraction is feeding into services too. It is said that the ISM Manufacturing data miss has implications for the global slowdown, whilst the Non-Manufacturing data miss reflects the US domestic economy. This will feed through negatively to the outlook for US GDP.
In another worrying development, the Employment component of the ISM data has also fallen sharply to 50.4, barely expanding and at six year lows. This is likely to have negative implications for today’s Non-farm Payrolls report. We have seen higher than expected Weekly Jobless Claims (albeit marginally), whilst the ADP (NASDAQ:ADP) employment missed expectations too. If Non-farm Payrolls also now follow suit it could have significant implications for the prospect of further rate cuts from the Fed this year. The dollar is under pressure and whilst safe havens are benefitting (yen and gold higher, Treasury yields lower), it is also notable to see an improvement in the Aussie too. The outlook for the US economy being the best of a bad bunch is being re-priced. Quite how far that re-pricing goes could depend on Non-farm Payrolls today.
Wall Street rebounded into the close with the S&P 500 +0.6% to 2910 whilst US futures are consolidating in front of a crucial payrolls report. This leaves Asian markets mixed to mildly higher with the Nikkei +0.2%. In European indices there is more of a positive move initially with FTSE futures +0.6% and DAX futures +0.5%. However, traction beyond there may be difficult as caution sets in for payrolls.
In forex, there is a continuation of the dollar negative move, although the move is relatively slight into the European session and may be limited, with focus quickly turning to the US jobs data.
In commodities, the recovery in gold may be off its highs of yesterday, but still seems to be on course this morning, another +$4 higher. There is even signs of potential recovery on oil, although recent history sees intraday rallies sold into.
After all the concerning signals from economic data this week, today’s Non-farm Payrolls will clearly be of key focus on the economic calendar. The US Employment Situation is at 13:30 BST with headline Non-farm Payrolls expected to come in at 145,000 (marginally up on the 130,000 in August). Average Hourly Earnings are expected to grow by +0.3% on the month (+0.4% in August) which would see the yearly growth at +3.2% (+3.2% in August). Unemployment is expected to stay at 3.7% (3.7% in August) but with participation rate rising recently (last month to 63.2%) and a tick higher on U6 Underemployment (to 7.2%), if jobs growth comes in low then expect an increase in unemployment.
There are also more Fed speakers today, with Eric Rosengren (voter, hawk) at 13:30 BST, Chair Jerome Powell at 19:00 BST, Lael Brainard (voter, dove) at 19:10 BST and Esther George (voter, hawk) at 20:45 BST.
Chart of the Day – AUD/USD
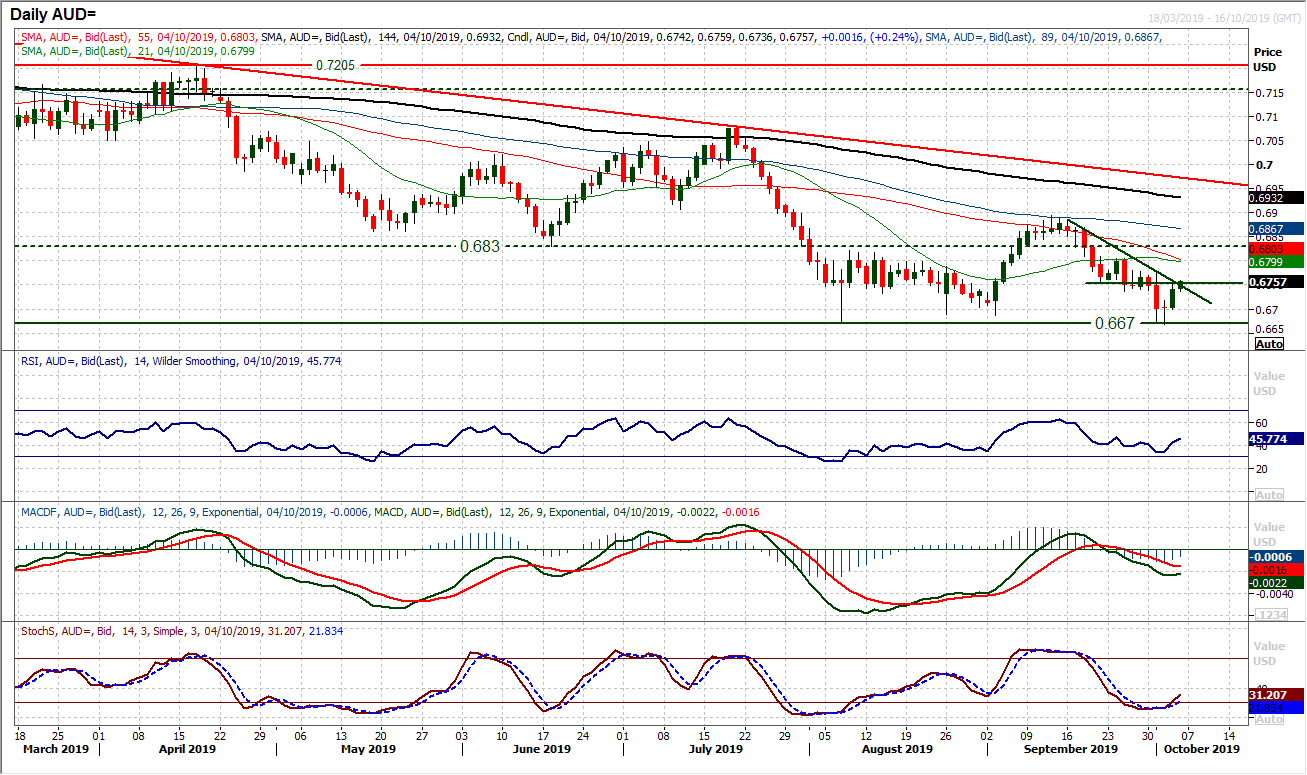
A technical rally on AUD/USD in the wake of yesterday’s ISM disappointment, but is it an outlook changer? The immediate test comes with the three week downtrend. This trend line is a confluence of the resistance with near term overhead supply at $0.6735/$0.6760 of the late September lows. The downtrend comes in at $0.6750 today, and given that the bulls are tracking higher, there is a growing appetite to break clear. Momentum indicators are beginning to suggest recovery too, with the Stochastics crossing higher, which is encouraging. For now, the MACD lines have only flattened off, whilst the RSI has ticked higher into the mid-40s. It would need to drive above 50 to really suggest a recovery is sustaining. The key resistance is the $0.6775 high of the bearish engulfing candle from Tuesday. A closing break above $0.6775 would suggest traction in a rebound. This would then open the key resistance band $0.6830/$0.6890. For now though, the bulls need to make their first move, and for that a decisive close above $0.6755 resistance is needed. The hourly chart shows support at $0.6735 and $0.6700 initially.
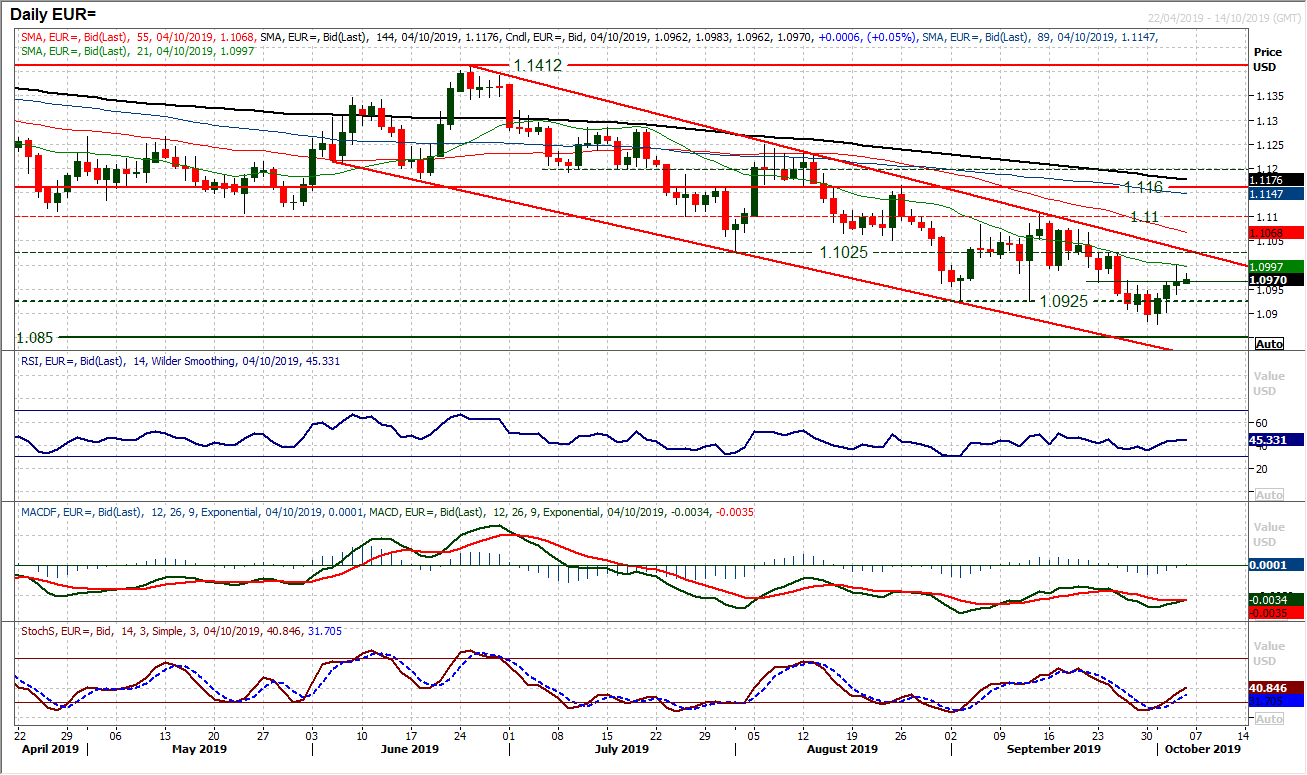
The reaction to today’s Non-farm Payrolls data could be crucial for the dollar. There has been a weakening throughout this week which has pulled EUR/USD higher within the downtrend channel once more. Normally we would see rallies as being counter to the bigger downtrend and another chance to sell. However, the market has now gained ground for three sessions in a row now (something not seen since early August). Momentum indicators have all turned higher (albeit within their negative medium term configurations) and the rebound is up to the 21 day moving average (often seen as a gauge for the sellers). The market is at a key crossroads, and the hourly chart shows this on the near term outlook too, with the pivot at $1.0965 as a neckline of a base pattern if it can be held today (a recovery target of $1.1050 would be implied if it can hold). The old low at $1.1025 is a confluence with the three month downtrend and is key resistance. A move back under $1.0940 would suggest a loss of the recovery.
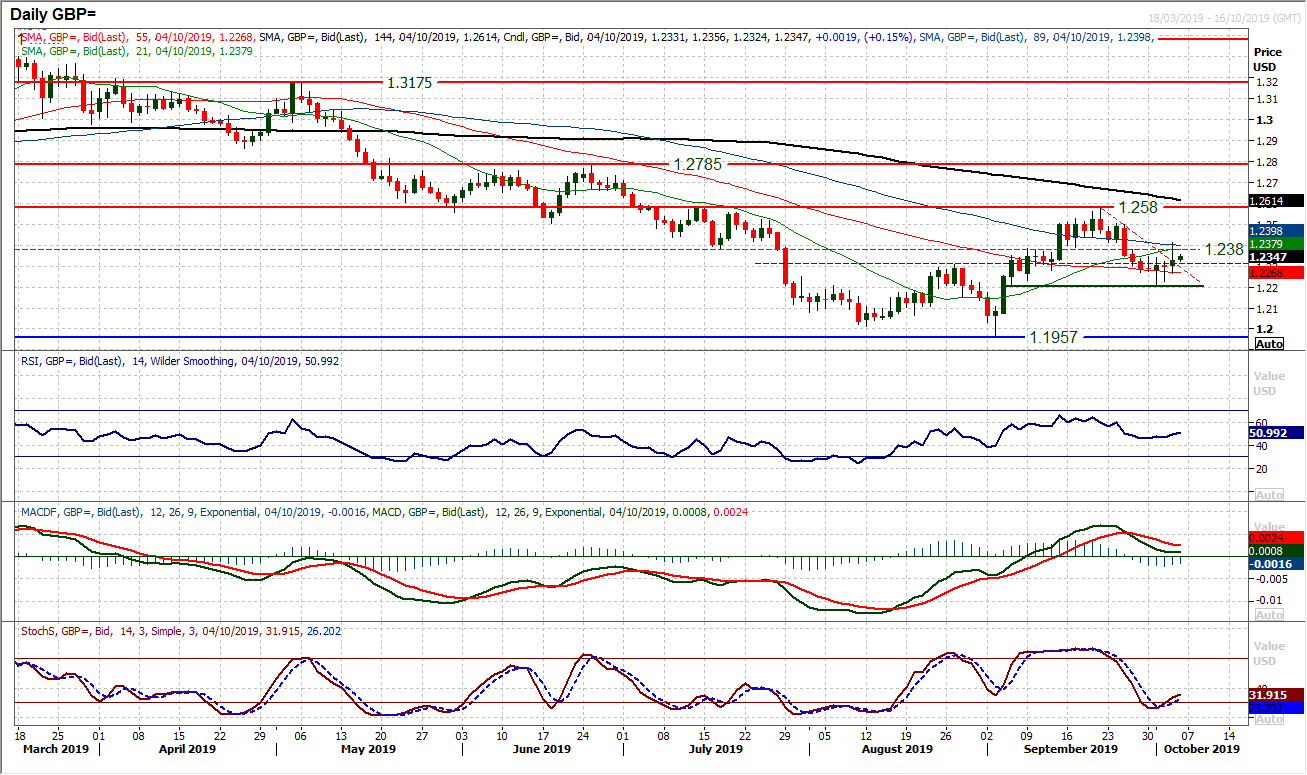
With the dollar under corrective pressure, even Cable has shown signs of recovery. Another tick higher and the market has broken the near term trend lower. However, the move remains indecisive, with yet another small candlestick body (the fourth indecisive candle in a row). Brexit factors drove sterling higher, but an intraday test higher above $1.2380 could not hold and the move has retraced again. The hourly chart shows a basis of initial support at $1.2320/$1.2345 which is holding now. Once payrolls are out of the way this afternoon, we will know more about the near term dollar outlook. Cable has had a higher low in each of the past couple of sessions, meaning that $1.2265 is a gauge of note today. A close above $1.2380 would re-engage the recovery momentum.
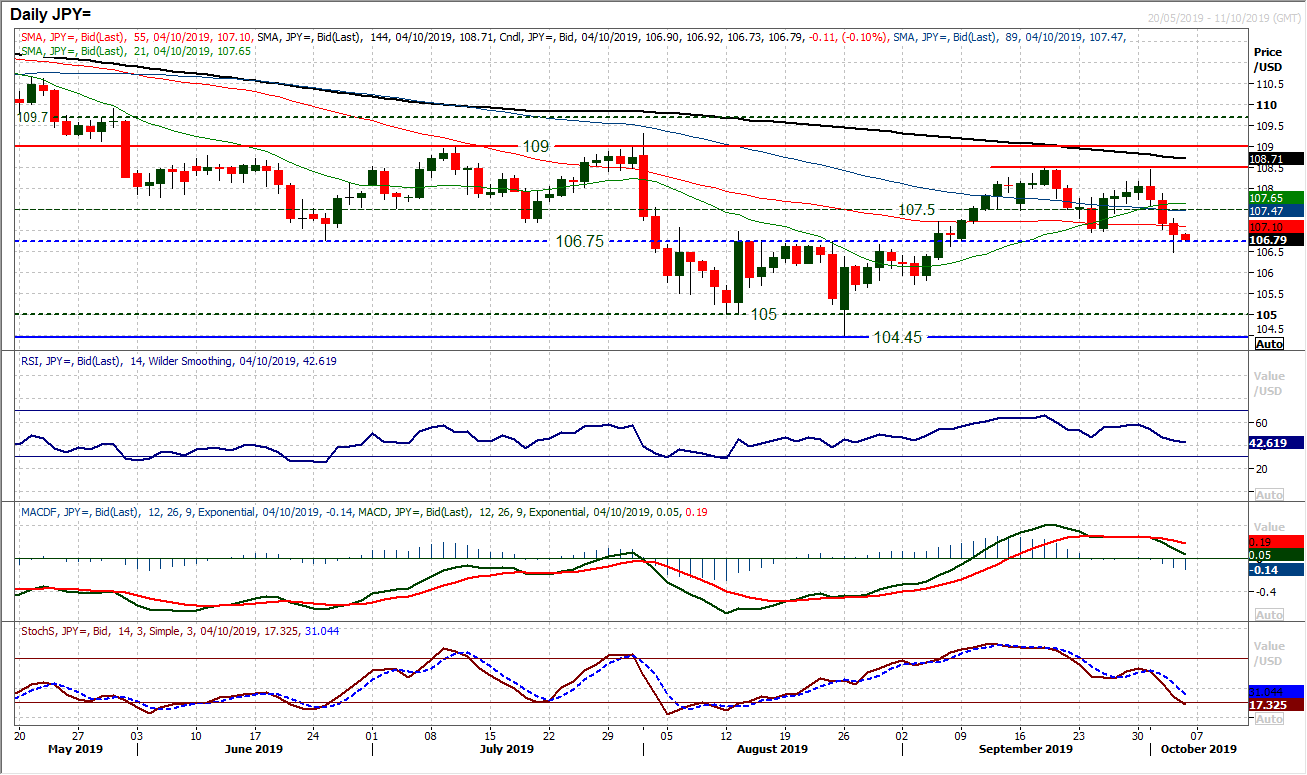
There are still question marks over the dollar performance following a fairly concerning few sessions for the dollar bulls. There is a growing deterioration in momentum and the support at 106.75 was breached intraday to show that the sellers are on the brink of really taking control. Despite not holding the breakdown below 106.75 into the close, the 106.95 support has been broken and this looks like it is a market in the process of a decisive change of outlook. If there is a second day of a closing breach of 106.95 the confirmation of a top would imply -150 pips of downside target to 105.50. In the least it would suggest a test of the 105.70 September low, but a retreat to the 104.45/105.00 August key lows is possible in due course. The hourly chart shows a resistance band 106.95/107.30 as a near term sell zone. Non-farm Payrolls have the potential to drive significant volatility again today, but a close back under 106.95 today would be a significant negative development.
Gold
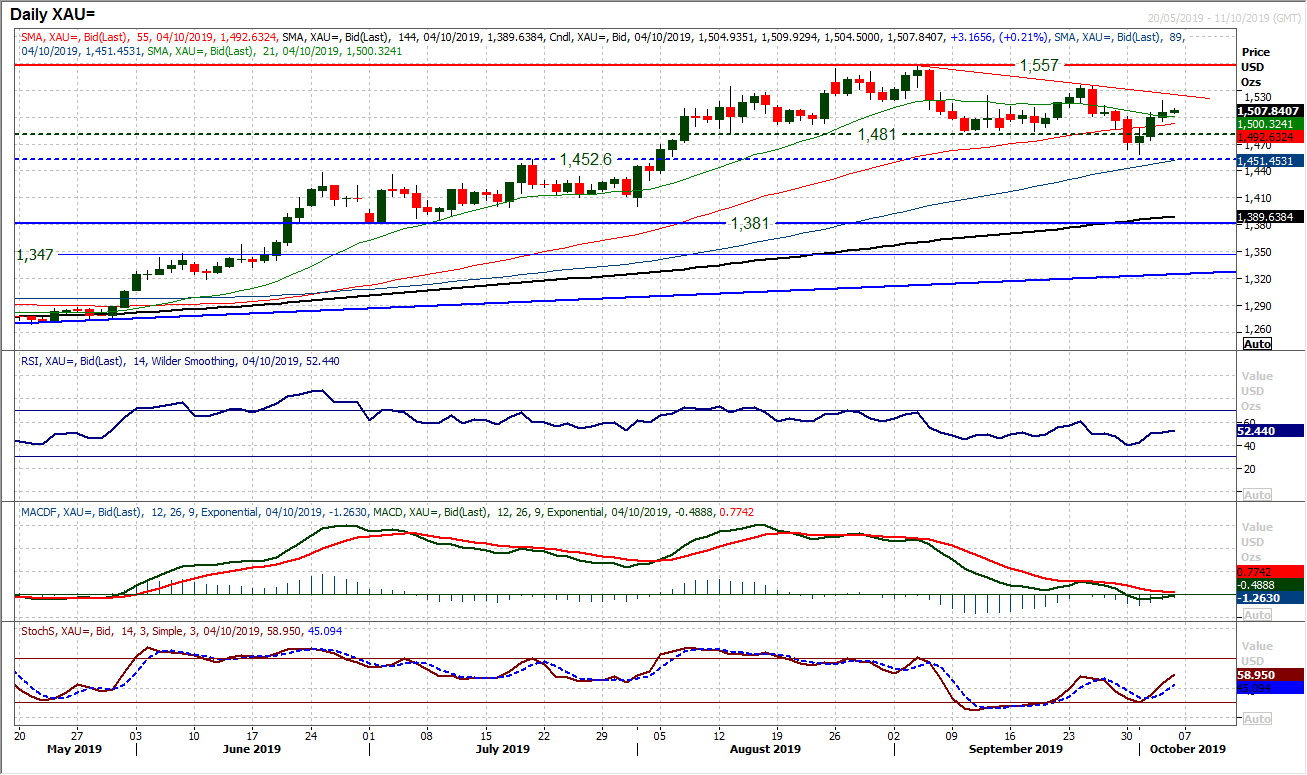
The gold rebound continued yesterday, with a third positive close and a move through further resistance. There are significant uncertainties now over just how far this rebound can go, but once again this morning the market trading higher suggests the bounce is not done yet. In the wake of the ISM Non-Manufacturing disappointment, gold shot higher, but turned back from $1518.50, meaning exactly $60 of recovery in less than three sessions. However, given the market slipped back into the close there are questions that the bulls need to answer today. Momentum has turned higher, but not decisively yet and there needs to be more to suggest this sharp rally is sustainable. That could come with Non-farm Payrolls today. The hourly chart shows the break above $1500/$1502 was important and there is a more positive configuration on momentum. This suggests that if the bulls can continue to support the market above $1500 and then build on the support then this move will be outlook changing.
WTI Oil
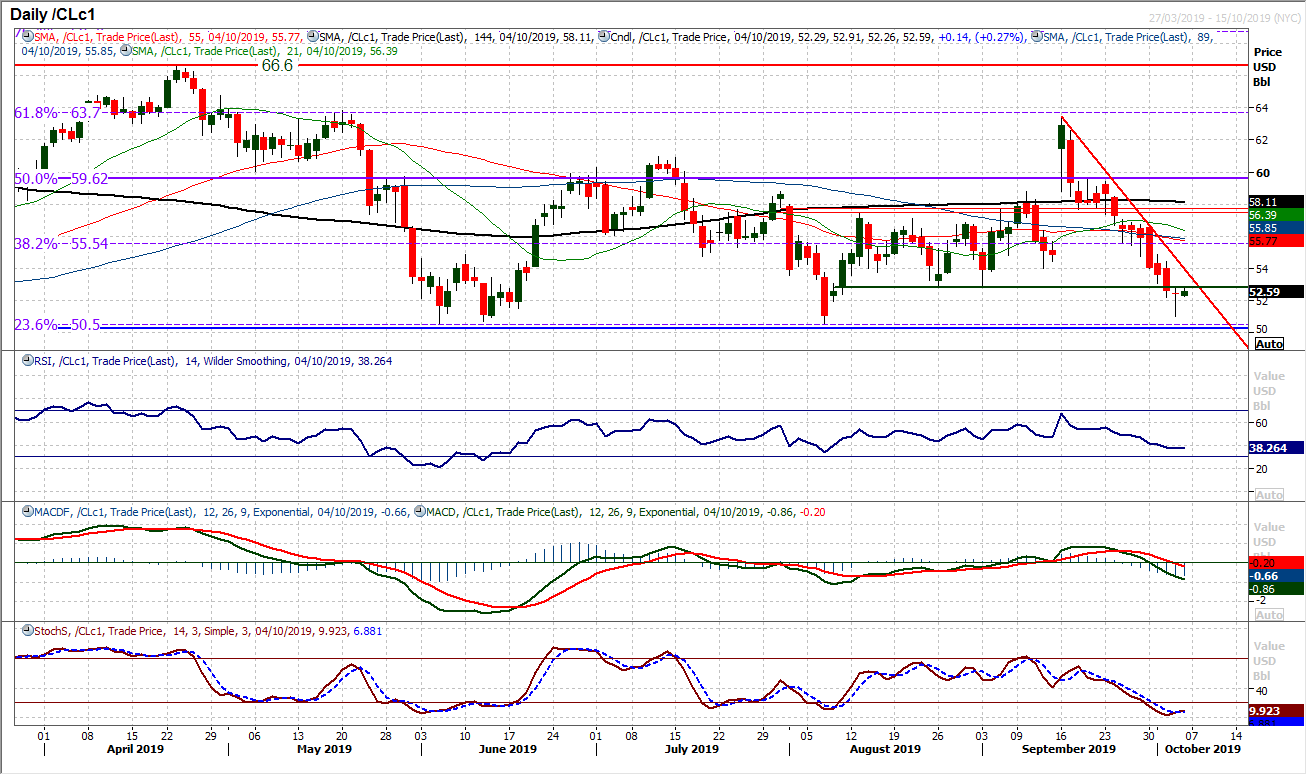
A long tailed doji candlestick is the first sign of positive reaction from the bulls in almost three weeks. Even though the market closed lower on the day, it was the first candlestick that has not been bearish in the past 13 sessions. Is this a sign of exhaustion in the sell-off? We must see the hourly momentum indicators turning positive for that, with more needed right now. The hourly RSI consistently above 60, with hourly MACD above neutral. There is a pivot resistance around $53.00 which also needs to be broken decisively for a price improvement. However, there is further resistance in the band $54.30/$54.80 which needs to be clear to suggest any sustainable traction in a recovery. For now, this recovery needs to be treated with caution, but at least the key support $50.50/$51.00 remains intact.
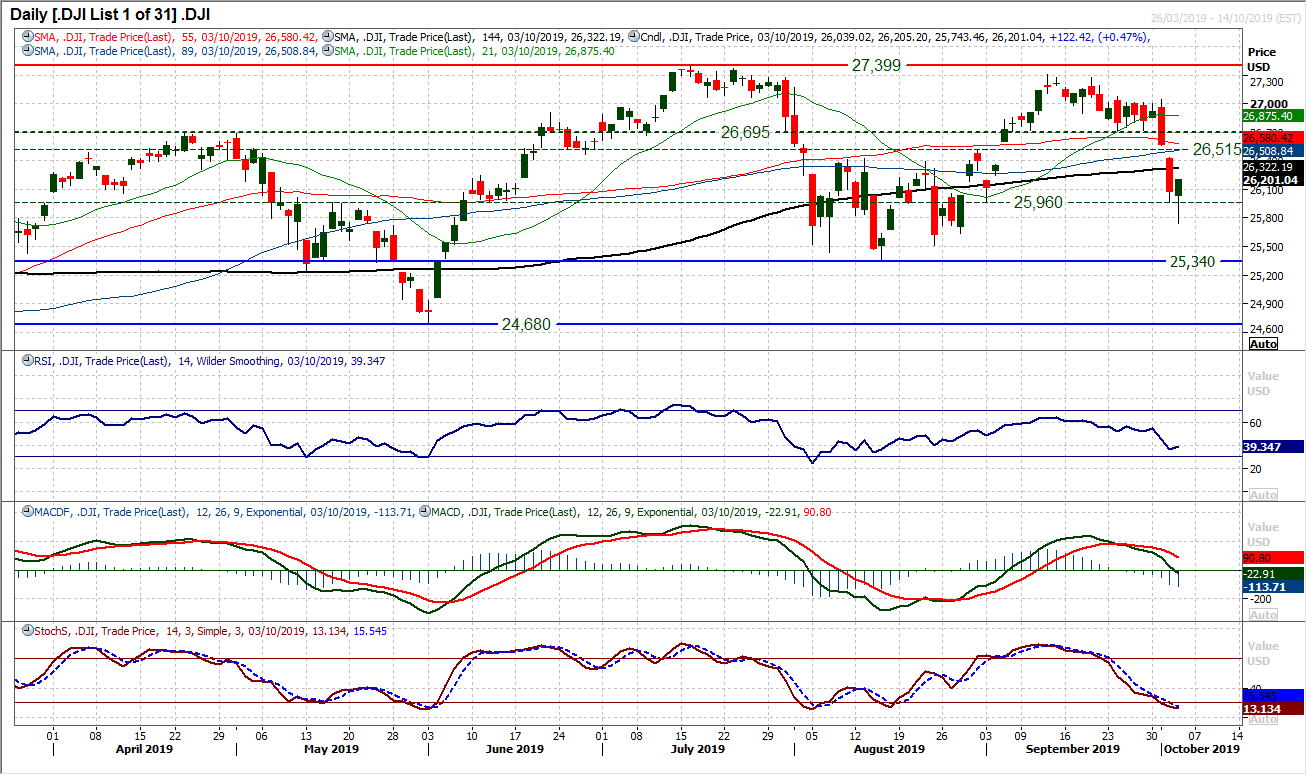
Another tumultuous session on Wall Street with big intraday swings on the Dow. Another session with a daily range (460 ticks) well above the Average True Range (currently increasing at 292 ticks). This time though the bulls have made a fight of it, with a strong rebound into the close to form a decisive recovery candlestick. Given the big reactions to data surprises right now, calling the outlook for Non-farm Payrolls is a tough one. However, up until yesterday’s rebound into the close it was safe to say that the sellers have been in the ascendency. There are now hourly momentum recovery signals that muddy the waters. Despite this though, negative payrolls would be Dow negative. There is initial support at 25,960 above the 25,743 reaction low from yesterday. Resistance at 26,438 with a gap still open at 26,562. How the market responds today could be the real outlook defining moment for the near term positioning.
"""DISCLAIMER: This report does not constitute personal investment advice, nor does it take into account the individual financial circumstances or objectives of the clients who receive it. All information and research produced by Hantec Markets is intended to be general in nature; it does not constitute a recommendation or offer for the purchase or sale of any financial instrument, nor should it be construed as such.
All of the views or suggestions within this report are those solely and exclusively of the author, and accurately reflect his personal views about any and all of the subject instruments and are presented to the best of the author’s knowledge. Any person relying on this report to undertake trading does so entirely at his/her own risk and Hantec Markets does not accept any liability. """
The outlook for the dollar was well set until the ISM data this week which has deteriorated considerably on both manufacturing and services sectors. The data has shaken belief that the US economy can insulate itself from the global slowdown. Slowing to a three year low, the ISM Non-Manufacturing fell to 52.6, suggesting the manufacturing sector contraction is feeding into services too. It is said that the ISM Manufacturing data miss has implications for the global slowdown, whilst the Non-Manufacturing data miss reflects the US domestic economy. This will feed through negatively to the outlook for US GDP. In another worrying development, the Employment component of the ISM data has also fallen sharply to 50.4, barely expanding and at six year lows. This is likely to have negative implications for today’s Non-farm Payrolls report. We have seen higher than expected Weekly Jobless Claims (albeit marginally), whilst the ADP (NASDAQ:ADP) employment missed expectations too. If Non-farm Payrolls also now follow suit it could have significant implications for the prospect of further rate cuts from the Fed this year. The dollar is under pressure and whilst safe havens are benefitting (yen and gold higher, Treasury yields lower), it is also notable to see an improvement in the Aussie too. The outlook for the US economy being the best of a bad bunch is being re-priced. Quite how far that re-pricing goes could depend on Non-farm Payrolls today.
Wall Street rebounded into the close with the S&P 500 +0.6% to 2910 whilst US futures are consolidating in front of a crucial payrolls report. This leaves Asian markets mixed to mildly higher with the Nikkei +0.2%. In European indices there is more of a positive move initially with FTSE futures +0.6% and DAX futures +0.5%. However, traction beyond there may be difficult as caution sets in for payrolls. In forex, there is a continuation of the dollar negative move, although the move is relatively slight into the European session and may be limited, with focus quickly turning to the US jobs data. In commodities, the recovery in gold may be off its highs of yesterday, but still seems to be on course this morning, another +$4 higher. There is even signs of potential recovery on oil, although recent history sees intraday rallies sold into.
After all the concerning signals from economic data this week, today’s Non-farm Payrolls will clearly be of key focus on the economic calendar. The US Employment Situation is at 1330BST with headline Non-farm Payrolls expected to come in at 145,000 (marginally up on the 130,000 in August). Average Hourly Earnings are expected to grow by +0.3% on the month (+0.4% in August) which would see the yearly growth at +3.2% (+3.2% in August). Unemployment is expected to stay at 3.7% (3.7% in August) but with participation rate rising recently (last month to 63.2%) and a tick higher on U6 Underemployment (to 7.2%), if jobs growth comes in low then expect an increase in unemployment.
There are also more Fed speakers today, with Eric Rosengren (voter, hawk) at 1330BST, Chair Jerome Powell at 1900BST, Lael Brainard (voter, dove) at 1910BST and Esther George (voter, hawk) at 2045BST.
Chart of the Day – AUD/USD
A technical rally on AUD/USD in the wake of yesterday’s ISM disappointment, but is it an outlook changer? The immediate test comes with the three week downtrend. This trend line is a confluence of the resistance with near term overhead supply at $0.6735/$0.6760 of the late September lows. The downtrend comes in at $0.6750 today, and given that the bulls are tracking higher, there is a growing appetite to break clear. Momentum indicators are beginning to suggest recovery too, with the Stochastics crossing higher, which is encouraging. For now, the MACD lines have only flattened off, whilst the RSI has ticked higher into the mid-40s. It would need to drive above 50 to really suggest a recovery is sustaining. The key resistance is the $0.6775 high of the bearish engulfing candle from Tuesday. A closing break above $0.6775 would suggest traction in a rebound. This would then open the key resistance band $0.6830/$0.6890. For now though, the bulls need to make their first move, and for that a decisive close above $0.6755 resistance is needed. The hourly chart shows support at $0.6735 and $0.6700 initially.


The reaction to today’s Non-farm Payrolls data could be crucial for the dollar. There has been a weakening throughout this week which has pulled EUR/USD higher within the downtrend channel once more. Normally we would see rallies as being counter to the bigger downtrend and another chance to sell. However, the market has now gained ground for three sessions in a row now (something not seen since early August). Momentum indicators have all turned higher (albeit within their negative medium term configurations) and the rebound is up to the 21 day moving average (often seen as a gauge for the sellers). The market is at a key crossroads, and the hourly chart shows this on the near term outlook too, with the pivot at $1.0965 as a neckline of a base pattern if it can be held today (a recovery target of $1.1050 would be implied if it can hold). The old low at $1.1025 is a confluence with the three month downtrend and is key resistance. A move back under $1.0940 would suggest a loss of the recovery.
With the dollar under corrective pressure, even Cable has shown signs of recovery. Another tick higher and the market has broken the near term trend lower. However, the move remains indecisive, with yet another small candlestick body (the fourth indecisive candle in a row). Brexit factors drove sterling higher, but an intraday test higher above $1.2380 could not hold and the move has retraced again. The hourly chart shows a basis of initial support at $1.2320/$1.2345 which is holding now. Once payrolls are out of the way this afternoon, we will know more about the near term dollar outlook. Cable has had a higher low in each of the past couple of sessions, meaning that $1.2265 is a gauge of note today. A close above $1.2380 would re-engage the recovery momentum.


There are still question marks over the dollar performance following a fairly concerning few sessions for the dollar bulls. There is a growing deterioration in momentum and the support at 106.75 was breached intraday to show that the sellers are on the brink of really taking control. Despite not holding the breakdown below 106.75 into the close, the 106.95 support has been broken and this looks like it is a market in the process of a decisive change of outlook. If there is a second day of a closing breach of 106.95 the confirmation of a top would imply -150 pips of downside target to 105.50. In the least it would suggest a test of the 105.70 September low, but a retreat to the 104.45/105.00 August key lows is possible in due course. The hourly chart shows a resistance band 106.95/107.30 as a near term sell zone. Non-farm Payrolls have the potential to drive significant volatility again today, but a close back under 106.95 today would be a significant negative development.
Gold

The gold rebound continued yesterday, with a third positive close and a move through further resistance. There are significant uncertainties now over just how far this rebound can go, but once again this morning the market trading higher suggests the bounce is not done yet. In the wake of the ISM Non-Manufacturing disappointment, gold shot higher, but turned back from $1518.50, meaning exactly $60 of recovery in less than three sessions. However, given the market slipped back into the close there are questions that the bulls need to answer today. Momentum has turned higher, but not decisively yet and there needs to be more to suggest this sharp rally is sustainable. That could come with Non-farm Payrolls today. The hourly chart shows the break above $1500/$1502 was important and there is a more positive configuration on momentum. This suggests that if the bulls can continue to support the market above $1500 and then build on the support then this move will be outlook changing.
WTI Oil
A long tailed doji candlestick is the first sign of positive reaction from the bulls in almost three weeks. Even though the market closed lower on the day, it was the first candlestick that has not been bearish in the past 13 sessions. Is this a sign of exhaustion in the sell-off? We must see the hourly momentum indicators turning positive for that, with more needed right now. The hourly RSI consistently above 60, with hourly MACD above neutral. There is a pivot resistance around $53.00 which also needs to be broken decisively for a price improvement. However, there is further resistance in the band $54.30/$54.80 which needs to be clear to suggest any sustainable traction in a recovery. For now, this recovery needs to be treated with caution, but at least the key support $50.50/$51.00 remains intact.

Another tumultuous session on Wall Street with big intraday swings on the Dow. Another session with a daily range (460 ticks) well above the Average True Range (currently increasing at 292 ticks). This time though the bulls have made a fight of it, with a strong rebound into the close to form a decisive recovery candlestick. Given the big reactions to data surprises right now, calling the outlook for Non-farm Payrolls is a tough one. However, up until yesterday’s rebound into the close it was safe to say that the sellers have been in the ascendency. There are now hourly momentum recovery signals that muddy the waters. Despite this though, negative payrolls would be Dow negative. There is initial support at 25,960 above the 25,743 reaction low from yesterday. Resistance at 26,438 with a gap still open at 26,562. How the market responds today could be the real outlook defining moment for the near term positioning.

"""DISCLAIMER: This report does not constitute personal investment advice, nor does it take into account the individual financial circumstances or objectives of the clients who receive it. All information and research produced by Hantec Markets is intended to be general in nature; it does not constitute a recommendation or offer for the purchase or sale of any financial instrument, nor should it be construed as such.
All of the views or suggestions within this report are those solely and exclusively of the author, and accurately reflect his personal views about any and all of the subject instruments and are presented to the best of the author’s knowledge. Any person relying on this report to undertake trading does so entirely at his/her own risk and Hantec Markets does not accept any liability. """
