Market Overview
A basis of consolidation on markets in recent days is beginning to edge towards minor dollar strength again. This comes as Treasury yields have started to pick up. Even though the 2s/10s spread is still around zero, both yields are around 5 basis points higher today after hawkish comments from a couple of FOMC members yesterday (Esther George and Patrick Harker). It will be interesting to see if these comments are a harbinger to the crucial speech from Fed chair Jerome Powell today at Jackson Hole.
The FOMC minutes pointed to a split on the committee over the direction of rates, and certainly George and Harker are at the hawkish end of the argument. Neel Kashkari (perma dove) spoke earlier in the week of further cuts though sits at the other end of the scale. Powell has a fine balancing act today and may look to be non-committal. The phrase to look for is “mid-cycle adjustment”. If this is not a part of his speech then the market will take it as relatively dovish.
Recent ranges across forex majors and also gold could well have their outlook defined by today’s speech. That aside, sterling is also in key focus as Brexit seems to be hot topic again. British Prime Minister had the ball hit back into his court (with interest) in the past couple of days with constructive comments from Germany’s Merkel and France’s Macron.
Can Mr Johnson come up with a viable alternative to the Irish Backstop? The problem is that this could well be the European leaders playing great politics, knowing that an alternative is highly controversial, whilst also knowing there is far more in the Withdrawal Agreement that is unpalatable for UK MPs to pass. Johnson has been looking to scapegoat the EU for a no deal Brexit. He may have had his bluff called. Sterling jumped yesterday, but is already showing signs of bull failure. We fear the rally will fade once more.
Wall Street closed mixed last night with minor gains on the Dow (+0.2) whilst the S&P 500 was down -0.1% at 2923. However, with US futures showing a decent open (+0.5% currently) Asian markets have been showing decent gains with the Nikkei +0.4% and Shanghai Composite +0.6%. European markets are looking for positive opens too with FTSE futures and DAX Futures +0.7%.
In forex markets, the major pairs show a USD positive bias with sterling dropping back but still above $1.2200. The NZD has jumped by +0.4% after RBNZ Governor Orr said that he could afford to wait on monetary policy. In commodities the dollar positive theme is a minor drag on gold, whilst oil is marginally higher.
There is not much on the economic calendar to look for today aside from the US New Home Sales at 15:00 BST (the same time that Powell speaks) which are expected to show a very mild improvement to 649,000 in July (up from 645,000 in June). The big focus will though undoubtedly be Fed chair Jerome Powell who speaks at the Jackson Hole Economic Symposium at 15:00 BST.
Chart of the Day – EUR/GBP
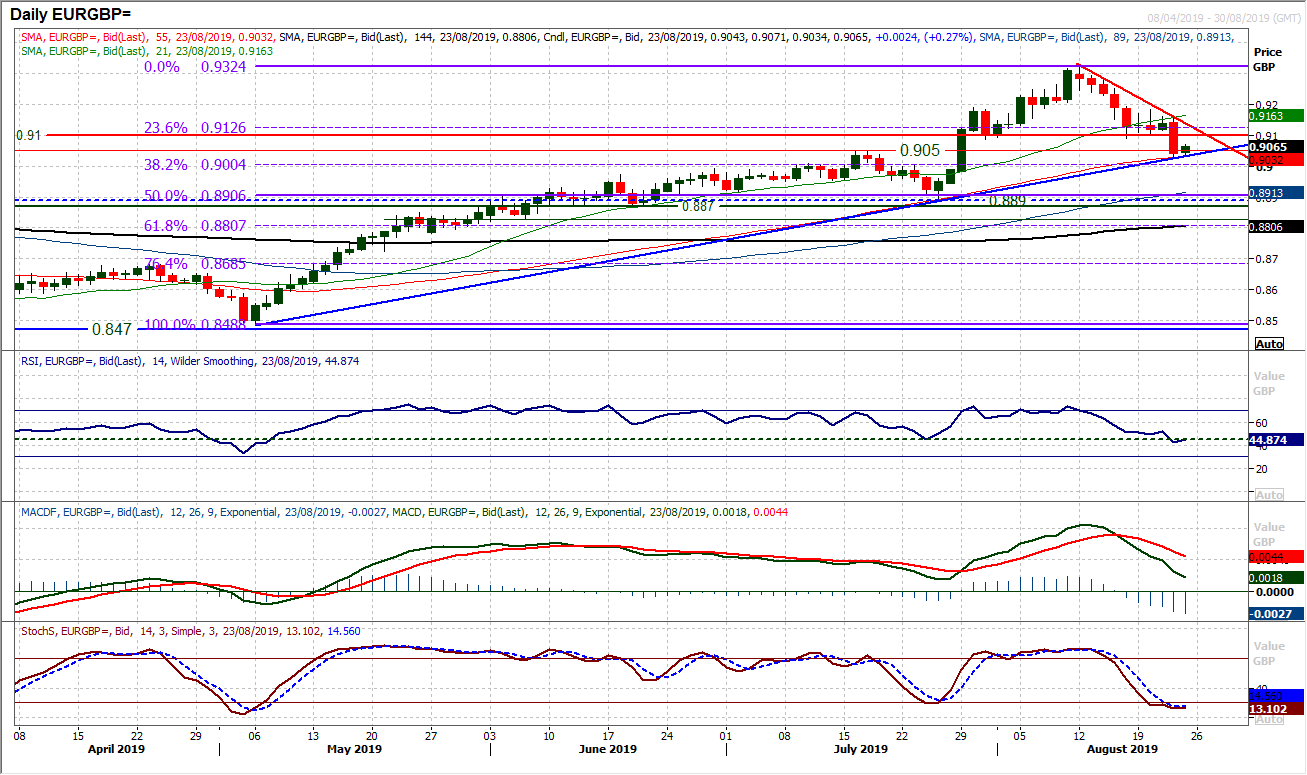
Sterling has been in recovery mode against the euro in the past couple of weeks, but craned it up a notch yesterday. Constructive comments from Merkel and Macron on the Irish Backstop drove a strong bear candle on EUR/GBP. This now brings the technicals back to a crucial crossroads. A 15 week uptrend is being tested (comes in around £0.9030 today) with the 55 day moving average (which supported the July correction) also coinciding at these levels. The market has also now unwound to the breakout support at £0.9050. What is interesting about the momentum of this move is that the RSI is at a 15 week low, whilst the Stochastics are also at their most negatively configured for 15 weeks and MACD lines are decisively accelerating lower. A closing breach of this support area £0.9030/£0.9050 opens £0.9000 initially (psychological and also a 38.2% Fibonacci retracement of the £0.8488/£0.9324 rally) but the intensity of the breakdown, would mean the next key support band is £0.8870/£0.8890. Initial reaction today is consolidation at the crossroads. There is overhead supply now at £0.9090 with a downtrend falling around £0.9135 today.
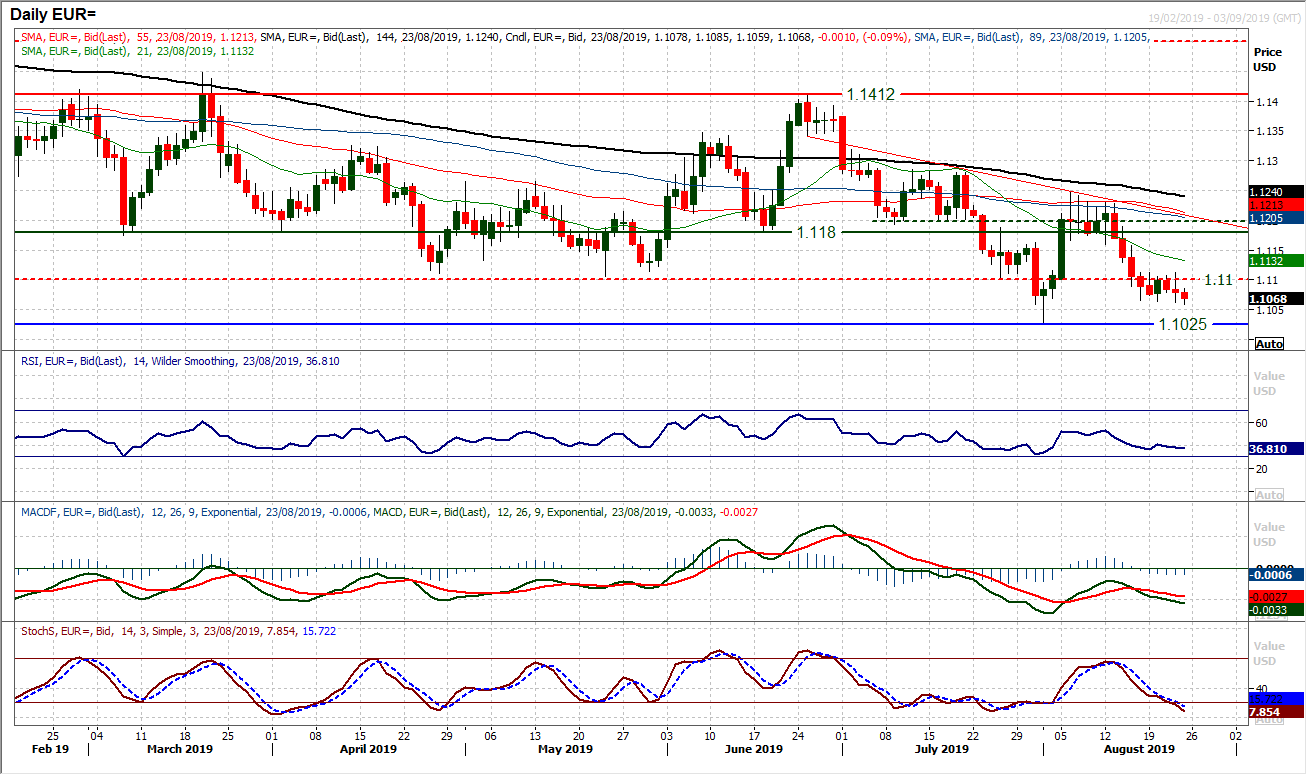
The euro continues to struggle against the dollar and the negative drift on EUR/USD continues to drag lower. The market has continually struggled in the resistance band $1.1100/$1.1120 throughout this week as another negative candle formed yesterday. This shows intraday rallies continue to be sold into. Breaching the support around $1.1065 has not been decisive but the key August low at $1.1025 is open now. The lack of conviction in the downside move is though reflected in the hourly chart where the momentum signals are still indicative of a range play. This is really just a consolidation in front of Jerome Powell’s speech today, after which EUR/USD is likely to find far more direction.
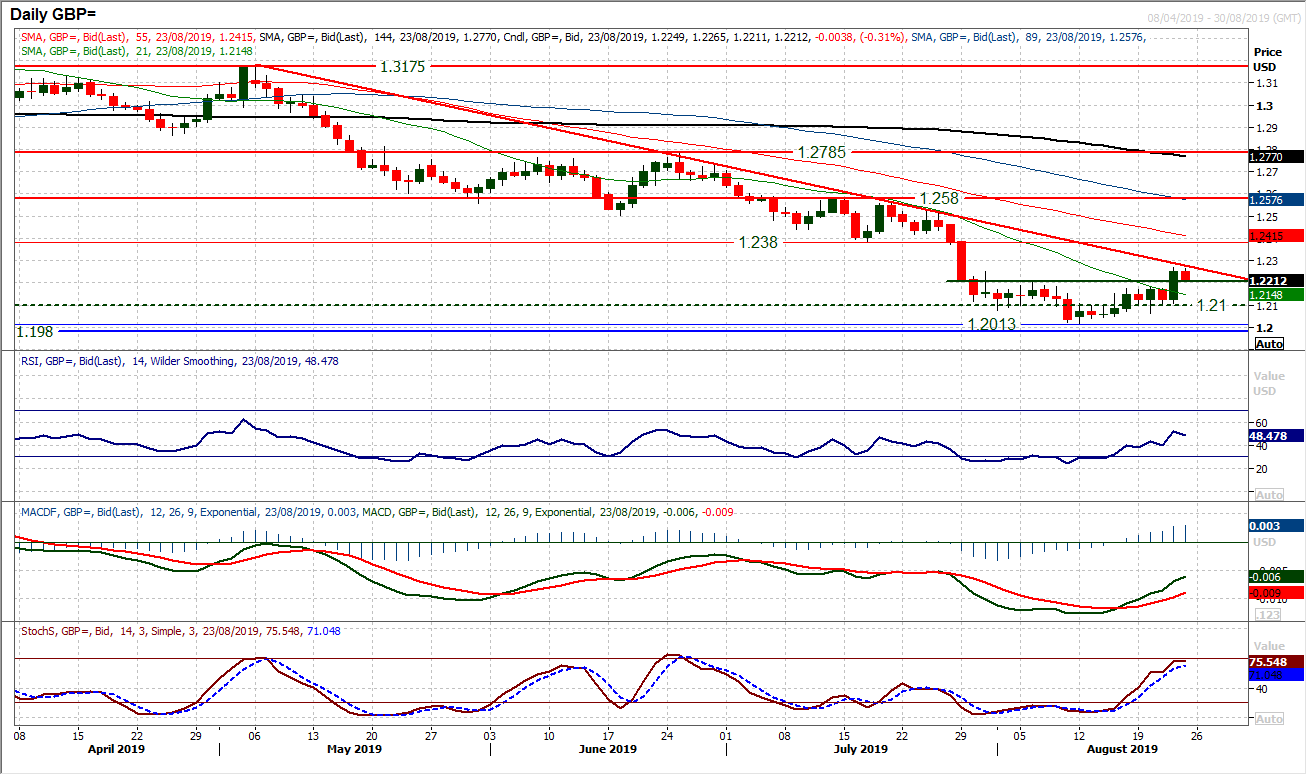
Sterling caught a bid yesterday as Merkel and Macron opened the door slightly to some potential compromise over the Brexit Withdrawal Agreement. Cable added around 120 pips into the close and pulled decisively above 1.2200for a four week high. We have been talking about the resistance at $1.2250 but it could not be breached into the close and with the resistance of a 16 week downtrend (today at $1.2275) this rally needs to post another positive candle today to suggest the bulls have recovery traction. The early slip back just questions the longevity of yesterday’s attempted breakout. A close back under $1.2200 would be considered a bull failure. The bulls need a breach of the downtrend which would open upside again, with very little resistance until $1.2380. With the momentum indicators either improving (MACD) or at a crossroads (RSI around 50), this is an important session for the near term outlook.
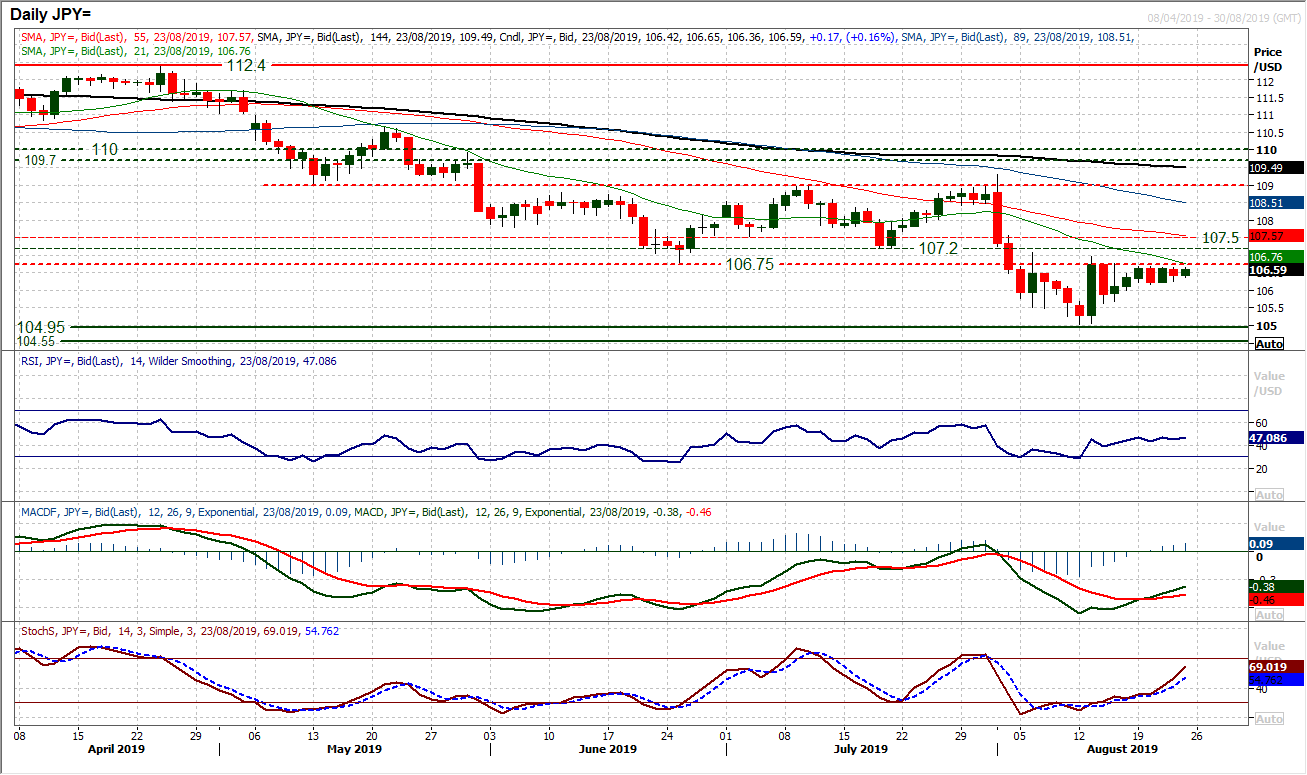
The consolidation continues on Dollar/Yen as the market looks firmly towards today’s speech by Fed chair Powell for direction. The tight range between 106.15/106.70 throughout this week is likely to finally find some direction in the wake of the speech. In front of this though, the technical suggest rallies are a struggle and the overhead supply between 106.75/107.50 being restrictive to any bull move. Closing under 106.15 would open 105.65 initially but a move back towards 105.00 would be likely in due course. This would come on any dovish confirmation from Powell. The flip side of this is Powell shunning talk of decisive rate cuts, and this would pull the pair higher. A close above 107.50 opens the prospect of a recovery.
Gold
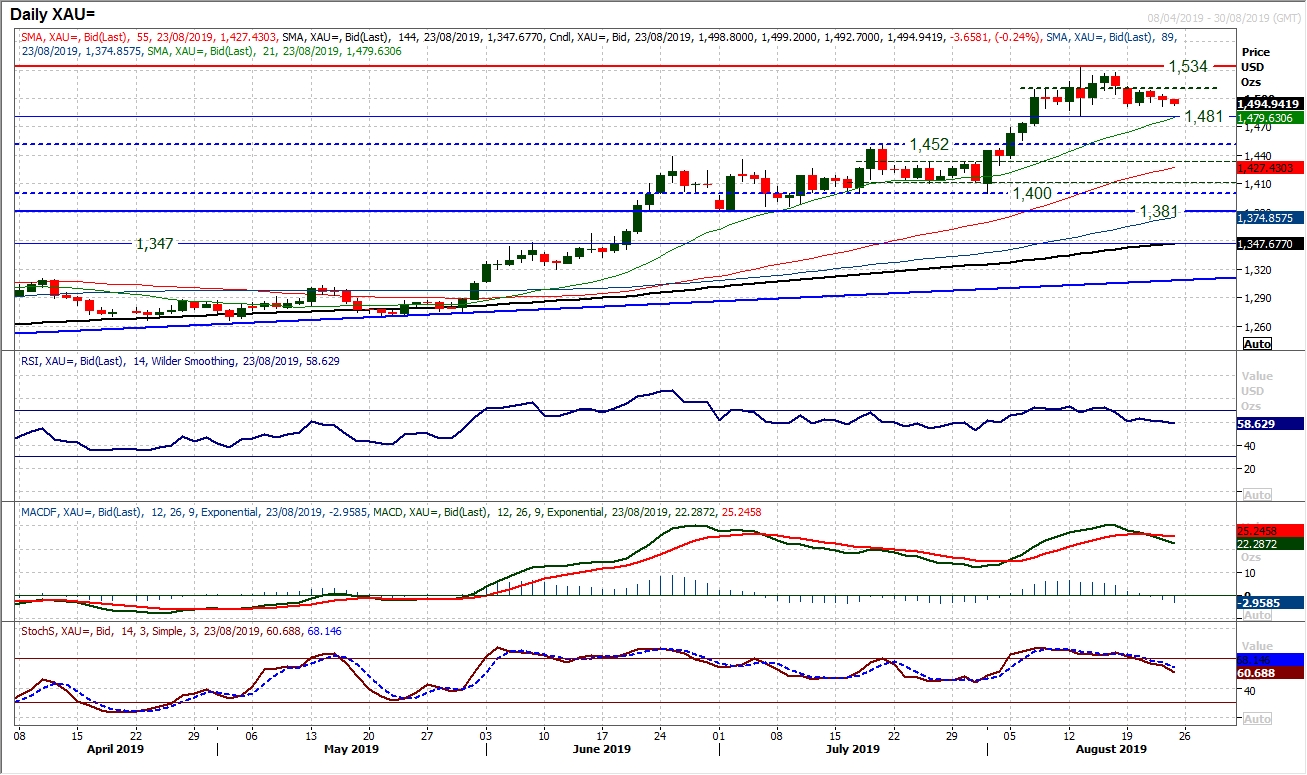
The bulls continue to defend the near term support around $1492 as yesterday’s intraday test managed to just hang on to the support. This helps to maintain the range of the past two weeks between $1481/$1534. However, there is still a marginal negative bias to this consolidation ahead of Jerome Powell’s speech this afternoon. A couple of negative candles in a row since the mid-range pivot at $1510 capped the gains earlier in the week are beginning to open the prospect of this consolidation turning into a top pattern. For now though, we continue to view this as a range that the bulls will support. Momentum indicators are on the drift lower in a manner similar to what was seen during the June/July ranges. This comes despite the bear cross on MACD lines (again similar to June/July). However, caution should be taken as a closing breach of $1481 would open a near term correction. Fed chair Powell at Jackson Hole could have a significant impact on the outlook.
WTI Oil
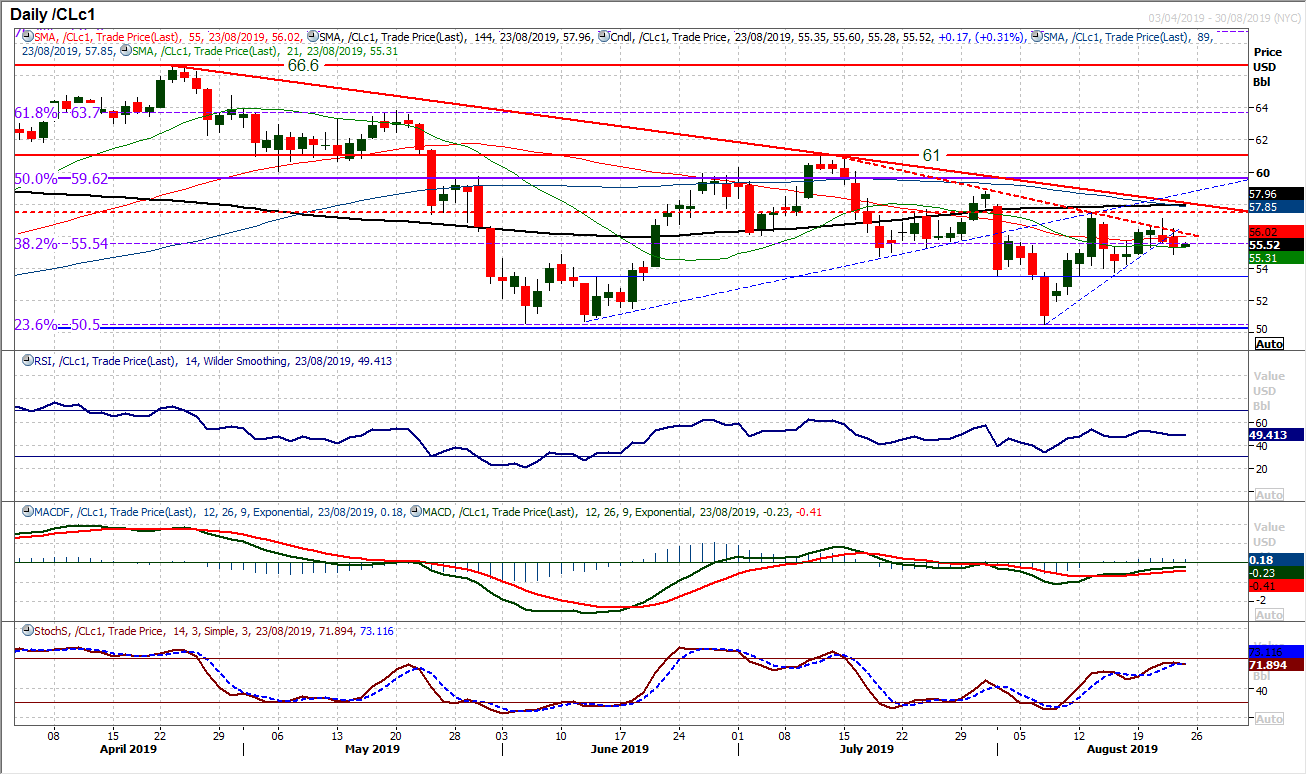
In recent months we have repeatedly seen near term rallies on oil which fade after a week or two. Once more, with the resistance around $57.50 on WTI being held this week, a slip back has broken a two week recovery uptrend. The market looks to be forming another lower high. Momentum indicators have been configured negatively and are still suggesting that near term rallies will struggle. A couple of negative candles in a row are beginning to shape the market lower again. Leaving resistance at $57.15/$57.50 the market is now testing the $55.55 pivot around the 38.2% Fibonacci retracement. A Decisive close below opens the higher low at $53.75.
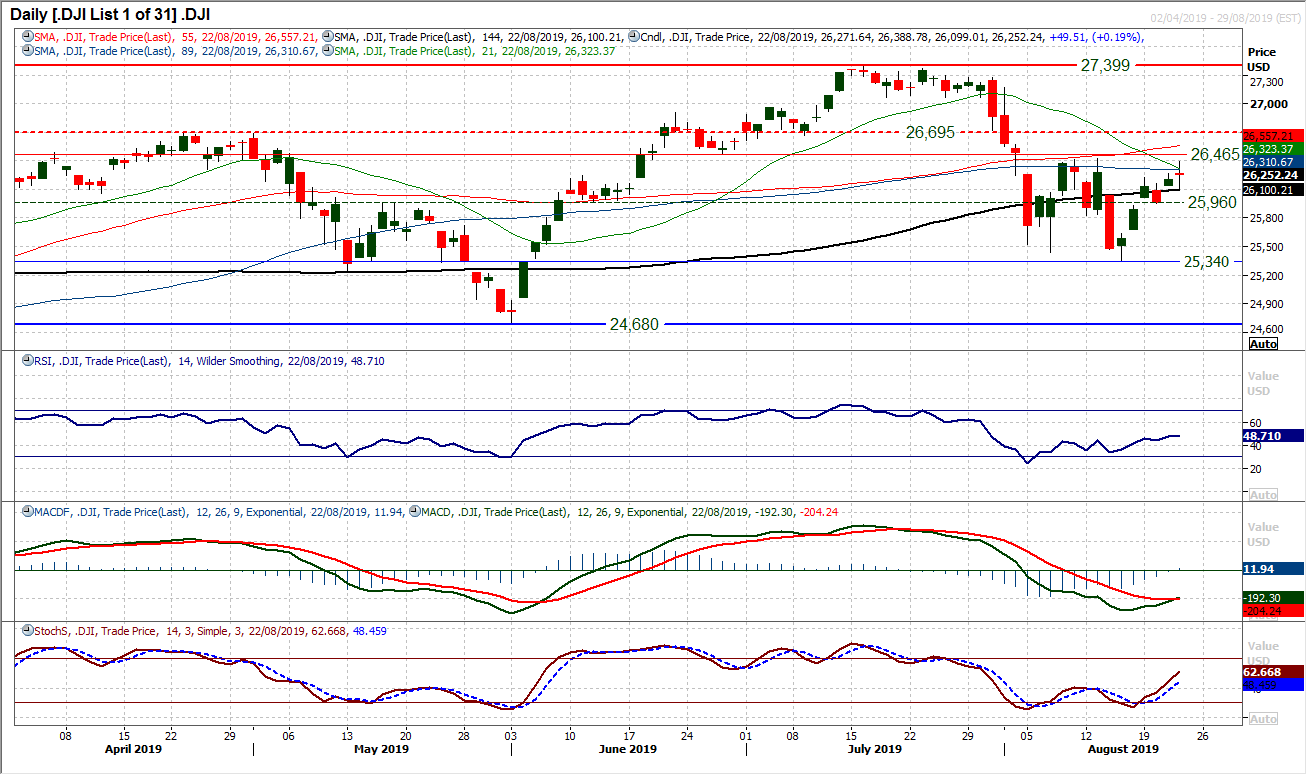
The Dow continues to creep higher as a test of the key near to medium term resistance band 26,425/26,465 looms. However yesterday’s candle reflects a somewhat cautious market coming into today’s session. This is understandable, given the potential importance and outlook defining speech by Jerome Powell at Jackson Hole (at 1500BST, just after the Wall Street open). There has though been a trend of improvement in the past week which is pulling momentum indicators higher as the Stochastics and RSI call for upside breaks of the resistance and MACD lines threaten to bull cross. This is a market very much therefore at a crossroads. This three week range 25,340/26,425 could turn into a base pattern with a strong bull candle today. A closing break above 26,465 would confirm a move towards the next resistance 26,695 and potentially back towards the highs again. The hourly chart though suggests caution, with stuttering momentum having built up. Initial support at 26,100 but below 25,960 sees the bears back in control of the range.
"""DISCLAIMER: This report does not constitute personal investment advice, nor does it take into account the individual financial circumstances or objectives of the clients who receive it. All information and research produced by Hantec Markets is intended to be general in nature; it does not constitute a recommendation or offer for the purchase or sale of any financial instrument, nor should it be construed as such.
All of the views or suggestions within this report are those solely and exclusively of the author, and accurately reflect his personal views about any and all of the subject instruments and are presented to the best of the author’s knowledge. Any person relying on this report to undertake trading does so entirely at his/her own risk and Hantec Markets does not accept any liability. """
