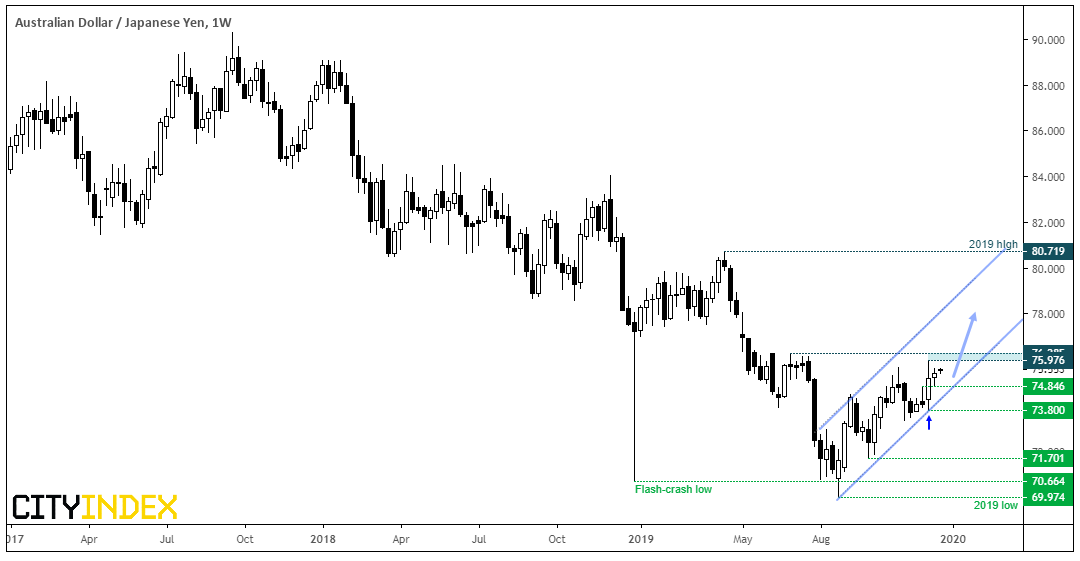
AUD/JPY: A bullish channel has been developing on the weekly chart, since AUD/JPY failed to close the week below January’s flash-crash low in August. Moreover, a bullish outside week marks a swing low at 73.80 and prices are now consolidating below December’s high. From here, we’d take a break above 76.30 as a warning of a trend reversal.
Obviously, it would also assume risk-on sentiment was broadly spread. As we head into 2020 there are concerns over the repo market, despite the Fed pumping billions into it for the new year. So be mindful that we could see bouts of a volatility across markets if a funding squeeze occurs. Remember, it was early January that we saw the yen flash crash which saw the daily range span that of a year. But if the Fed do manage to keep the issues contained, AUD/JPY could be off to a brighter start to the year.

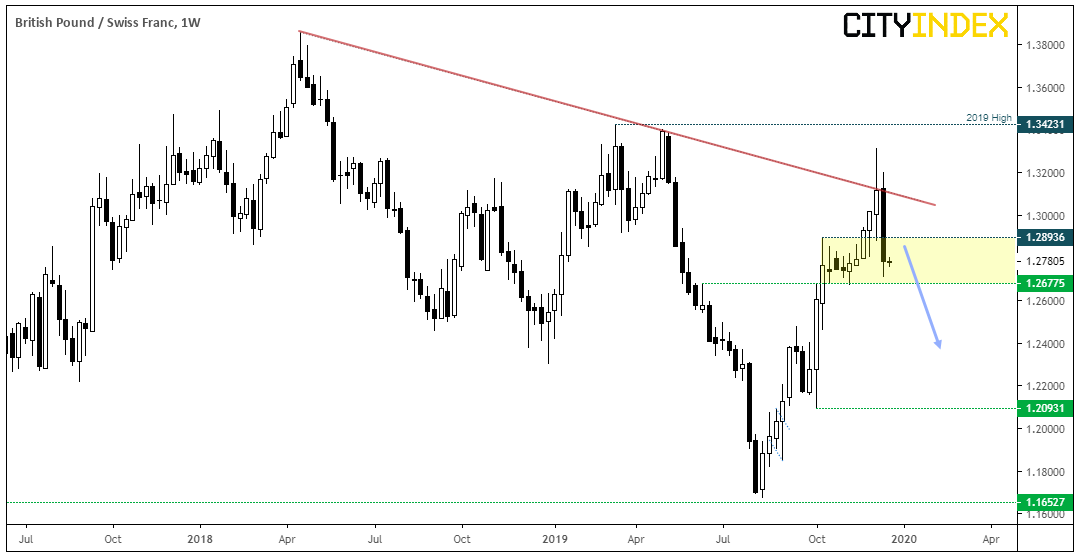
GBP/CHF: Last week’s bearish engulfing candle suggests we may have seen a significant top on the pair. Which is interesting, as that would suggest we’re headed towards a hard Brexit (and therefor a dovish BOE). Still, it failure to hold above the trendline and clear momentum shift are worth noting.
The decline has stalled above 1.2677 support and we’d expect prices to consolidate over the coming week/s. We may even see a pullback within the 1.2677 – 1.2894 range. However, if we see a clear break beneath 1.2677

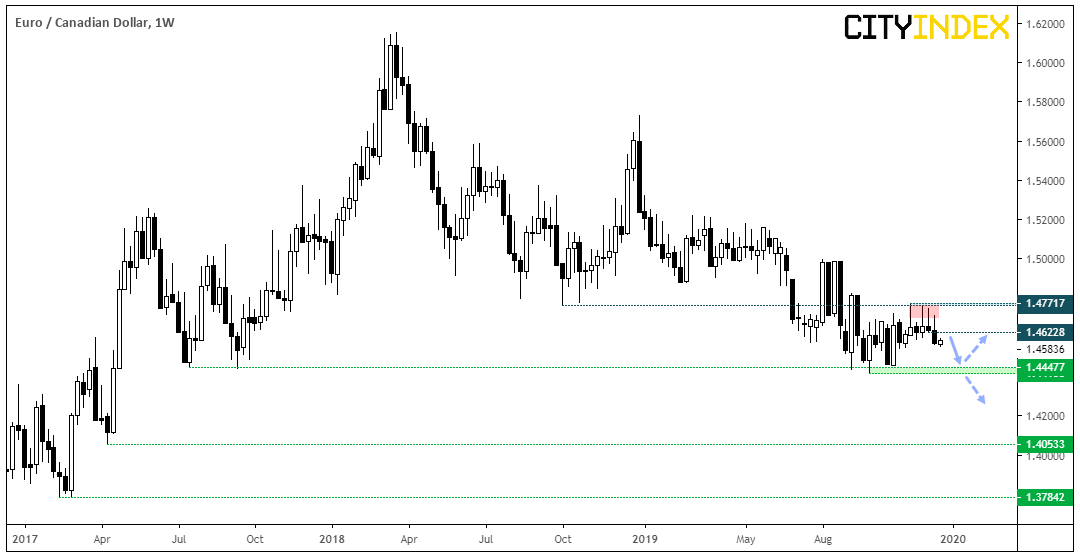
EUR/CAD: A series of tall upper shadows shows that there’s plenty of supply around 1.4770. After printing three bearish hammers over four weeks, last week saw a break lower to confirm the reversal patterns and now prices appear set to retest lows around 1.4440.
As price action has generally been choppy since June, its to yet clear whether it has the energy to break to new lows. But if it can break below 1.4400 it brings the lows around 1.4053 into focus.

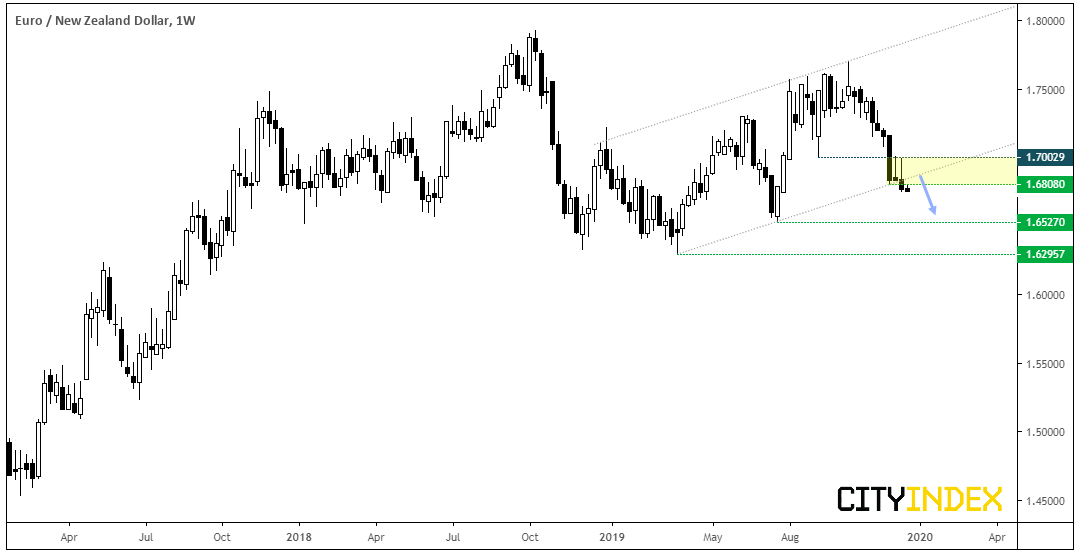
EUR/NZD: We finally saw it break out of range on Friday which allows the week to close beneath the bullish trendline.
Form here it looks like a run for 1.6527 is on the cards, although we’d also expect prices to consolidate over the next few weeks. Regardless, bias remains bearish whilst prices trade below 1.7000.
Disclaimer: The information and opinions in this report are for general information use only and are not intended as an offer or solicitation with respect to the purchase or sale of any currency or CFD contract. All opinions and information contained in this report are subject to change without notice. This report has been prepared without regard to the specific investment objectives, financial situation and needs of any particular recipient.
Any references to historical price movements or levels is informational based on our analysis and we do not represent or warrant that any such movements or levels are likely to reoccur in the future. While the information contained herein was obtained from sources believed to be reliable, the author does not guarantee its accuracy or completeness, nor does the author assume any liability for any direct, indirect or consequential loss that may result from the reliance by any person upon any such information or opinions.
