Get 40% Off
⚠ Earnings Alert! Which stocks are poised to surge?
See the stocks on our ProPicks radar. These strategies gained 19.7% year-to-date.
Unlock full list

Chart Of The Day: No Clues From S&P 500 Futures About Index's Next Direction

Published 19/02/2020, 13:30
Updated 02/09/2020, 07:05

Earlier today, expectations began to build around the probability that China would soon be increasing economic stimulus measures. Asian markets along with futures contract, including for the S&P 500 rose.

Can we rely on headline-driven optimism to provide the catalyst for a jump into stocks? Not necessarily.

Note that the S&P 500 Index alternated between gains and losses every single day since last Wednesday’s all-time high for the benchmark. Taking this into consideration would indicate that positive headlines don't necessarily trigger anything more than fleeting exuberance—which hasn’t been helping the market figure out a direction.

Perhaps the technical chart can offer some clarity.
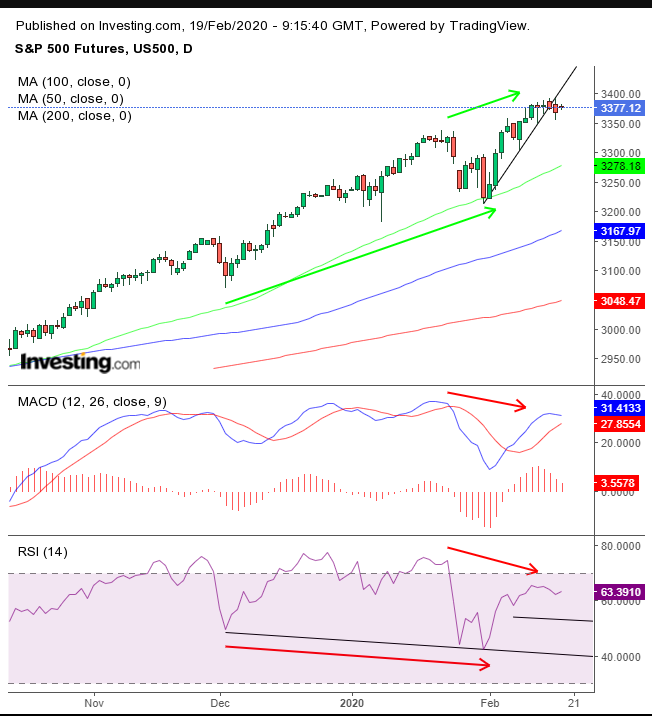
SPX Futures Daily

S&P 500 futures fell yesterday, below the most recent uptrend line, since the Jan. 31 low.

At the same time, both the MACD and the RSI provided negative divergences, revealing that the January-to-February peaks were not backed up by a broad price range, nor by momentum. These are bearish indicators.

When this occurs in tandem with the price falling below its uptrend line, investors should pay attention, at least till there's more understanding of the coronavirus' impact and its affect on the chart.

Trading Strategies

Conservative traders would wait for the price to make a new high, followed by a retest of the uptrend line, to keep riding the trend.

Moderate traders may wait for a new high followed by another corrective move for a better entry, not necessarily for trend veracity. Alternatively, they would short if the price fell below 3,350, then failed to rally back above that level.

Aggressive traders may short at will, provided they understand the risks and drew up an appropriate trading plan, one they would stick to.

Trade Sample

  • Entry: 3,378

  • Stop-Loss: 3,382

  • Risk: 4 points

  • Target: 3,366

  • Reward: 12 points

  • Risk:Reward Ratio: 1:3

Latest comments

Risk Disclosure: Trading in financial instruments and/or cryptocurrencies involves high risks including the risk of losing some, or all, of your investment amount, and may not be suitable for all investors. Prices of cryptocurrencies are extremely volatile and may be affected by external factors such as financial, regulatory or political events. Trading on margin increases the financial risks.
Before deciding to trade in financial instrument or cryptocurrencies you should be fully informed of the risks and costs associated with trading the financial markets, carefully consider your investment objectives, level of experience, and risk appetite, and seek professional advice where needed.
Fusion Media would like to remind you that the data contained in this website is not necessarily real-time nor accurate. The data and prices on the website are not necessarily provided by any market or exchange, but may be provided by market makers, and so prices may not be accurate and may differ from the actual price at any given market, meaning prices are indicative and not appropriate for trading purposes. Fusion Media and any provider of the data contained in this website will not accept liability for any loss or damage as a result of your trading, or your reliance on the information contained within this website.
It is prohibited to use, store, reproduce, display, modify, transmit or distribute the data contained in this website without the explicit prior written permission of Fusion Media and/or the data provider. All intellectual property rights are reserved by the providers and/or the exchange providing the data contained in this website.
Fusion Media may be compensated by the advertisers that appear on the website, based on your interaction with the advertisements or advertisers.
© 2007-2024 - Fusion Media Limited. All Rights Reserved.