Market Overview
Market Overview
There is a sense that major markets are taking a breather after a few weeks of trading where Brexit this and trade dispute that have been pulling markets here and there. Attention is turning towards the big three central banks that hold their latest monetary policy meetings in the next week. Today the focus is on the outlook for the Eurozone and the ECB. The Eurozone economy has been hit by the double whammy of the global slowdown, accelerated by the US/China dispute and having the uncertainty of Brexit hanging over its head. The growth outlook has suffered as a result.
Flash PMIs are out today and are expected to show the continued stagnation of economic output. A composite PMI a hairs breadth into expansion territory last month (at 50.1) is only expected to be marginally improved but still suggesting the need for support.
The ECB meeting today is likely to be more about justifying the package of easing action taken at the last meeting six weeks ago. We do not expect any fireworks in what will be the final meeting for Mario Draghi before his eight year tenure as ECB President draws to a close. Expect one final plea to Eurozone governments to help with the heavy lifting and engage fiscal stimulus. This is unlikely to be a meeting therefore that can break the consolidation that has set in across major markets. Bond yields have stabilised, whilst the euro, yen and gold are all muted. Another Brexit policy shift, or significant development in the trade story may shake markets from consolidation in front of next week’s Fed meeting. The ECB though will be little more than a fond farewell to Draghi.
Wall Street closed in marginal positive territory last night with the S&P 500 continuing to fluctuate around 3000, climbing +0.3% into the close of 3005. US futures are all but flat today. Asian markets were again mixed, with the Nikkei +0.6% whilst the Shanghai Composite was -0.3%. In Europe, FTSE 100 Futures are around the flat line, whilst DAX Futures are mildly higher by +0.2%.
In forex, there is a continuation of the consolidation of recent sessions, although a very slight negative bias has formed with AUD and NZD slipping, whilst JPY is a mild outperformer.
In commodities, the recent tick higher on gold has held ground, whilst oil is just given back some of yesterday’s sharp gains.
The flash PMIs for October dominate the economic calendar early European session, but the ECB is key today. The Eurozone flash Manufacturing PMI is at 09:00 BST and is expected to improve marginally to 46.1 (from a final reading of 45.7 in September) whilst Eurozone flash Services PMI is expected to also pick up to 51.9 (from a final September reading of 51.6). This would be enough to see the Eurozone flash Composite PMI tick higher to 50.3 (from 50.1 in September).
The European Central Bank monetary policy is at 12:45 BST which is expected to show no change to the deposit rate (of -0.50%) or the renewed asset purchases (€20bn per month). Mario Draghi’s final press conference as ECB President is at 13:30 BST.
For the US data, Durable Goods Orders are at 13:30 BST which are expected to show the core, ex-transport orders are expected to have fallen by -0.2% in September (following growth of +0.5% in August). Weekly Jobless Claims at 13:30 BST are expected to be at 215,000 (from 214,000 last week). New Home Sales are at 15:00 BST and are expected to drop by -0.7% to 701,000 in September (from 713,000 in August).
Chart of the Day –NZD/US:D
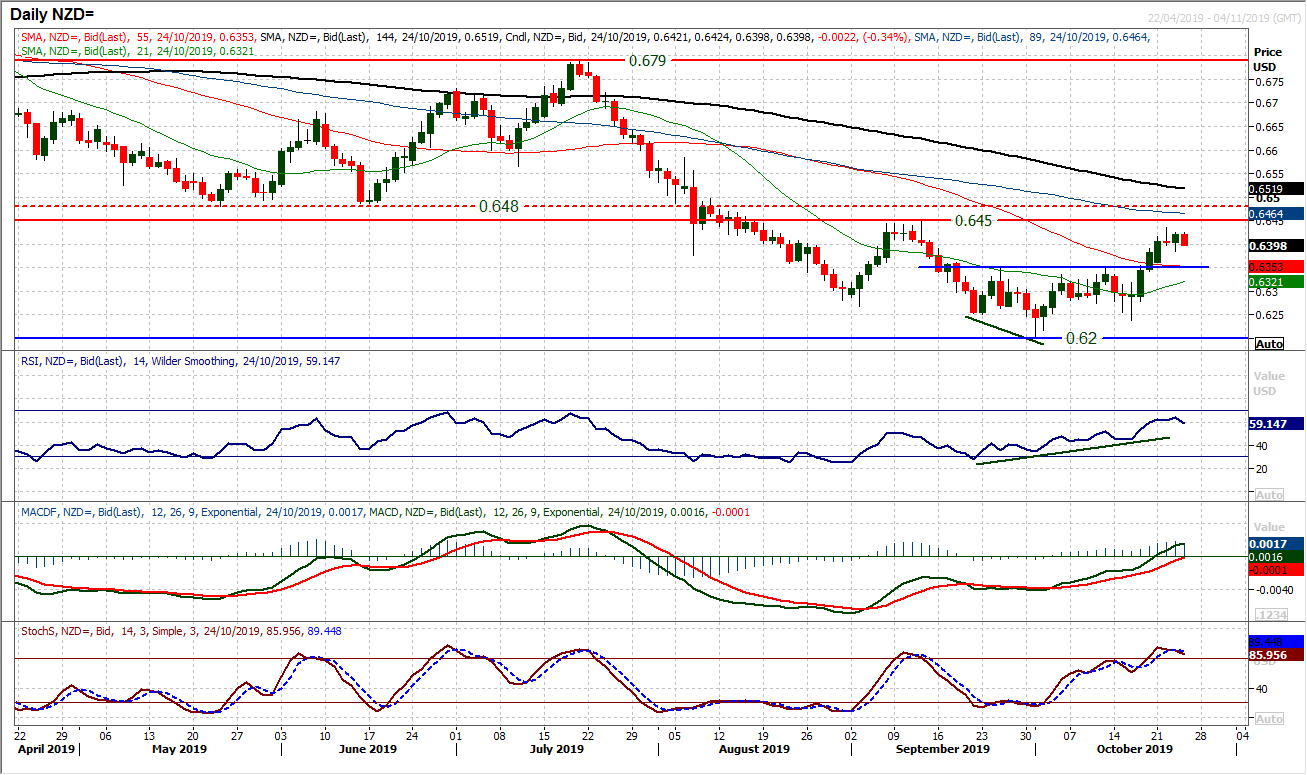
The Kiwi has been performing well now for about a week now. Having already seen positive momentum divergences in early October, a recovery has developed. A breakout above $0.6350 implies 150 pips of gains (towards $0.6500) and has placed the market on course to at least test key resistance of the long term pivot band $0.6450/$0.6480. Corrections are now a chance to buy for this move. The bulls are in an increasingly solid position with the RSI around 60 whilst Stochastics are strong and MACD lines are rising towards a position above neutral and at a twelve week high. Effectively this all suggests that the $0.6450 resistance will at least now come under pressure. Initial resistance is at $0.6435 but a close above $0.6480 would be a key outlook changing break. The strength of momentum suggests that corrections are now a chance to buy. Yesterday’s low at $0.6385 is initial support with the neckline at $0.6350 is now key.
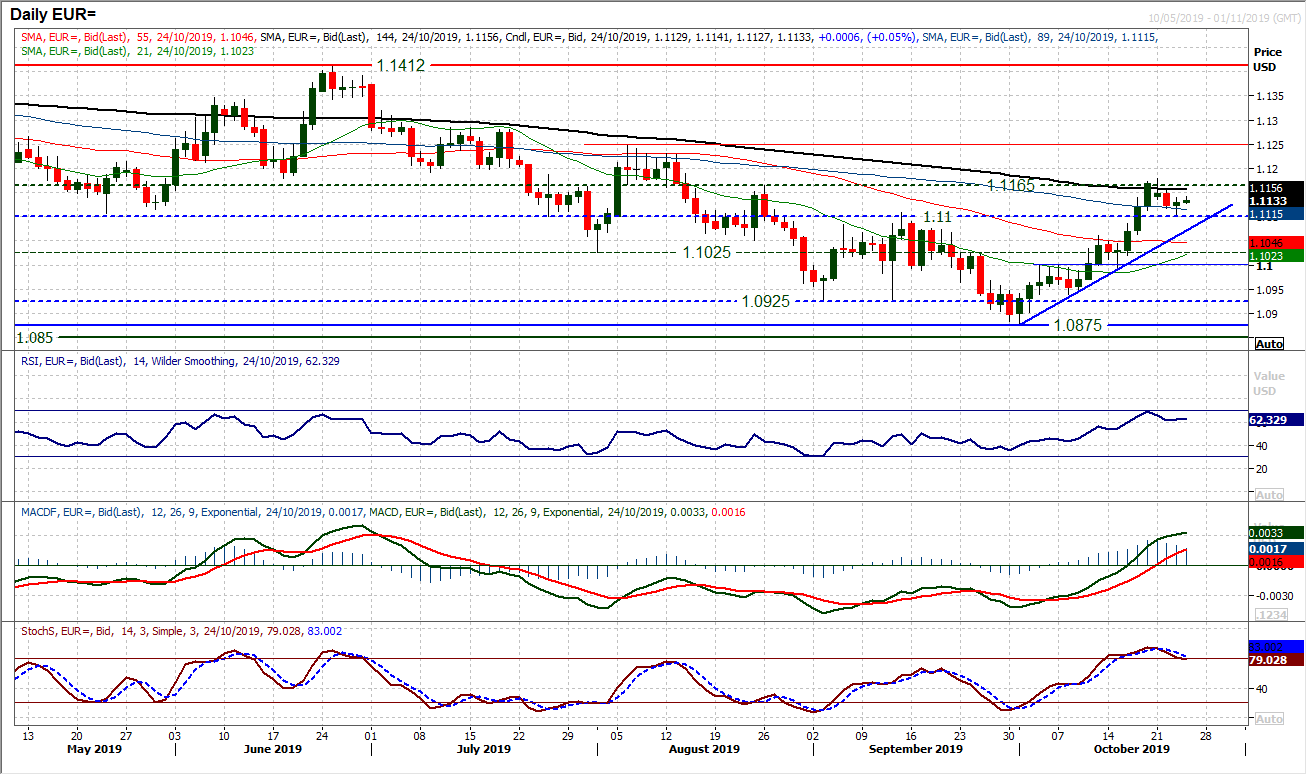
The euro has settled into a holding pattern ahead of the ECB meeting today. With a slide back to leave resistance at $1.1165/$1.1180, EUR/USD has unwound within the recent recovery trend. We have been discussing the importance of the market finding another higher low between $1.1075/$1.1100 and it was interesting to see yesterday’s low a shade above $1.1100. The support of a three week uptrend comes in at $1.1075 today to add to this confluence. Momentum remains strongly configured for little corrections to now be seen as an opportunity for the bulls rather than a threat. RSI is holding above 60, MACD lines rise above neutral and Stochastics are around 80. Getting past the ECB meeting today with these levels intact would be a real sign of more stable ground for the recovery. Above $1.1180 opens $1.1250.
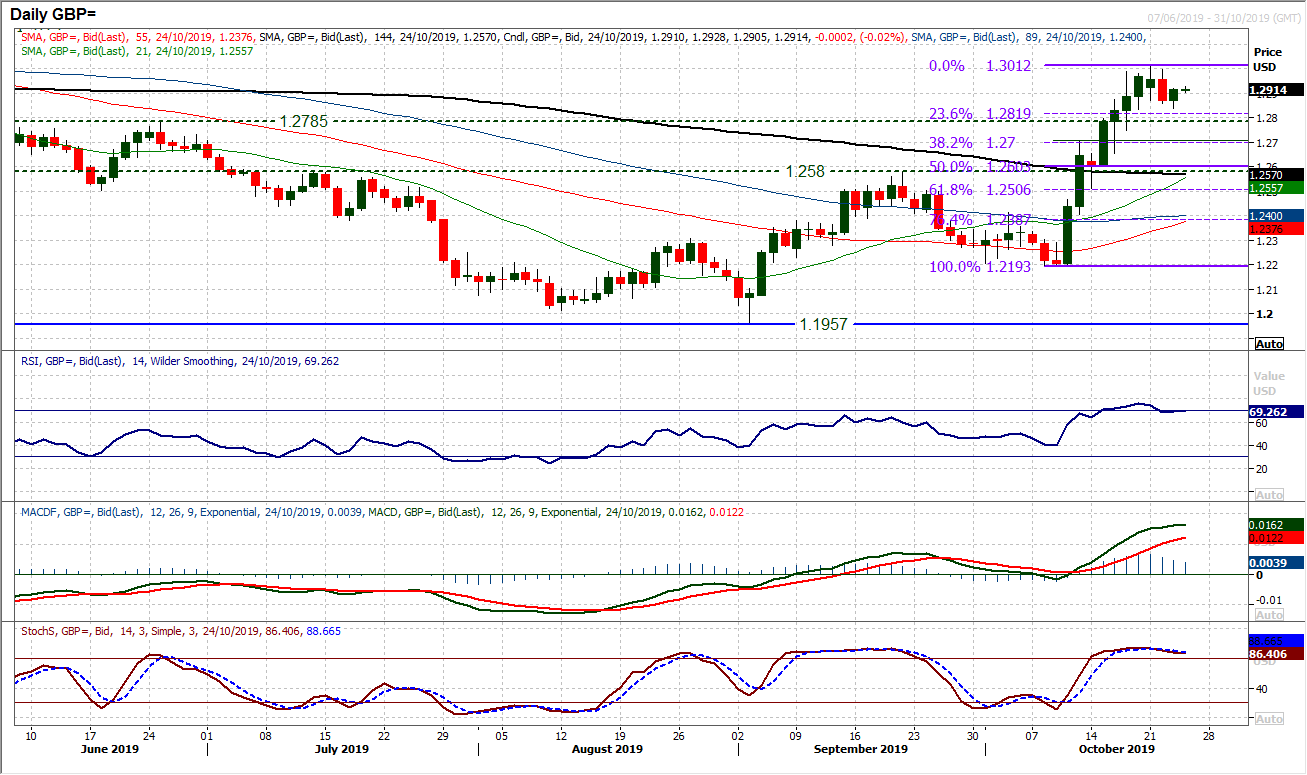
The bull run may have lost its way in recent days, but the bulls are still willing to sit in their positions. Yesterday’s candle was a strong reaction to the threat of initial profit taking. A rebound back above $1.2900 shows a degree of fight and a market in consolidation rather than near term correction. Political moves around the next step in the Brexit saga will be a key driver of the next move on Cable, but for now the technicals are developing a consolidation. Yesterday’s low at $1.2840 is initial support whilst the 23.6% Fibonacci retracement of the bull rally sits at $1.2820 and is an initial gauge for how a correction could develop. Resistance around $1.3000/$1.3010 is key.
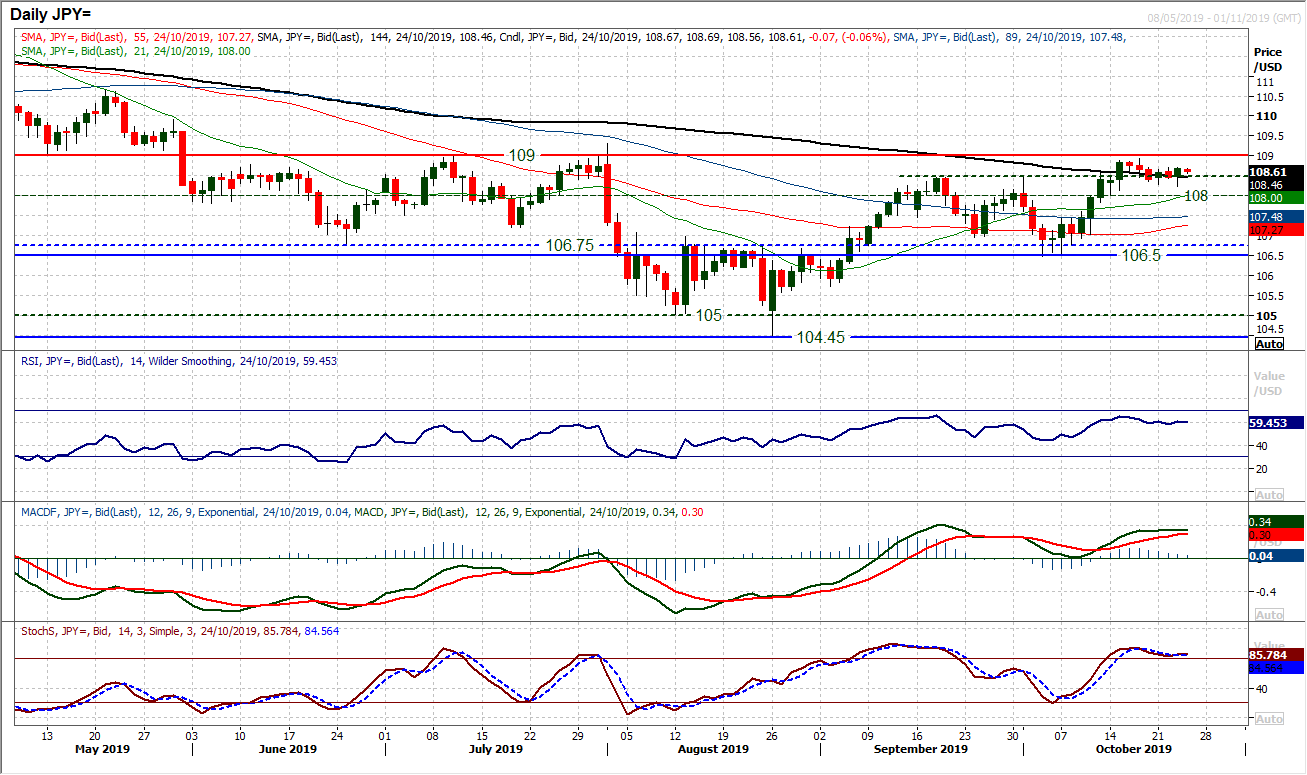
An intraday swing higher in to the close has seen a corrective slip just nipped in the bud on Dollar/Yen. A negative bias was threatening to take hold as the market traded at a one week low, but the bulls have fought back well. Although there is still significant resistance around 109.00 the bulls will be feeling that the current moves are part of a consolidation rather than the prospective correction as part of a range play (between 106.50/109.00). This leaves the current outlook uncertain, but not corrective. This is reflected by the early moves today where, once more the market lacks conviction. Momentum indicators on the daily chart have reacted positively to yesterday’s move and again reflect consolidation. They are all flattening, with RSI back around 60, MACD lines stabilising and Stochastics holding above 80. However, the market needs to push above 108.70 which has been a lower high in the past week, whilst 109.00 is clearly a key barrier. A market in desperate need of a catalyst.
Gold
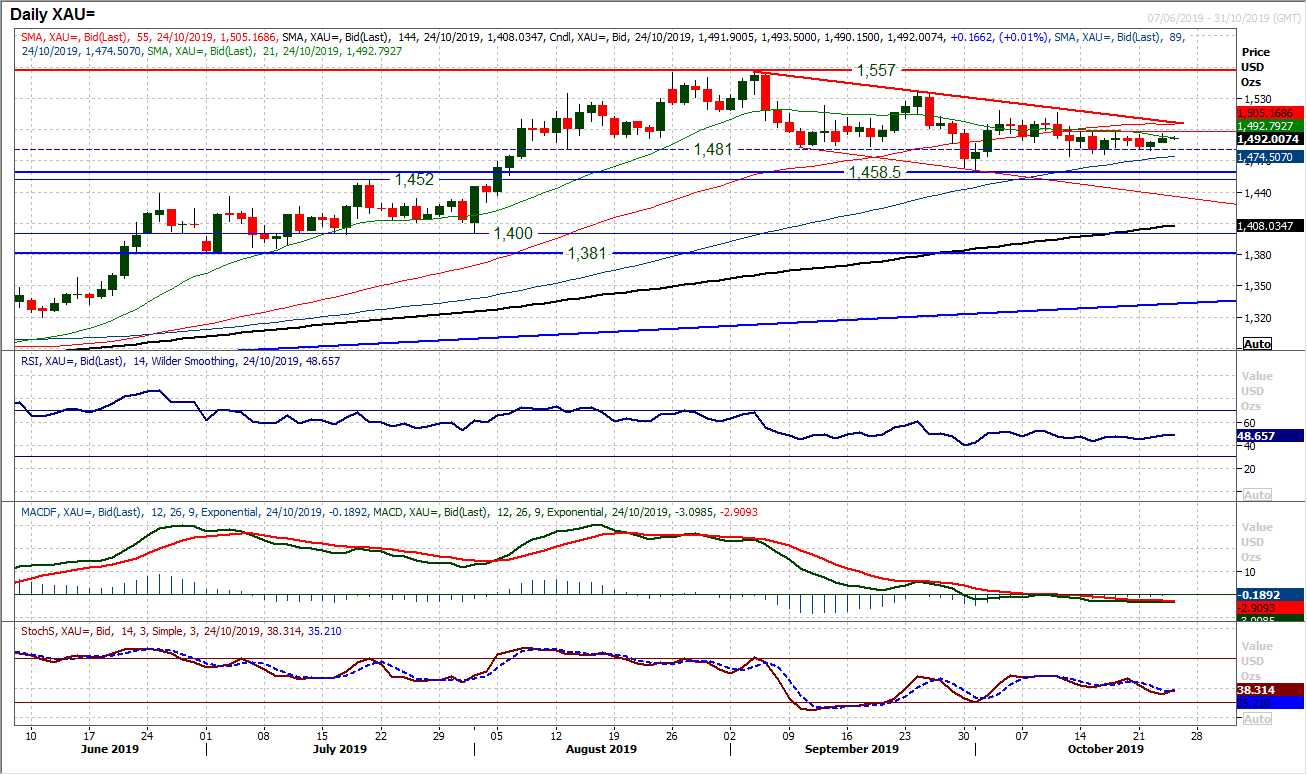
Is a breakout of the consolidation finally about to be seen? A run of two positive closes (and candlesticks) on gold has been a rarity in recent weeks, but once more the support around the old key low at $1481 has held firm. It means that today’s session could be an outlook changer. The resistance at $1497 has been built up over the past eight sessions and the bulls will be eyeing a breakout having just eased back from $1496 yesterday. Another positive candle today would hint at growing bull control. A decisive closing breach would end a very tight period of consolidation between $1474/$1497 but also ease the negative bias. A move into the $1500s would be psychological but also imply a new move higher to test not only the six week downtrend (today at $1506), but also open the October highs again $1515/$1518. Is this likely though? The daily indicators are giving no decisive signal, but the hourly chart shows the market holding above a pivot around $1488/$1490 and momentum indicators holding positions in more positive configuration. It is too early for conviction, but a slightly more positive outlook could be brewing.
WTI Oil
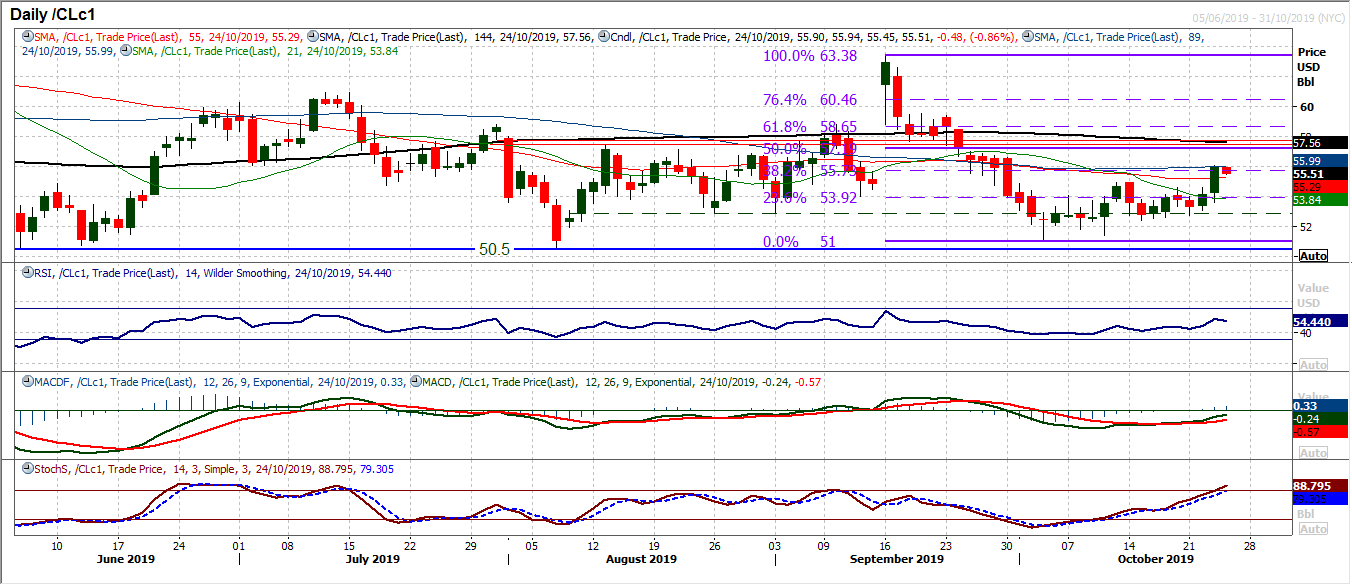
Finally we have seen oil finding some positive traction in a move that looks ready to end the period of stagnation. A surprise EIA inventory drawdown helped to boost sentiment on WTI to pull the market through key near term resistance at $54.95. A strong bull candle into the close and the market at a three week high. Suddenly a far more constructive momentum outlook too, with the Stochastics pulling into multi-month highs, MACD lines finding traction and RSI above 50. Holding this move will now be the key test for today. The previous recovery just over a week ago dissipated as fast as it arose. So holding the $54.95 breakout will be important. Another close above the 38.2% Fibonacci retracement at $55.75 opens 50% Fib at $57.20.
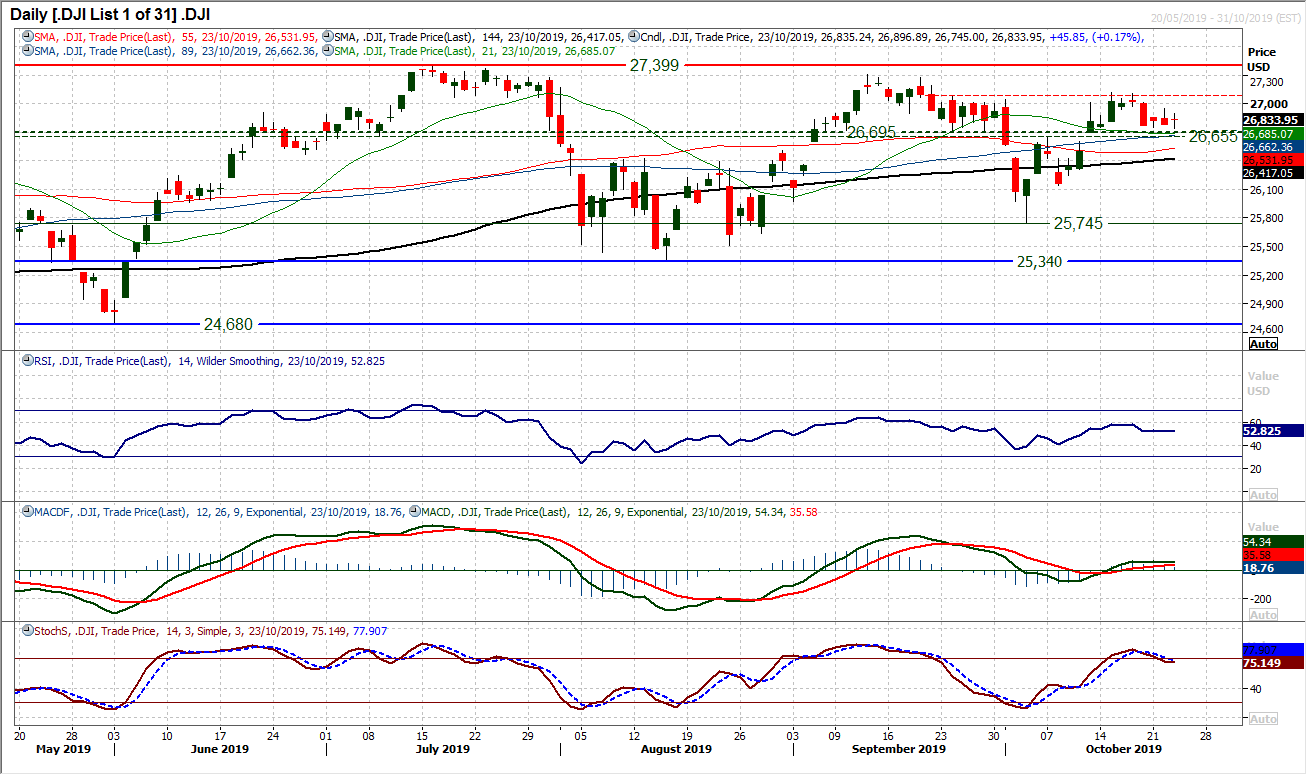
As if to reiterate the air of consolidation across major markets yesterday, the Dow continues to sit in a holding pattern that has developed through this week. A doji candlestick (open and close at the same level, well within 1 tick of a pure doji) denotes a lack of conviction. We have spoken recently of the importance of the Dow holding on to the support band 26,655/26,695 and this continues to be the case. This is becoming perhaps even more important now, given the fact that for four sessions in a row now the low has formed a shade above this support between 26,745/26,785. Momentum indicators reflect the holding pattern too, with RSI and MACD lines a shade above neutral. Hourly momentum has become neutralised too, so we wait for the next move. Initial resistance around 26,945 comes in below the main near to medium term barrier 28.040/27,120. A close under 26,655 suggests growing negative pressure.
"""DISCLAIMER: This report does not constitute personal investment advice, nor does it take into account the individual financial circumstances or objectives of the clients who receive it. All information and research produced by Hantec Markets is intended to be general in nature; it does not constitute a recommendation or offer for the purchase or sale of any financial instrument, nor should it be construed as such.
All of the views or suggestions within this report are those solely and exclusively of the author, and accurately reflect his personal views about any and all of the subject instruments and are presented to the best of the author’s knowledge. Any person relying on this report to undertake trading does so entirely at his/her own risk and Hantec Markets does not accept any liability. """
There is a sense that major markets are taking a breather after a few weeks of trading where Brexit this and trade dispute that have been pulling markets here and there. Attention is turning towards the big three central banks that hold their latest monetary policy meetings in the next week. Today the focus is on the outlook for the Eurozone and the ECB. The Eurozone economy has been hit by the double whammy of the global slowdown, accelerated by the US/China dispute and having the uncertainty of Brexit hanging over its head. The growth outlook has suffered as a result.
Flash PMIs are out today and are expected to show the continued stagnation of economic output. A composite PMI a hairs breadth into expansion territory last month (at 50.1) is only expected to be marginally improved but still suggesting the need for support.
The ECB meeting today is likely to be more about justifying the package of easing action taken at the last meeting six weeks ago. We do not expect any fireworks in what will be the final meeting for Mario Draghi before his eight year tenure as ECB President draws to a close. Expect one final plea to Eurozone governments to help with the heavy lifting and engage fiscal stimulus. This is unlikely to be a meeting therefore that can break the consolidation that has set in across major markets. Bond yields have stabilised, whilst the euro, yen and gold are all muted. Another Brexit policy shift, or significant development in the trade story may shake markets from consolidation in front of next week’s Fed meeting. The ECB though will be little more than a fond farewell to Draghi.
Wall Street closed in marginal positive territory last night with the S&P 500 continuing to fluctuate around 3000, climbing +0.3% into the close of 3005. US futures are all but flat today. Asian markets were again mixed, with the Nikkei +0.6% whilst the Shanghai Composite was -0.3%. In Europe, FTSE 100 Futures are around the flat line, whilst DAX Futures are mildly higher by +0.2%.
In forex, there is a continuation of the consolidation of recent sessions, although a very slight negative bias has formed with AUD and NZD slipping, whilst JPY is a mild outperformer.
In commodities, the recent tick higher on gold has held ground, whilst oil is just given back some of yesterday’s sharp gains.
The flash PMIs for October dominate the economic calendar early European session, but the ECB is key today. The Eurozone flash Manufacturing PMI is at 09:00 BST and is expected to improve marginally to 46.1 (from a final reading of 45.7 in September) whilst Eurozone flash Services PMI is expected to also pick up to 51.9 (from a final September reading of 51.6). This would be enough to see the Eurozone flash Composite PMI tick higher to 50.3 (from 50.1 in September).
The European Central Bank monetary policy is at 12:45 BST which is expected to show no change to the deposit rate (of -0.50%) or the renewed asset purchases (€20bn per month). Mario Draghi’s final press conference as ECB President is at 13:30 BST.
For the US data, Durable Goods Orders are at 13:30 BST which are expected to show the core, ex-transport orders are expected to have fallen by -0.2% in September (following growth of +0.5% in August). Weekly Jobless Claims at 13:30 BST are expected to be at 215,000 (from 214,000 last week). New Home Sales are at 15:00 BST and are expected to drop by -0.7% to 701,000 in September (from 713,000 in August).
Chart of the Day –NZD/US:D
The Kiwi has been performing well now for about a week now. Having already seen positive momentum divergences in early October, a recovery has developed. A breakout above $0.6350 implies 150 pips of gains (towards $0.6500) and has placed the market on course to at least test key resistance of the long term pivot band $0.6450/$0.6480. Corrections are now a chance to buy for this move. The bulls are in an increasingly solid position with the RSI around 60 whilst Stochastics are strong and MACD lines are rising towards a position above neutral and at a twelve week high. Effectively this all suggests that the $0.6450 resistance will at least now come under pressure. Initial resistance is at $0.6435 but a close above $0.6480 would be a key outlook changing break. The strength of momentum suggests that corrections are now a chance to buy. Yesterday’s low at $0.6385 is initial support with the neckline at $0.6350 is now key.


The euro has settled into a holding pattern ahead of the ECB meeting today. With a slide back to leave resistance at $1.1165/$1.1180, EUR/USD has unwound within the recent recovery trend. We have been discussing the importance of the market finding another higher low between $1.1075/$1.1100 and it was interesting to see yesterday’s low a shade above $1.1100. The support of a three week uptrend comes in at $1.1075 today to add to this confluence. Momentum remains strongly configured for little corrections to now be seen as an opportunity for the bulls rather than a threat. RSI is holding above 60, MACD lines rise above neutral and Stochastics are around 80. Getting past the ECB meeting today with these levels intact would be a real sign of more stable ground for the recovery. Above $1.1180 opens $1.1250.

The bull run may have lost its way in recent days, but the bulls are still willing to sit in their positions. Yesterday’s candle was a strong reaction to the threat of initial profit taking. A rebound back above $1.2900 shows a degree of fight and a market in consolidation rather than near term correction. Political moves around the next step in the Brexit saga will be a key driver of the next move on Cable, but for now the technicals are developing a consolidation. Yesterday’s low at $1.2840 is initial support whilst the 23.6% Fibonacci retracement of the bull rally sits at $1.2820 and is an initial gauge for how a correction could develop. Resistance around $1.3000/$1.3010 is key.

An intraday swing higher in to the close has seen a corrective slip just nipped in the bud on Dollar/Yen. A negative bias was threatening to take hold as the market traded at a one week low, but the bulls have fought back well. Although there is still significant resistance around 109.00 the bulls will be feeling that the current moves are part of a consolidation rather than the prospective correction as part of a range play (between 106.50/109.00). This leaves the current outlook uncertain, but not corrective. This is reflected by the early moves today where, once more the market lacks conviction. Momentum indicators on the daily chart have reacted positively to yesterday’s move and again reflect consolidation. They are all flattening, with RSI back around 60, MACD lines stabilising and Stochastics holding above 80. However, the market needs to push above 108.70 which has been a lower high in the past week, whilst 109.00 is clearly a key barrier. A market in desperate need of a catalyst.
Gold
Is a breakout of the consolidation finally about to be seen? A run of two positive closes (and candlesticks) on gold has been a rarity in recent weeks, but once more the support around the old key low at $1481 has held firm. It means that today’s session could be an outlook changer. The resistance at $1497 has been built up over the past eight sessions and the bulls will be eyeing a breakout having just eased back from $1496 yesterday. Another positive candle today would hint at growing bull control. A decisive closing breach would end a very tight period of consolidation between $1474/$1497 but also ease the negative bias. A move into the $1500s would be psychological but also imply a new move higher to test not only the six week downtrend (today at $1506), but also open the October highs again $1515/$1518. Is this likely though? The daily indicators are giving no decisive signal, but the hourly chart shows the market holding above a pivot around $1488/$1490 and momentum indicators holding positions in more positive configuration. It is too early for conviction, but a slightly more positive outlook could be brewing.

WTI Oil
Finally we have seen oil finding some positive traction in a move that looks ready to end the period of stagnation. A surprise EIA inventory drawdown helped to boost sentiment on WTI to pull the market through key near term resistance at $54.95. A strong bull candle into the close and the market at a three week high. Suddenly a far more constructive momentum outlook too, with the Stochastics pulling into multi-month highs, MACD lines finding traction and RSI above 50. Holding this move will now be the key test for today. The previous recovery just over a week ago dissipated as fast as it arose. So holding the $54.95 breakout will be important. Another close above the 38.2% Fibonacci retracement at $55.75 opens 50% Fib at $57.20.


As if to reiterate the air of consolidation across major markets yesterday, the Dow continues to sit in a holding pattern that has developed through this week. A doji candlestick (open and close at the same level, well within 1 tick of a pure doji) denotes a lack of conviction. We have spoken recently of the importance of the Dow holding on to the support band 26,655/26,695 and this continues to be the case. This is becoming perhaps even more important now, given the fact that for four sessions in a row now the low has formed a shade above this support between 26,745/26,785. Momentum indicators reflect the holding pattern too, with RSI and MACD lines a shade above neutral. Hourly momentum has become neutralised too, so we wait for the next move. Initial resistance around 26,945 comes in below the main near to medium term barrier 28.040/27,120. A close under 26,655 suggests growing negative pressure.
"""DISCLAIMER: This report does not constitute personal investment advice, nor does it take into account the individual financial circumstances or objectives of the clients who receive it. All information and research produced by Hantec Markets is intended to be general in nature; it does not constitute a recommendation or offer for the purchase or sale of any financial instrument, nor should it be construed as such.
All of the views or suggestions within this report are those solely and exclusively of the author, and accurately reflect his personal views about any and all of the subject instruments and are presented to the best of the author’s knowledge. Any person relying on this report to undertake trading does so entirely at his/her own risk and Hantec Markets does not accept any liability. """
