Market Overview
Risk appetite has had a double shot in the arm, resulting in a significant swing on markets. Donald Trump is talking up the prospects of a deal with China as the trade negotiations appear to be progressing well. The extent of an agreement is yet to be revealed (and given previous form, all could yet still be scuppered before the Chinese delegation leaves Washington tonight). However, traders are suddenly hopeful that the outcome could be something that cancels the planned tariff hikes of next week, whilst laying the pathway for further subsequent agreement.
Market reaction has been to sell safety. Government bond yields have spiked higher, the yen is a primary underperformer in the forex majors (along with dollar weakness too) and gold is also lower.
The euro and the commodity majors have gained, with equities and oil also higher. In the spirit of deal potential, yesterday also had a rare positive in the Brexit uncertainty. Crunch talks between Irish Taoiseach (Prime Minister) Varadkar and UK Prime Minister Johnson left both leaders talking up the prospects of a Brexit deal before the 31st October deadline. The subsequent reaction has been for sterling to drive for its biggest daily gain versus the dollar since March.
The question is now whether the prospects of both these deals/agreements can be followed to fruition. If so then this will be a game changer across many markets. We will know by this evening about the US/China potential, for Brexit though, the path is far more rocky and the potential for disappointment remains high.
Wall Street closed solidly higher again last night with the S&P 500 +0.6% at 2938, whilst US futures are another +0.3% higher today. Asian markets have taken the ball and run with it, as the Nikkei is +1.1% and Shanghai Composite +1.1%. The mood in Europe is more mixed. Continued sterling gains are a drag on FTSE on the negative correlation, with FTSE futures -0.5%, whilst DAX futures are a solid +0.4% higher.
On forex majors, there is still a risk positive bias, with EUR gains and JPY underperformance, along with continued recovery on GBP.
In commodities, there is an interesting reaction on gold this morning, where the market is holding on and building support c. $4 higher. Oil has continued to run higher (c. +2%) amidst recovery in the demand outlook from the constructive US/China talks.
Arguably the most important data point for the week on the economic calendar today. With household spending accounting for 70% of the US economy, consumer surveys are extremely telling. The prelim reading of Michigan Sentiment for October is at 1500BST and there is a forecast decline to 92.0 (from 93.2 at the final September reading). However, also watch for the Current Conditions component which is expected to slip mildly to 107.5 (from 108.5 in September) and the Expectations component which is expected to drop to 81.7 (from 83.4).
Chart of the Day – EUR/JPY
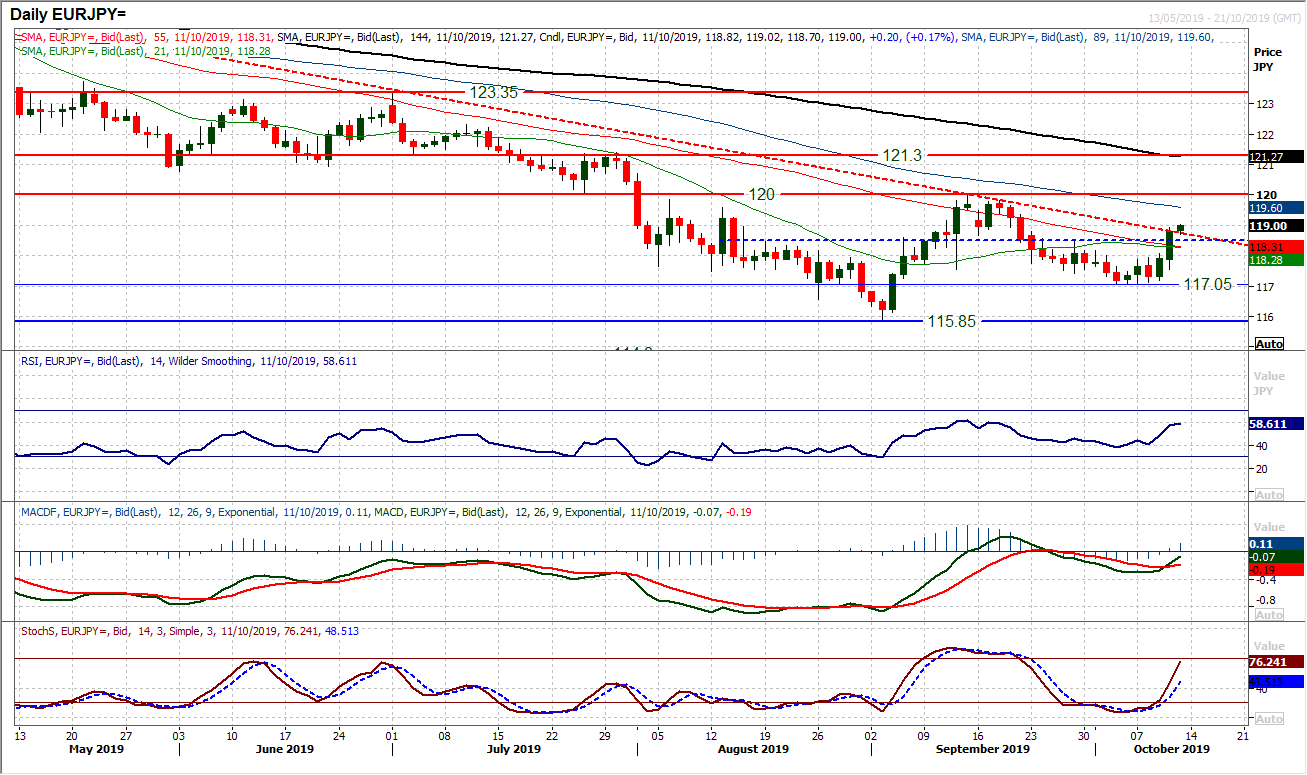
The outlook for risk appetite is making a move for sustainable improvement. A second strong bull candle from EUR/JPY has set up the market to break through resistance of a downtrend that has been in place since April. Another positive open today shows that the bulls remain on the front foot. Yesterday’s breakout above a pivot (for the past couple of months) at 118.50 pulls the market to a two week high and set up for continued recovery now. This comes with some sharp improvements in momentum indicators as bull cross buy signals on both Stochastics and MACD lines have been seen, whilst RSI is now rising strongly above 50. The breakout above 118.50 effectively opens the key resistance at 120.00. This pivot line also now becomes a near term basis of support with the hourly chart showing a near term “buy zone” for the recovery between 118.15/118.50.
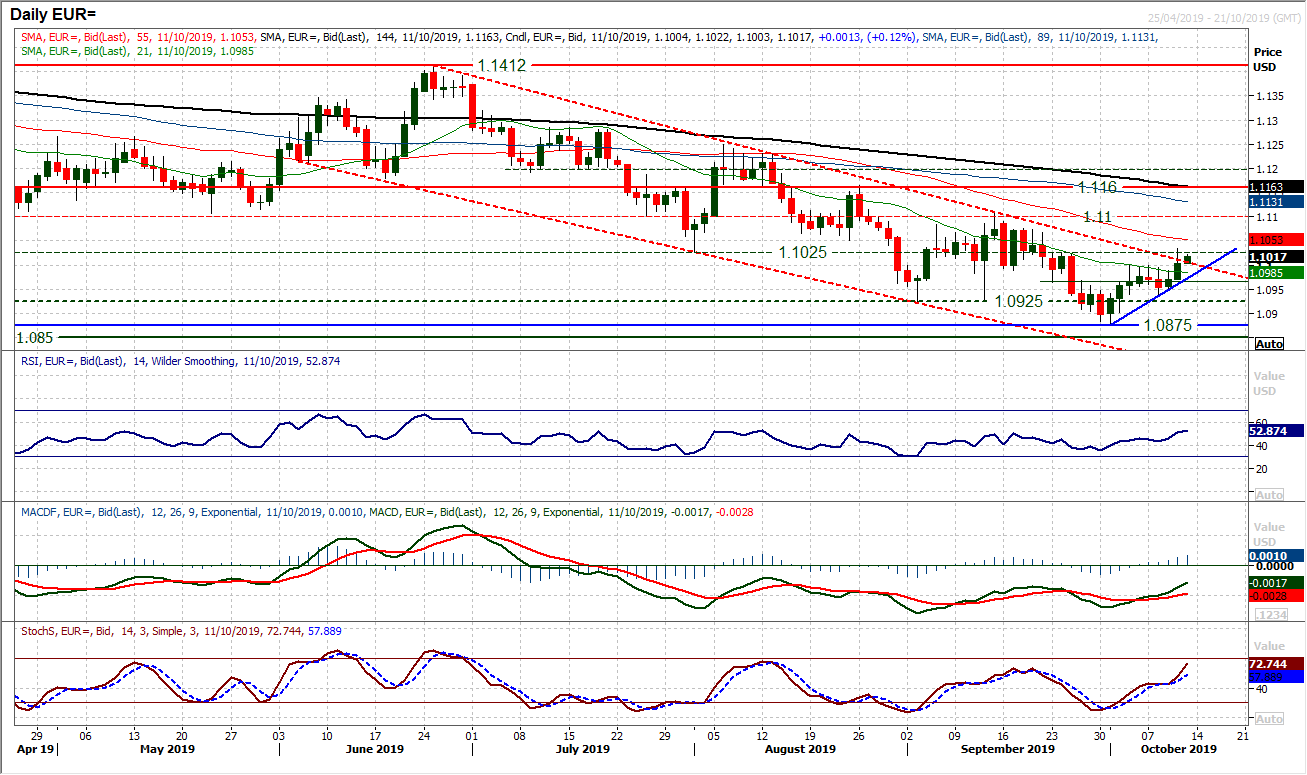
After consolidating under a confluence band of resistance $1.1000/$1.1025 in the past week, a strong bull candle has pulled the market to breach the three and a half month downtrend channel. Although the channel break is yet to be confirmed on a closing basis, the bulls are in control again today. This comes with momentum really looking to confirm the break now. The RSI is above 50 and threatening three month highs, whilst Stochastics are pulling higher from a “bull kiss” and MACD lines are also advancing. These are all indicators on the brink. A close above $1.1025 today would be a strong signal now for continued recovery towards a test of $1.1100. However, more importantly, there would be a key shift in the medium term outlook for recovery. It is interesting to see that $1.1000 is holding on little unwinding moves today as the breakout becomes supportive. The old pivot at $1.0965 is now key for a continued recovery.
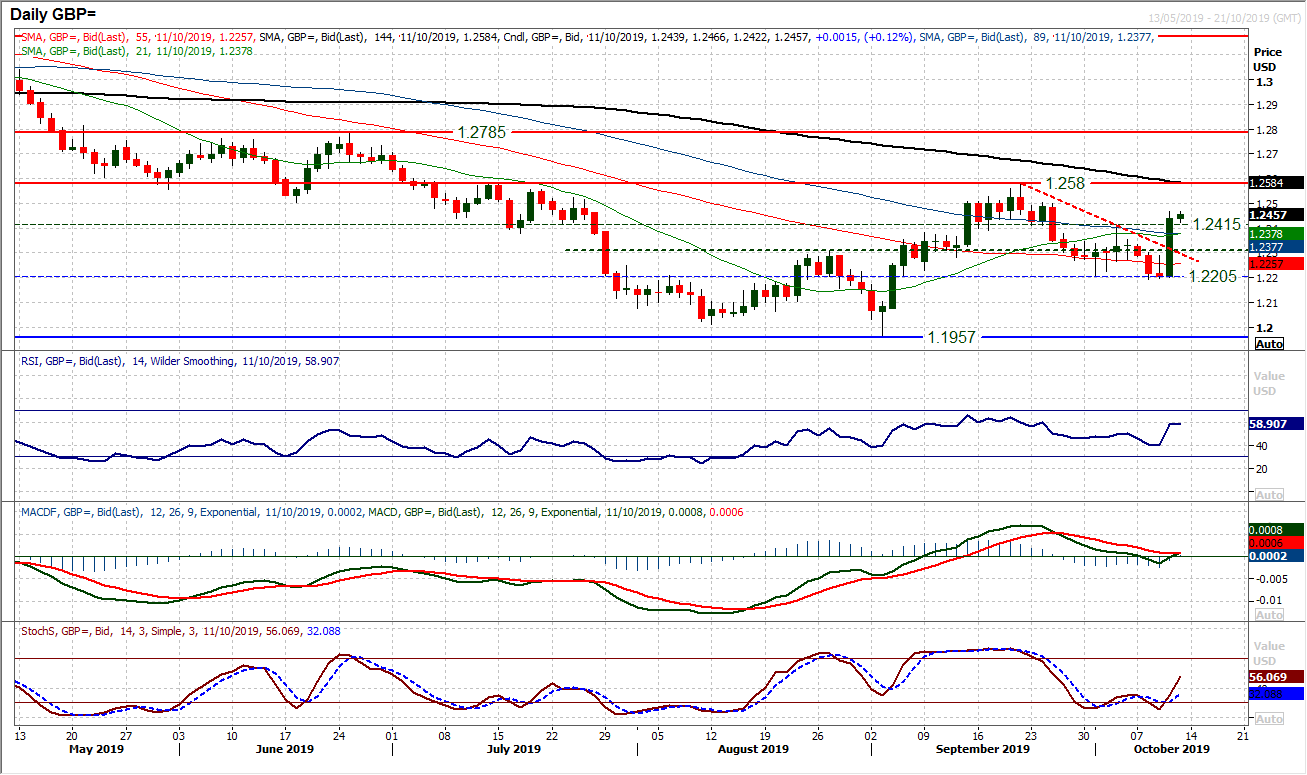
With both Leo Varadkar and Boris Johnson talking up the prospects of a Brexit deal, sterling jumped sharply yesterday. Closing 235 pips higher on the day formed the strongest bull candle since March on Cable. This has broken a three week downtrend and dragged improvement through momentum indicators. Trading sterling without keeping one eye on the newsflow is risky right now. The technical signals have swung positive, with a closing breakout above near term resistance at $1.2415 which is also a pivot. This opens the prospect (unless the deal prospects are scuppered) of a move to test the $1.2580 resistance of the September high now. Closing back under $1.2415 would be disappointing and could lead to a slip back into $1.2300 area again. However, for now, as long as prospects of a US/China trade deal remain positive and Brexit deal prospects remain constructive, Cable should remain supported.
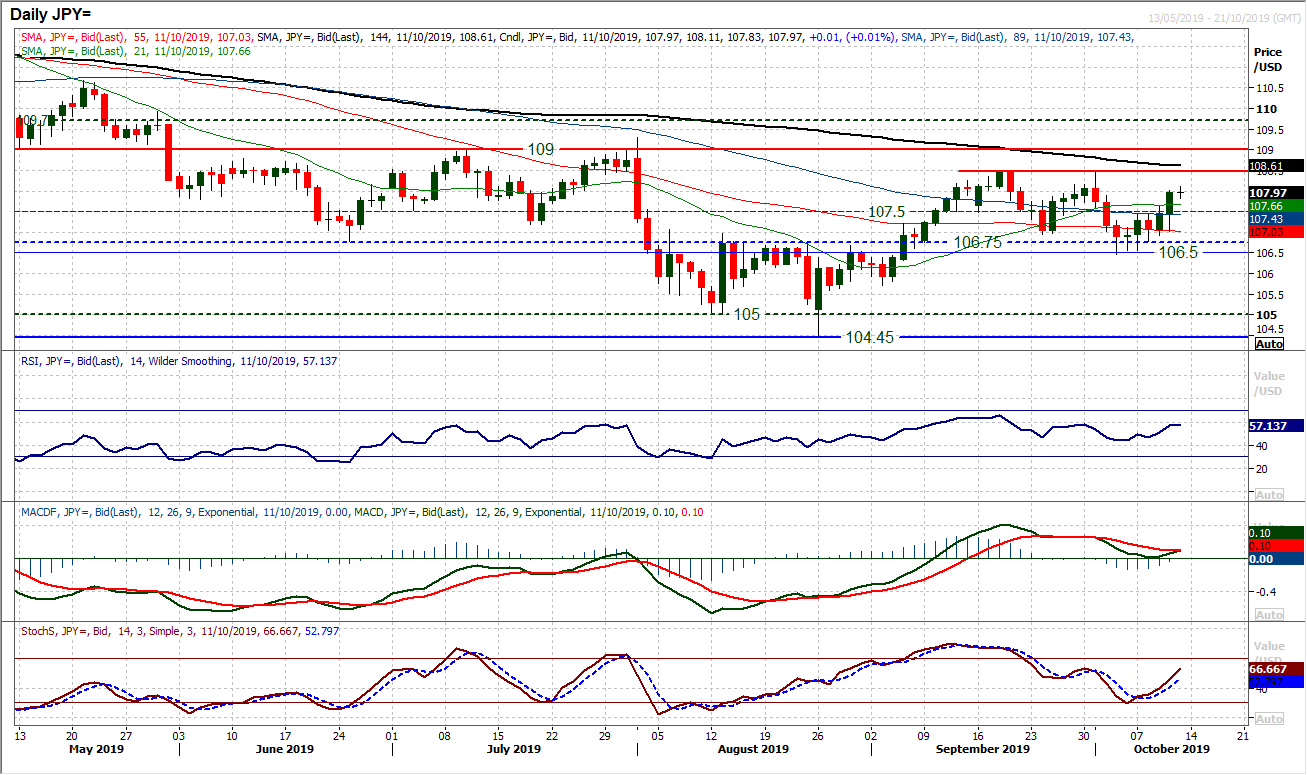
With risk appetite taking a positive turn on the constructive environment for the trade talks, we see the safe haven yen under pressure. The decisive move above 107.50 opens the resistance at 108.50 again. The move comes with a growing run of higher daily lows (the latest leaving support at 107.00) to drive an improving outlook again. Momentum indicators are improving once more, with the Stochastics swinging higher, MACD lines bottoming above neutral and RSI pushing towards 60 again. A move above 60 on RSI would suggest pressure growing on the 108.50 resistance area and potential to push on and test key multi-month resistance at 109.00.The mini breakout leaves 107.50 pivot as initial support, whilst the hourly chart shows a near term support band 107.40/107.60 to buy into weakness. Clearly this is a market that has the potential to be negatively impacted by negative newsflow surrounding the US/China talks, but coming into today’s session the technical outlook is certainly improving.
Gold
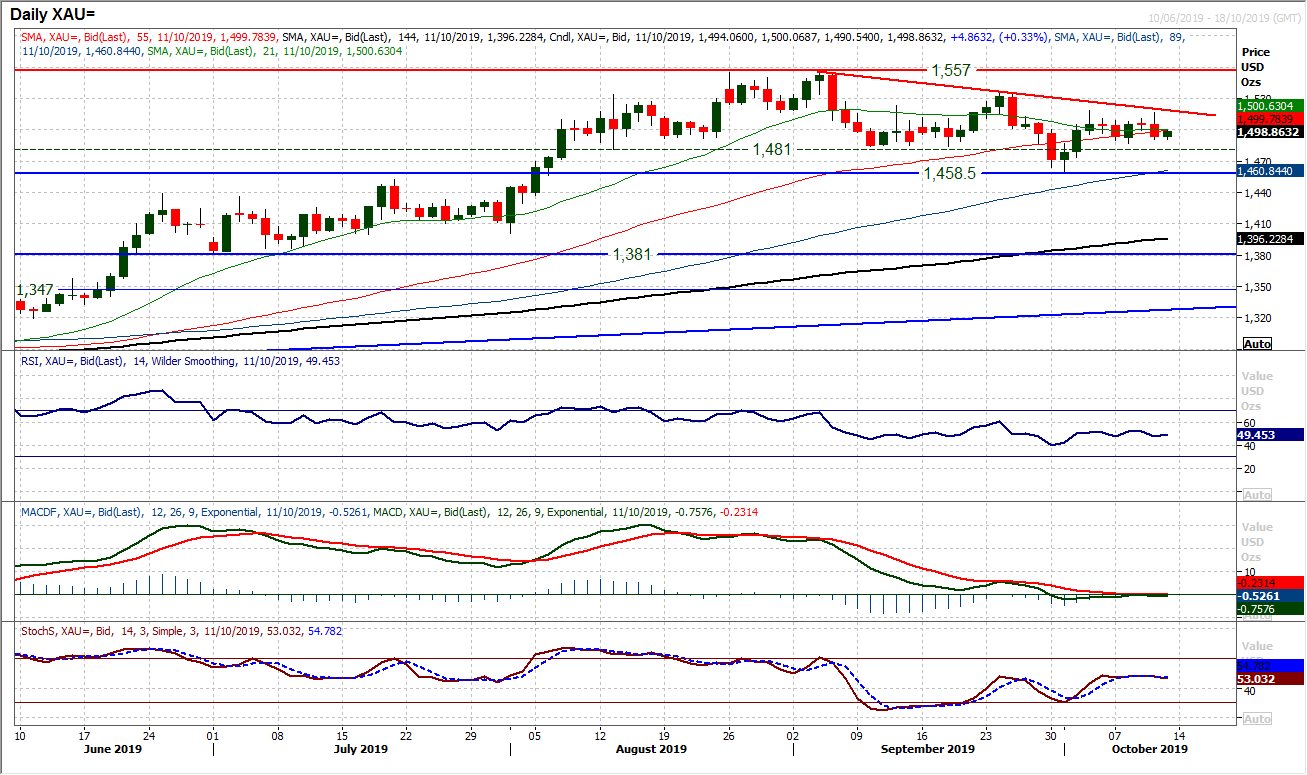
Gold is another safe haven that has been negatively impacted by positive newsflow on the US/China talks. The price reaction on major markets yesterday would suggest that despite a weakening dollar, gold is not an asset to be stuck in long should there be a positive outcome from these trade talks today. A bearish outside day candle has flipped the technical outlook towards a negative near term bias once more. However, this would take another step forward fs support at $1487 were to be breached today. For now, we need to continue to see this as a medium term range, but the negative pressure would certainly ramp up should the old $1481 level be breached too. Momentum indicators are still very mixed in their configuration on the daily chart, however a growing negative bias is threatening to take hold on the hourly chart. Resistance is building around $1500 again and continued failed intraday rebounds under here be increasingly worrying for any bulls. Further positive newsflow on the trade talks and gold could accelerate lower now, with key support at $1458.50. Resistance at $1510/$1518.50 is mounting again another potential lower high looks to be forming.
WTI Oil
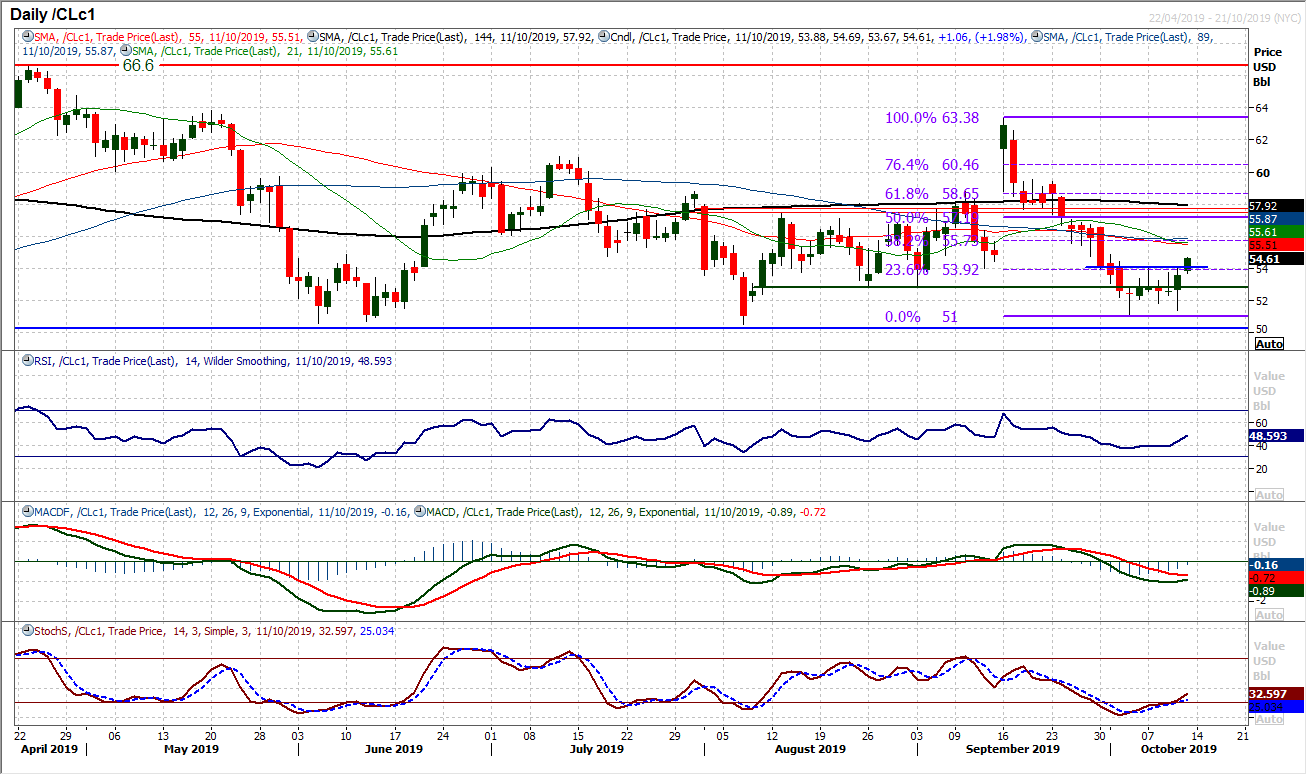
There has been a notable choppy consolidation on oil for the past week. This has created a number of candles with long shadows (failed intraday moves) and lacking conviction. However, yesterday’s bounce really looked to put some direction into the market. A bounce from just above the key support band $50.50/$51.00 has helped to bolster this as a medium term floor. However, with a decisive close higher, the bulls are making a move. This has continued this morning on an intraday move above the resistance $53.90/$54.00 and if this can be closed above, the bulls would really be advancing. It would effectively complete a small $3.00 base pattern and imply recovery potential towards $57.00. Momentum seems to be turning the corner too, with Stochastics advancing, along with RSI and MACD lines also bottoming. The hourly chart shows $53.70/$54.00 is a near term buy zone. The importance of a positive resolution to the US/China trade talks cannot be underestimated with the progression of the recovery outlook.
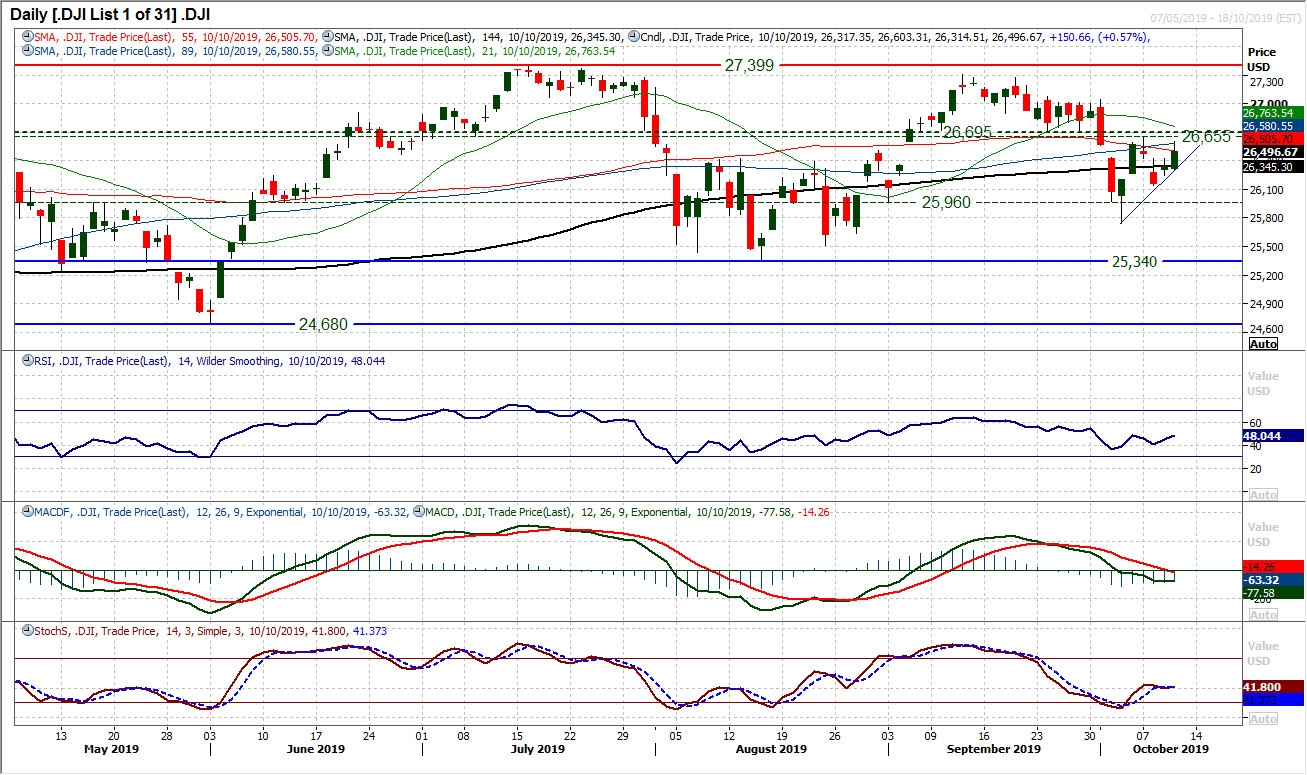
Signs of light in the US/China trade talks and the Dow has jumped again. Any (mini) trade deal that results in no further tariff escalation will send the Dow higher. On a technical basis, the resistance at 26,655/26,695 is the barrier to gains and if this can be breached then the bulls will be back in the driving seat. There is still an element of caution with the momentum indicators (RSI still under 50, MACD lines flat around neutral), but a near term break through resistance would be confirmed if these conditions ticked higher. The subsequent resistance test would be 27,045/27,080. The hourly chart shows there is still a degree of caution, with near term ranging outlook (between 35/65 on hourly RSI) still present. Initial support at 26,315 protects the 26,140 higher low.
"""DISCLAIMER: This report does not constitute personal investment advice, nor does it take into account the individual financial circumstances or objectives of the clients who receive it. All information and research produced by Hantec Markets is intended to be general in nature; it does not constitute a recommendation or offer for the purchase or sale of any financial instrument, nor should it be construed as such.
All of the views or suggestions within this report are those solely and exclusively of the author, and accurately reflect his personal views about any and all of the subject instruments and are presented to the best of the author’s knowledge. Any person relying on this report to undertake trading does so entirely at his/her own risk and Hantec Markets does not accept any liability. """
