Last week the ECB and Fed did their monthly thing by getting hordes of analysts scurrying around trying to guess what they would do. In the end, nothing much changed. The Fed was forced to bring the Fed Funds into line with the open market (as they always have to do) – just as I forecast last week.
That was simple! But of course, there is a whole army of analysts who take a microscope to the Fed and torture the ephemera details to produce a very lengthy learned piece. I managed to read one example of that genre through and really, I was none the wiser afterwards. The problem I have is that 99.999% of analysts believe the Fed has a magic wand and can direct rates and the economy at will. Hah!
So how is our short T-Bond trade progressing? Recall, I have been looking for a bottom in yields (top in price) all summer as bullish fervour rose to heights not seen before. In fact in August, DSI bulls numbered 96% on several days as investors fully bought into the ‘sure thing’ that US rates would collapse with much talk of going negative.
Of course, that was not so far-fetched as several nations had blazed a trail into this Alice i n Wonderland scenario with Japan leading the way. Traders were well primed for this scenario to repeat in US Treasuries.
So in late August, my Tramline methods were telling me a top was very likely close and that a sharp reversal was the percentage play. Here is the daily chart of T-Bond prices
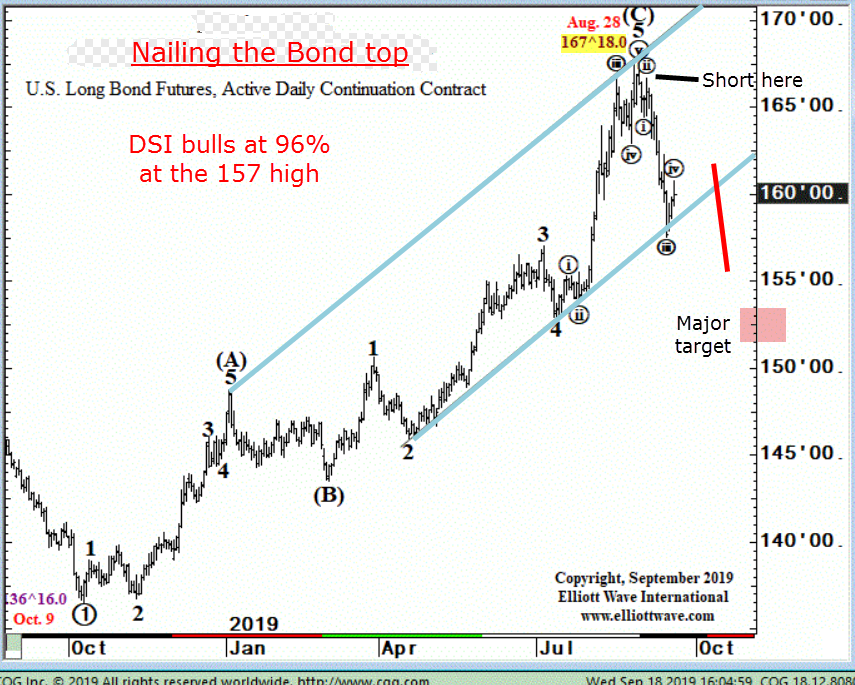
Chart courtesy www.elliottwave.com
The Elliott waves are pretty clear – – the (C) wave high appeared on 28 August and that started the sharp decline I had foreseen to the current position. We are now in a small scale fourth wave up before descending again in a fifth wave.
I can claim the blue parallel trendlines are genuine tramlines, as the upper one has one touch point at the (A) wave high and there are two distinct touch points at the top area. I need at least three touch points on each line to make a valid tramline pair.
After the wave 4 bounce has exhausted, I expect a break of the lower tramline.
Bond bulls must be puzzled as to why their over-loved bonds have lost a cool 10 handles in only three weeks. I am not. Forget the ‘reasons’ why Treasuries should do this or do that. The bottom line is that when a market becomes over-loved, I start to look for reasons why it should reverse using my Tramline methods – and having a sense of market sentiment. Markets always top when bullish mania reaches an extreme.
The Bond Mania us at an end. And few believe it – yet.
Is the Dow making a major turn here?
I have been tracking the Dow as it climbed from its 5 August low as a likely C wave as part of an A-B-C correction to terminate below the July ATH at 27,400. But as it has moved higher than I had expected, I have been considering the alternative scenario that the entire move from the large wave 4 Christmas low is an ongoing five-wave ending diagonal
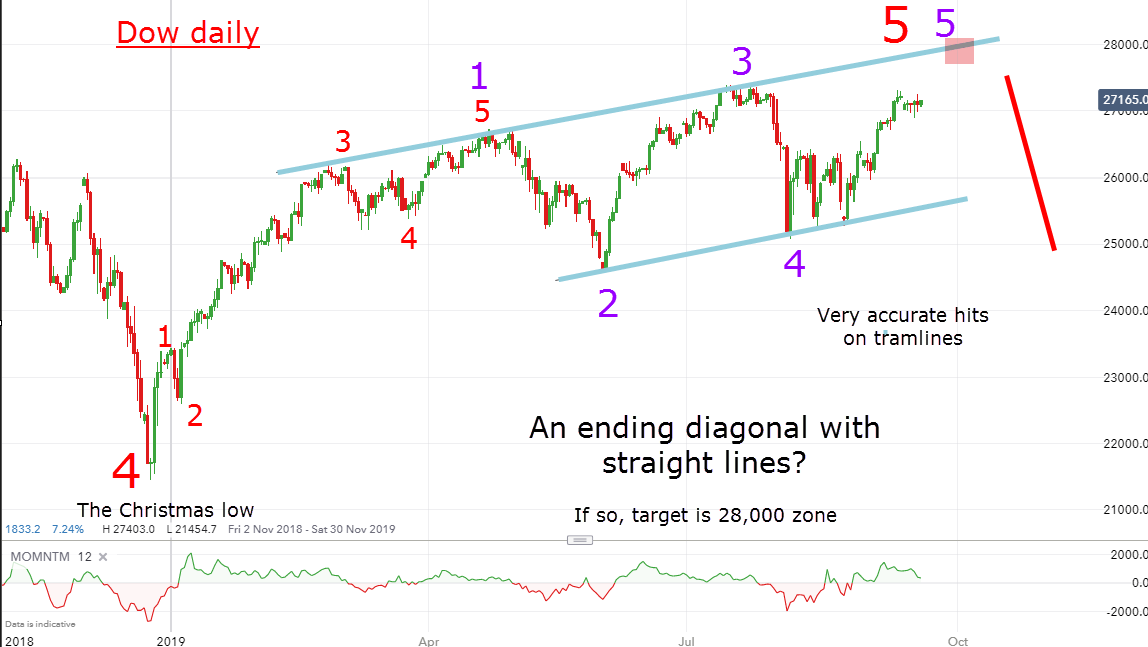
We are trading within 200 pips of the July ATH and if this is the correct version, my upper target is the 28,000 region.
As a swing trader, I do regret not trading long at least since the late August buy signal around 26,000. I put that down to my bearish bias at the time. My excuse? Bullish sentiment has reached fever pitch among the money managers was one factor. But as I noted at the time, the MSM were screaming ‘yield inversion means recession assured’ in headlines – as they were uniformly bearish.
I should have known better than not to trust the contrary signals created by the MSM! Also, bullish sentiment of the pros can remain high for a very long time, and we are dealing with a very extended topping process of a multi-decade bull market. Such markets do not easily give up the ghost with a sudden reversal. This topping process is certainly taking its time.
But we are within sight of an historic turn – and it may be here right now to be kicked off by the news that US troops are going to Saudi Arabia. The Iran conflict will only get hotter.
I have noted before of the Equinox Effect’ where many major market turns have occurred at or near one of the two Equinoxes with the Autumn Equinox due on Monday. There is also a similar Solstice Effect in June and December. Here is the Equinox Effect at work over the past four years (ten equinoxes)
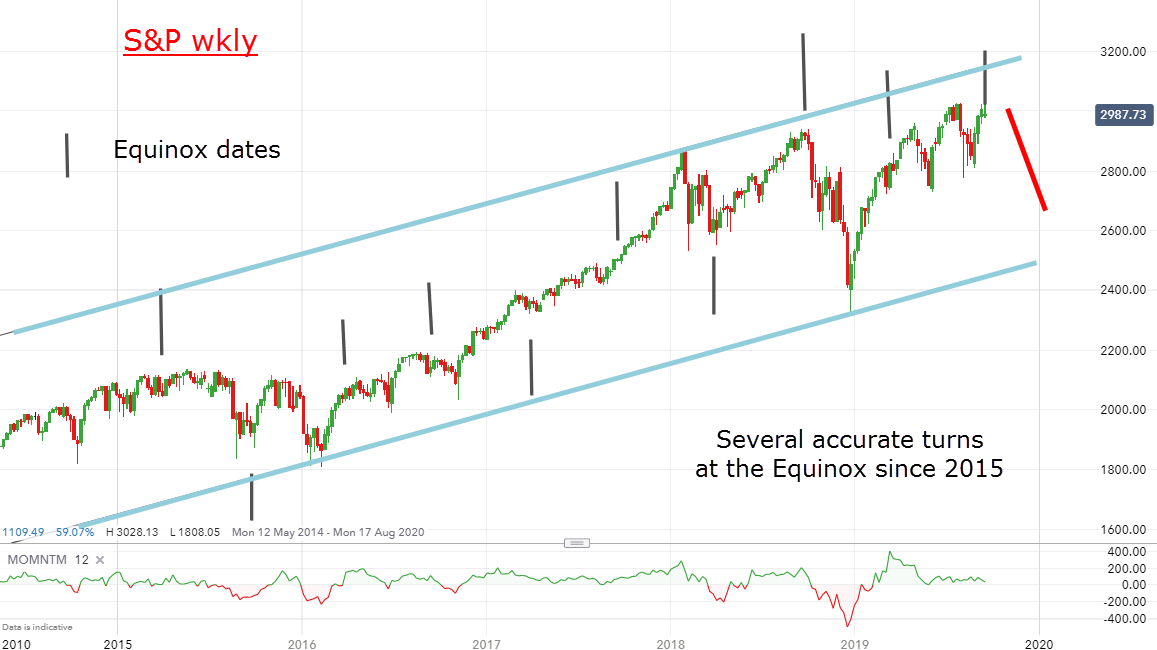
Isn’t it uncanny how many of the turns have occurred at or near these dates? While this all may be a coincidence, I am certainly not discounting the influence the sun has on our lives!
But if my original bearish thesis that the July ATHs will not be exceeded is correct, we are at a very historic turn down that should mark the top of the multi-decade bull stock market. Only a push into new ATHs would amend my stance.
Incidentally, Friday's Global Climate Strike is to me is not only a symptom of how anxious Western society is becoming, but with their demands to ‘act on climate change’ if implemented, would guarantee destruction of much of our economies.- and with it, the stock market. This is a very bearish sign.
And what is amazing to me is that the movement is fronted by a 16-year old schoolgirl. Not since Joan of Arc in the 15th Century has so young a leader emerged to lead a major movement! We are living in interesting times alright.
An example of how I pinpoint accurate trade entries
For PRO SHARES members, I have been stalking ITV PLC (LON:ITV) as it descended the down escalator with bullish sentiment leaking out of this warhorse. It is believed it will continue to be a loser in the great streaming revolution that Netflix (NASDAQ:NFLX) and others are winning. But hold on! What is this I see before me?
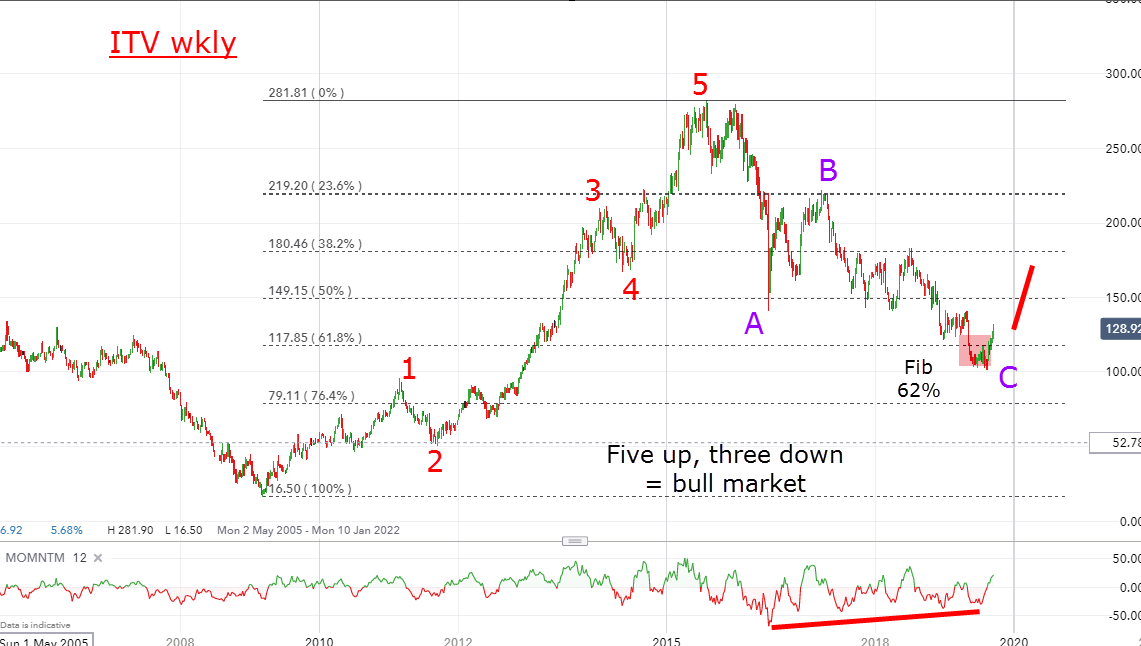
This is the long term weekly chart that shows a very clear five waves up and three down. That is about as clear an Elliott wave picture as you will find with an individual share. That is what raised my eyebrows last month.
Not only that, but the decline has taken it to the typical Fibonacci 62% retrace and on a strong momentum divergence. As long time readers will know, this is the textbook setup I always search for.
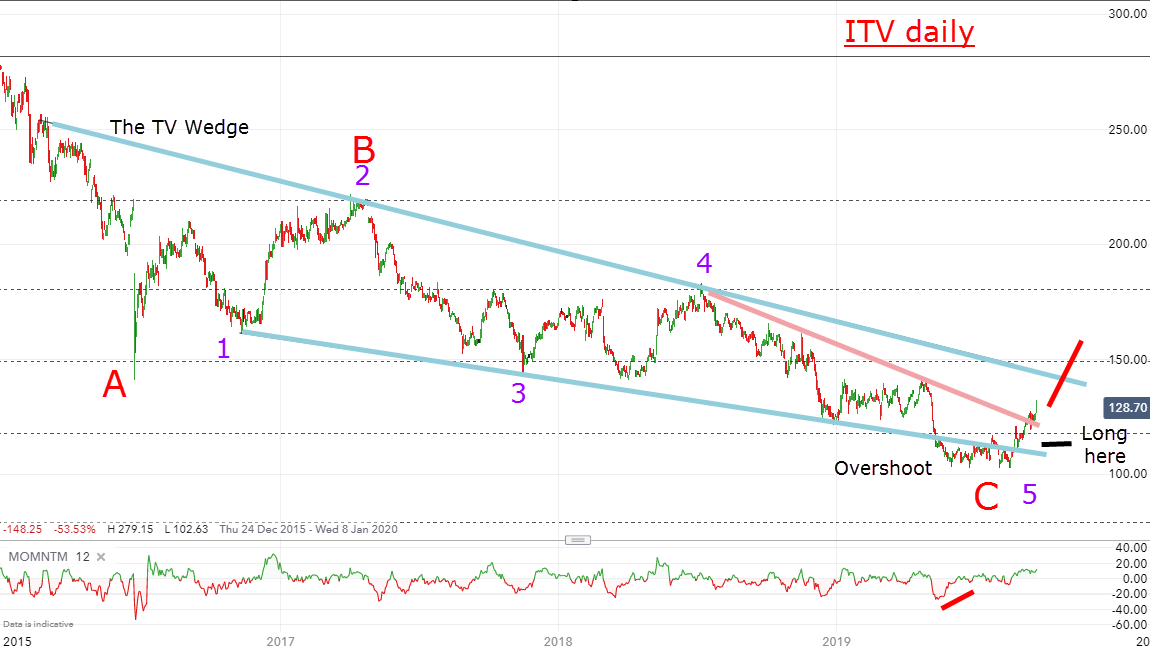
With selling pressure drying up and sentiment still pretty much at rock bottom, the market is poised for a high prob rally. Here is the daily
And what a picture! First off, I have a lovely wedge pattern (or ending diagonal) with the requisite five clear waves. Not only that, but I have a significant ‘overshoot’ of the lower wedge line that frequently signals a selling climax provided that the low holds.
And since our long entry, the shares have edged up past the minor pink trendline and is heading for the upper blue trendline.
So with these simple tools, I have managed to locate a precision-timed entry as well as guess the correct direction. Of course, it is early days, but at least I have a promising position at very low risk. But as we all know, getting a good entry is only part of the process of making a profitable trade. Much more work beckons in the management of the trade – which is an area of trading little understood by most.
Highly accurate timing of my entries is of utmost priority. I try to avoid sitting with a losing position for long – I want to see a gain right off the bat. One reason is that with a losing position, you are tying up capital you could employ elsewhere – a waste all round. Another reason? It’s that with an instant gain, I can set a close stop to protect capital in case I am wrong.
This is all part of my money management strategy...
