Market Overview
The Coronavirus continues to spread and the number of deaths is accelerating. Market fear over is growing. Volatility is spiking higher and on Friday, Wall Street had its biggest down day since August. On Friday, the VIX Index of S&P 500 options volatility reached 20, which was near four month highs. The mindset of trading through the newsflow of the Coronavirus has changed. There have been wild fluctuations on the VIX in the past week, but the net move is that fear is still growing. There is no confidence in buying into weakness now. The moments of positivity are simply providing fuel for the next sell off. Subsequently, we have seen the traditional safe haven assets benefitting as bond yields continue to track lower, the yen is the go to forex major and gold is trending higher. Risker assets are on the brink too.
This morning we see the oil price flirting with 12 month lows, whilst the Aussie is close to its lowest level since 2009. Equity markets are also threatening to form medium term top patterns (DAX, Dow). This morning’s Caixin Manufacturing PMI was a slight miss at 51.1 (51.3 exp, 51.5 in December), but at least for now continues to expand. This has helped engender a degree of support, as the People’s Bank of China has injected 1.2 trillion yuan (c. $170bn) of liquidity. Further easing measures are likely too (perhaps another cut to the reserve requirement ratio). The main move is a rebound in risk, with bond yields higher and a move back into the dollar (after Friday’s decline). The move has allowed an early equity rebound, but how long it lasts for is another matter.
Wall Street fell sharply on Friday with the S&P 500 -1.8% at 3225. US futures have rebounded this morning though at +0.7%. A mixed session in Asia, as China returns from the week long lunar new year break, the Shanghai Composite fell by -7.7%, with the Nikkei -1.0%. However, European markets are tentatively higher early today with FTSE Futures +0.4% and DAX Futures +0.2%.
In forex, there is a risk rebound with AUD and NZD outperforming a stronger USD. JPY is an underperformer along with GBP. In commodities, gold is around a percent lower at -$14, whilst oil is mixed.
The first trading day of the new month is dominated by the manufacturing PMIs on the economic calendar. The Eurozone final Manufacturing PMI is at 09:00 GMT and is expected to be confirmed at 47.8 (47.8 flash) which would be up from the 46.3 in December. The UK final Manufacturing PMI is at 09:30 GMT and is expected to be 49.8 (49.8 flash January) which is considerably better than the 47.5 in December but still a shade in contraction. The US ISM Manufacturing is expected to improve to 48.5 (up from 47.2 in December).
Chart of the Day – AUD/USD
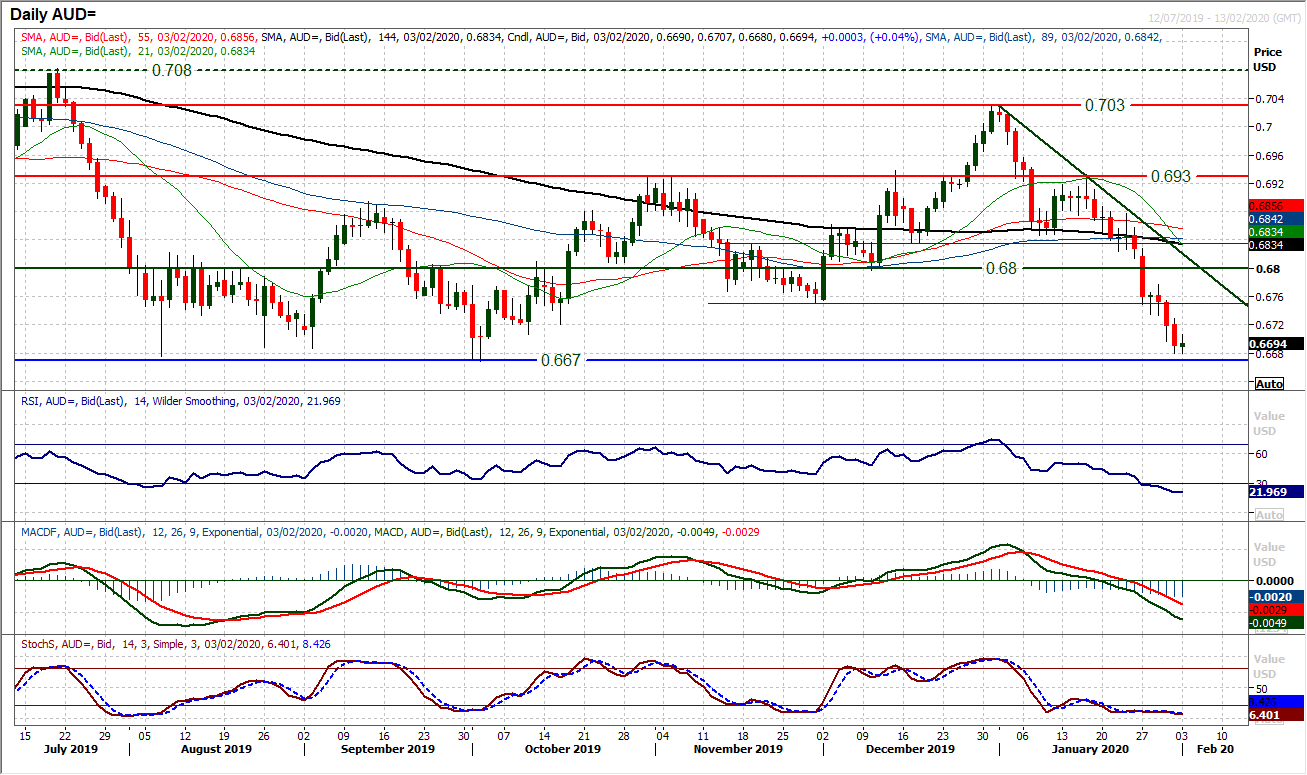
The outbreak of the Coronavirus has absolutely smashed the Aussie. Anyone bullish of the Australian dollar will be glad to see the back of January which has been an absolutely shocking month. The decline back from $0.7030 has sold off almost 5% and is now on the brink of a huge support level. However, the weakness may not be over quite yet. The lows of August through to September where AUD/USD found support at $0.6670 is now under threat. A downside break would take the Aussie to its lowest level since March 2009 (i.e. when financial markets started to rally from the nadir of the GFC). Momentum is deeply negative with the move as the RSI drops to 20 and MACD lines accelerate below neutral. However, the magnitude of the bear candles and massive bearish configuration on momentum reflects a huge bear trending market. Subsequently, such is the importance of the long term floor, a breach of the $0.6670 support may not stop. It is therefore vital that the bulls protect the support. An early tick higher from $0.6680 does not look to be up to much at this stage and we continue to see intraday rallies as a chance to sell. Above resistance at $0.6735/$0.6775 is needed to realistically change the near term outlook.
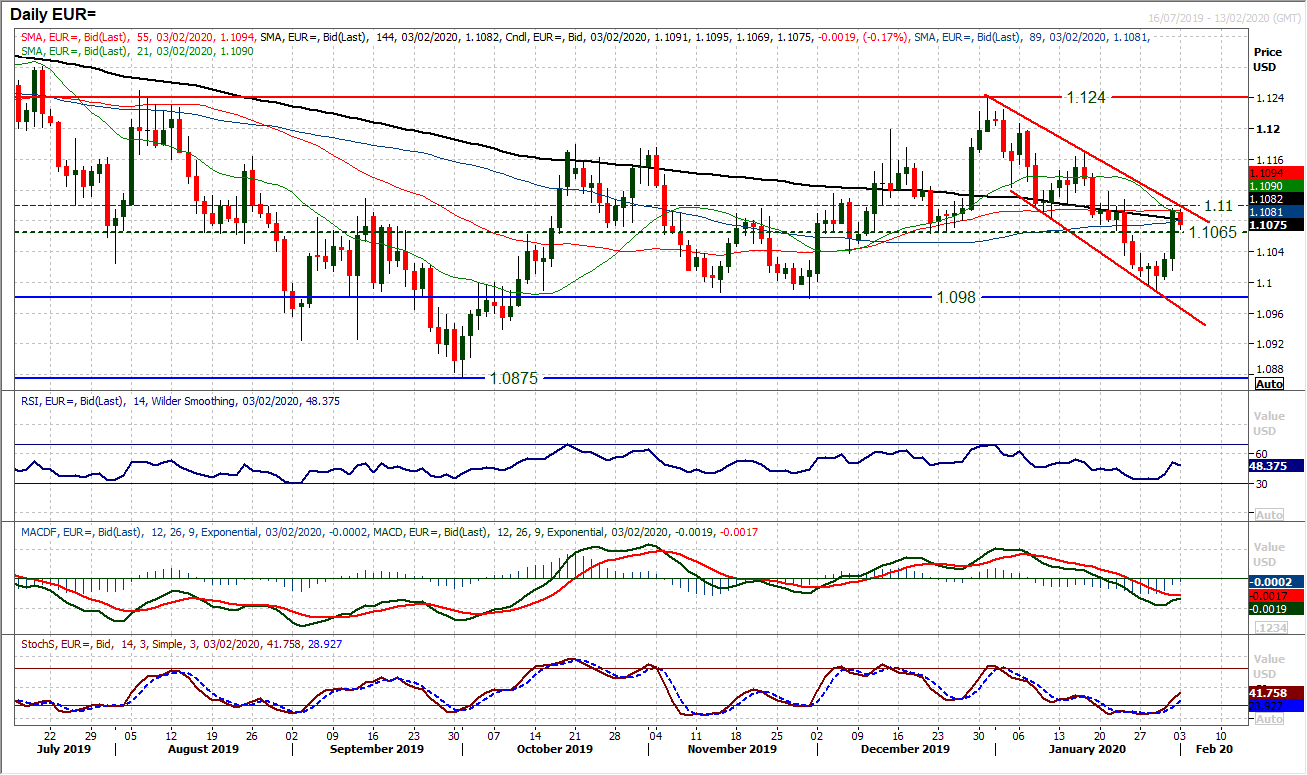
A near term rally has set in. Friday’s huge positive candle (a second in a row) has swung the euro bulls back into the driving seat. The market has gone from testing the bottom of the downtrend channel, to testing the top. The question is, for how long will the rally last? We are still mindful that this move is still an unwind within a bear trend channel. However, the rebound is through $1.1065 and the top of the channel and medium term pivot at $1.1100 is being tested. How the bulls respond to this move will be key now. Momentum indicators have swung higher as part of the near term rally, with the RSI back towards 50 and Stochastics crossing back above 20. However, the RSI faltered between 50/55 during the mid-latter January rallies, so this is a level to watch with interest today. The initial slip back from Friday’s high of $1.1095 suggests this is an important moment. A closing upside breach of the channel would be dollar negative and re-open the January key high of $1.1070. The old $1.1065 level now becomes supportive initially.
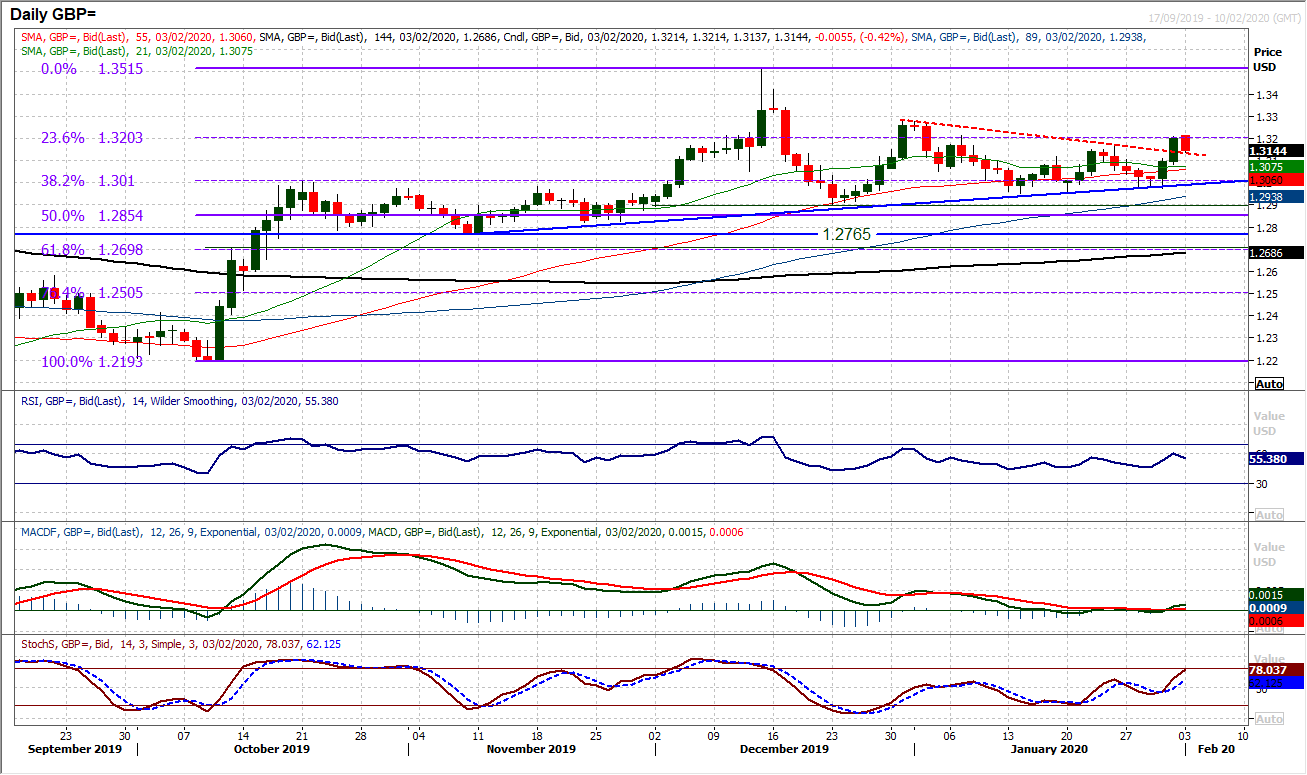
Two decisive strong bull candles have completely changed the near term outlook again on Cable. The market has not only broken clear of what had been a consolidation triangle, but also moved above the resistance at $1.3170. How the bulls respond to this move today will go a long way to deciphering whether this move is a real signal of intent by the sterling bulls in the wake of the Bank of England meeting. The initial slip back is a concern for those looking for a trending move. Over the past few weeks there has been a series of choppy phases of bull and bear moves, with neither able to maintain any sense of traction. The minor positive bias on momentum indicators (MACD edging higher a shade above neutral, Stochastics swinging higher, and RSI above 50) all confirms Friday’s price move to a three week high. However, instantly losing -40 pips on Monday morning is not a great sign for the bulls. The hourly chart shows a basis of support $1.3140/$1.3170 initially and if this were to be breached then the breakout quickly loses its way. Below $1.3100 would re-open $1.3000. Initial resistance at $1.3215.
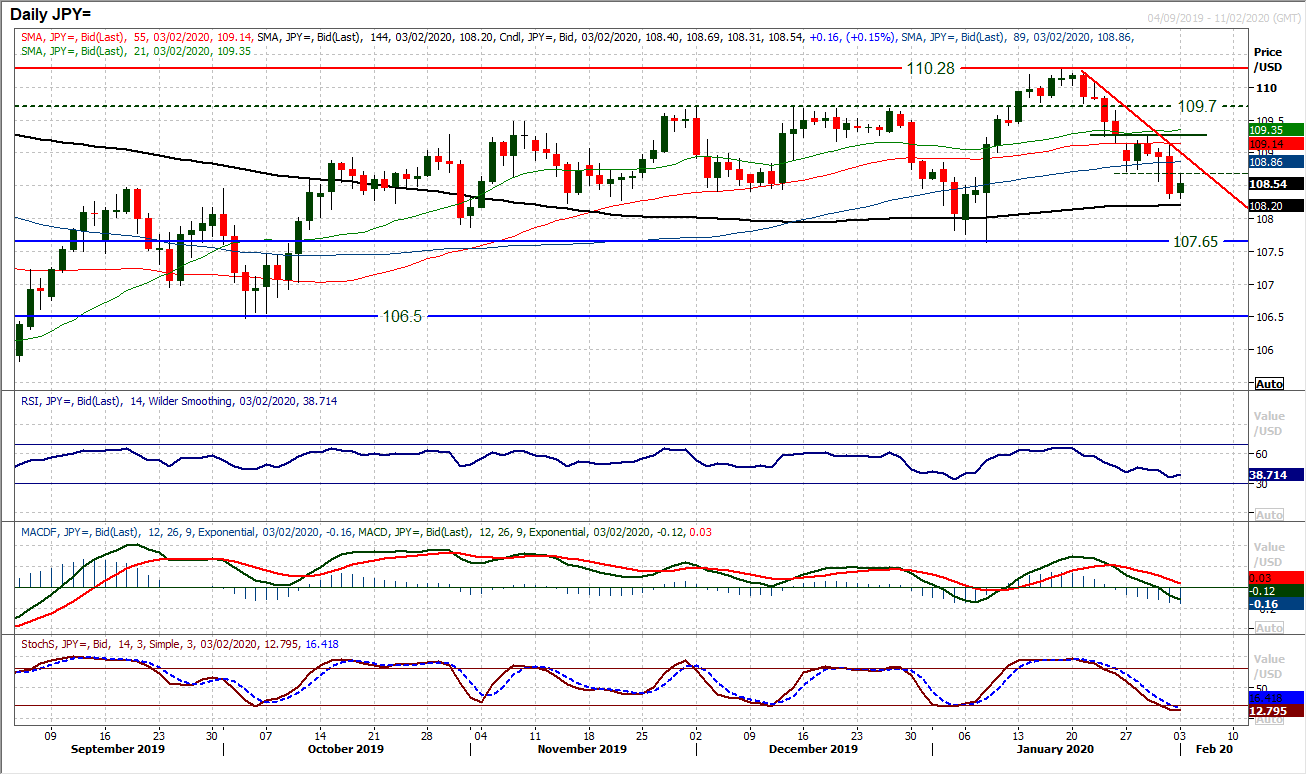
The choppy consolidation of the past week has resolved with a decisive downside break. Dropping to three week lows, the market is continuing the corrective move which is running lower highs and lower lows. A move to test the key support of the January low at 107.65 is now likely. With momentum indicators corrective, rallies have to be seen as a chance to sell now. The RSI failing under 50 and slipping below 40, whilst Stochastics into bear configuration and the MACD lines are about to both fall below neutral. Initial resistance is in the band between 108.50/108.70. It would only now be a move above 109.15 that would change the corrective outlook. The hourly chart shows any unwind on the hourly RSI into 50/60 is seen as a selling opportunity.
Gold
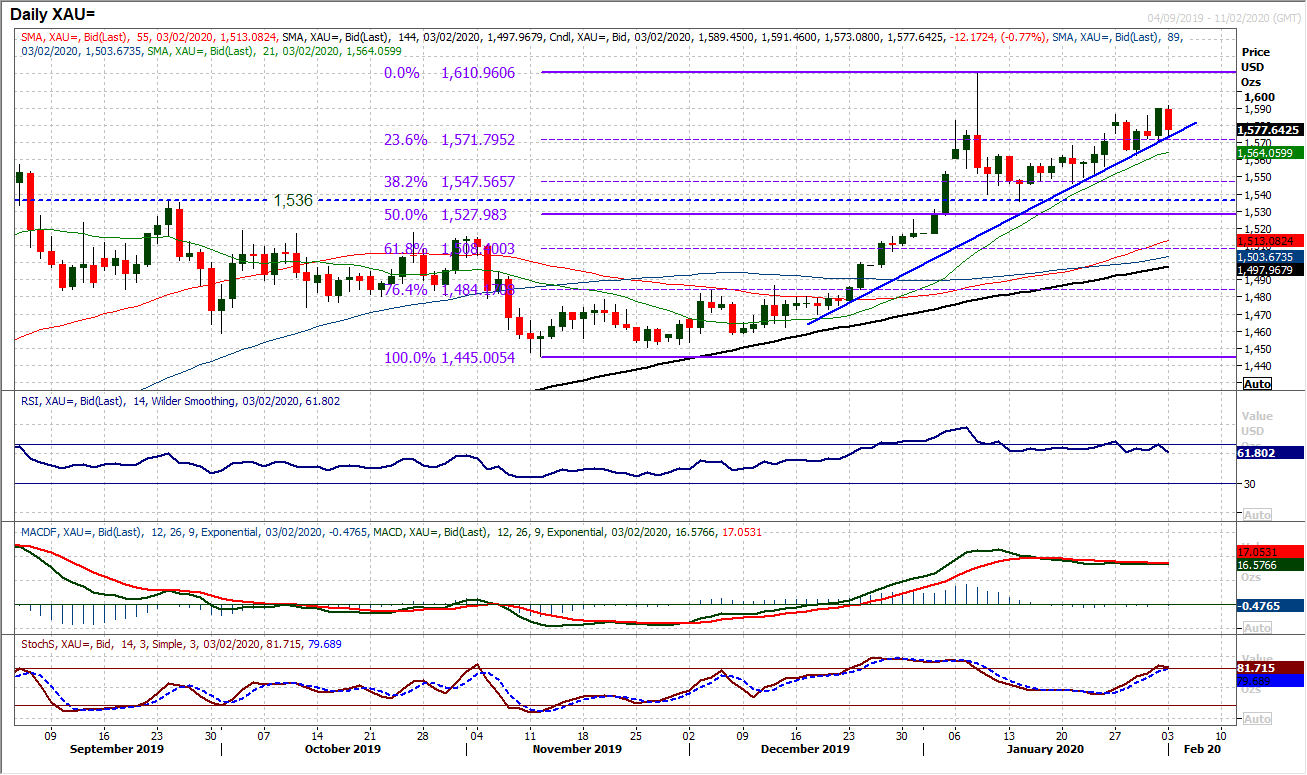
Gold continues to climb along the tight support of the six week uptrend. However, there are distinct timing issues with running this trend higher, as every time it looks as though the market is running for a breakout, the bulls are just dragged back again. Friday’s decisive bull candle looked like another breakout in the making, but already this morning the market has unwound back from $1590 more than -$10. The trend sits at $1574 today and has been hit almost to the tick in six of the past nine sessions before pulling higher again. The 23.6% Fib is supportive at $1572, whilst $1562 is a higher low now. We continue to look for weakness as a chance to buy for a test of $1611 but are also mindful that there are elements that this is very much a news driven rally too. For now, momentum indicators are positive, but without being especially strong. The RSI is still just hovering between 60/70 and MACD lines effectively flat. Below $1572 and the market begins to look a little less positive.
WTI Oil
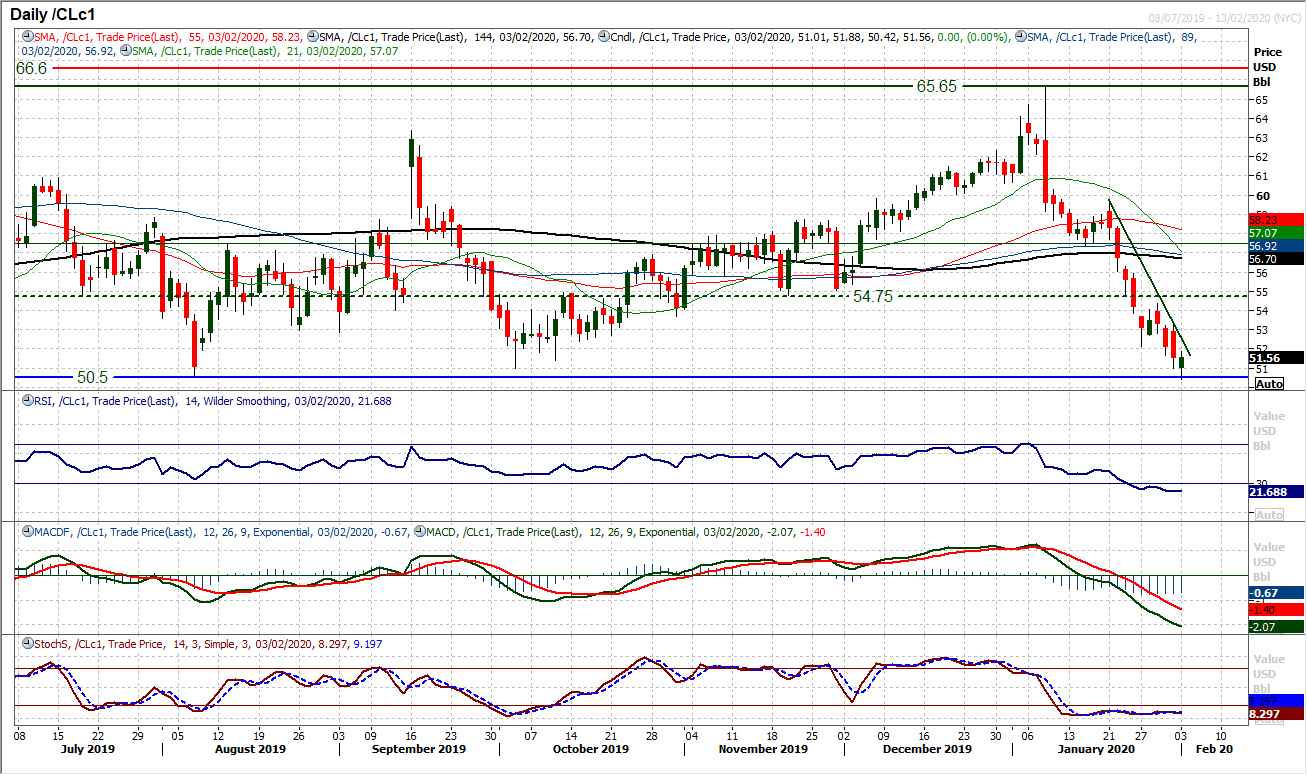
Oil is on the brink of a massive downside break. Since January 2019, WTI has been trading in a broad range $50.50/$66.60. However, the sell off of the past few weeks has quickly moved from eyeing the range highs, to testing the range low today. A closing break below $50.50 (and confirmed below $50) would be a huge move that would re-open the even more important support around $42.00. However, if this is a range, then this is a classic moment for the bulls to step up. The RSI is at 21 again, where the RSI turned around the last time $50.50 was hit (in June 2019). The early technical rebound from $50.42 is encouraging, but by no means enough to be confident of as the market is still trading down on the day. Resistance overhead at $52.15/$53.35 needs to be breached. The red warning lights of a breakdown are still flashing.
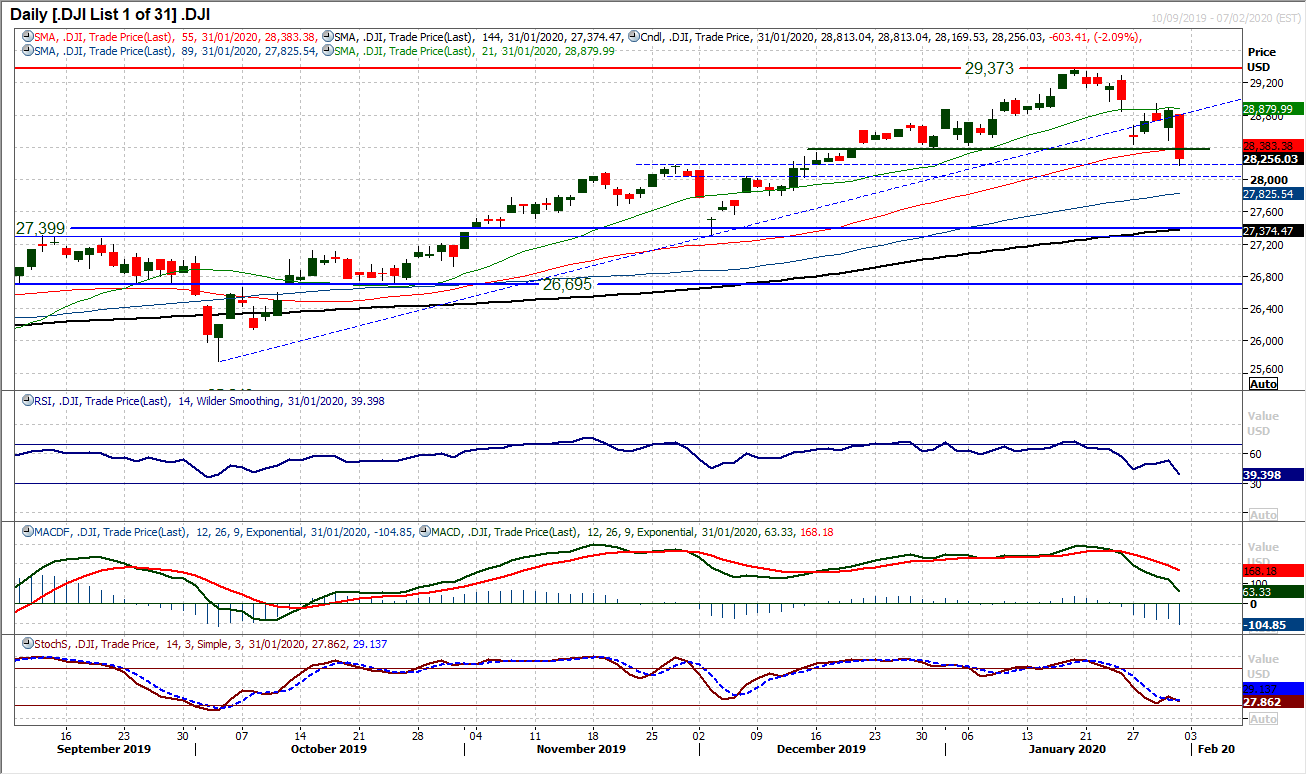
For the past week the Dow has been holding up well in the face of potential corrective pressure. However, the prospect of a head and shoulders top pattern formation has been looming. On Friday, this pattern completed with a decisive bear candle. A big down day of over -2% has seen the market close below 28,376 for the first breakdown of a key higher low. The trend has turned and now the Dow is into a phase of lower highs and lower lows. The market will be in a corrective phase until a break back above 28,944. Momentum is now corrective with the RSI confirming the breakdown and at four month lows under 40. MACD and Stochastics are also suggesting selling into strength. The pattern is c. -1000 ticks of downside implied target now meaning the old 27,300/27,400 pivot area comes into view. Next support at 28,175. The neckline at 28,376 is initial resistance today.
"""DISCLAIMER: This report does not constitute personal investment advice, nor does it take into account the individual financial circumstances or objectives of the clients who receive it. All information and research produced by Hantec Markets is intended to be general in nature; it does not constitute a recommendation or offer for the purchase or sale of any financial instrument, nor should it be construed as such.
All of the views or suggestions within this report are those solely and exclusively of the author, and accurately reflect his personal views about any and all of the subject instruments and are presented to the best of the author’s knowledge. Any person relying on this report to undertake trading does so entirely at his/her own risk and Hantec Markets does not accept any liability. """
